
Many cryptocurrencies witnessed a resurgence of bullish action in July and August 2020, as weakness in the US Dollar persisted and provided an opportunity for a possible flight towards alternative assets. Accordingly, Ripple’s (XRP-USD) price on the XRPUSD trading pair witnessed a short bullish run which seems to be searching for follow-through action. What is the outlook for XRPUSD today?
Fundamental Analysis
The major news for Ripple this last day of August focuses on some heavy trading action on the Ripple asset, with XRPL Monitor reporting that 20 million XRP tokens were moved by a “whale,” with Coinbase Pro receiving half of the transaction amount. This transaction was said to have taken place between August 30 and 31. Other hefty transactions were reported, with former CEO Chris Larsen reportedly receiving a large stash of XRP.
Ripple Labs CEO Brad Garlinghouse has also predicted a further fall in the US Dollar. In a tweet posted on his page, Garlinghouse posited that signs were pointing to “further dollar debasement in the near term.”
USD sentiment has been quite weak in the last two months as the US Federal Reserve has held interest rates at near-zero levels, and may do so for a long time to come. This has the potential to continue to spur investment shift towards better yielding assets, and cryptocurrencies such as XRP could be a beneficiary of this factor.
Technical Analysis
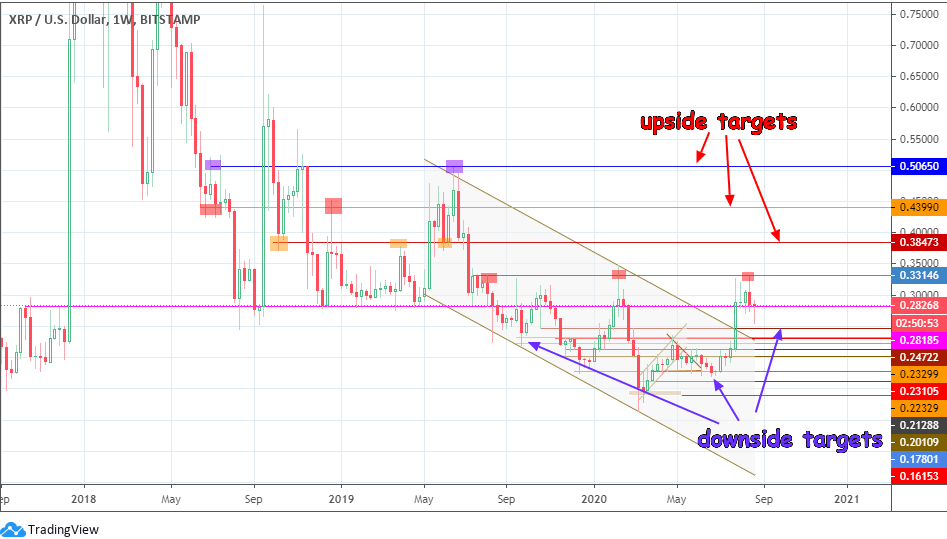
The technical analysis for XRPUSD starts from the weekly chart, where we can see that the price action for August has been mostly bullish, enabling the pair to break above the descending channel on the weekly chart. However, this move appears to have met resistance at the 0.33146 price level, which coincides with previous highs seen in August/September 2019.
XRPUSD Weekly Chart: August 31, 2020
In order to get a better view of short-term price action, the daily chart is called up. This chart reveals that price action has been caught in a short-term consolidation, provided by the falling wedge pattern. This wedge is a retracement on the price push above the descending channel, and may even be considered to be a bullish pennant if the wedge consolidation area and the bullish price move that preceded it are considered as a single entity.
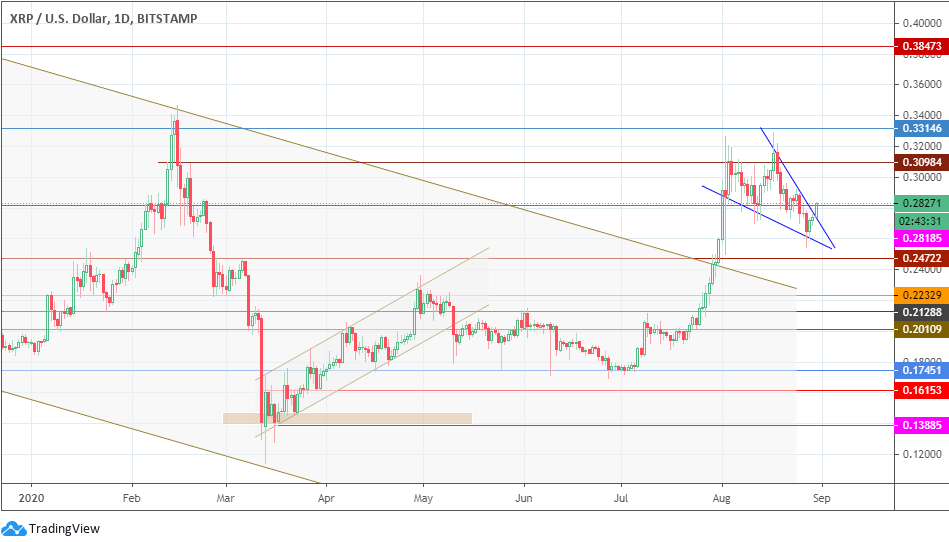
XRPUSD Daily Chart: August 31, 2020
The technical expectation for the setup is for price to break above the wedge component of this pattern, so that price can continue in the direction of the previous short-term trend. Price has started to break above this wedge, but seems to have encountered short-term resistance at the 0.28185 price level.
Bitcoin prices have not broken below the 11,000 mark for nearly a month now on the back of heavy USD weakness. This could support a case for another push to the upside for both BTCUSD and its correlated asset, XRPUSD. The XRPUSD pair has to break above 0.28185 in order to approach the 0.30984 price target (19 February and 8 August 2020 highs). Above this level, 0.33146 constitutes another upside target. If the price move from 0.17451 (July 2020 lows) to the present time is considered, the price objective for the breakout from the wedge would 0.38473. This upside target would correspond to the measured move from the July 2020 lows to the entrance point into the wedge pattern.
On the flip side, a rejection at the 0.28185 resistance could lead to a pullback move, which would invalidate the pattern if it causes a decline towards 0.24722. Extension of this decline could also target the lows of 16/20 January as well as lows of 26 February to 1 March 2020 at 0.22329. The low of 24 January and 26 July also correspond to the highs of 11 March/2 June at 0.21288, and this forms the next downside target below 0.22329. Supporting this outlook would be some USD strength as well as a fall in BTC prices.
Market Sentiment
The market sentiment for XRPUSD is as follows:
- Long term: Neutral
- Medium term: neutral
- Short term: bullish
Long term, the outlook for XRPUSD remains neutral, as price has traded within a horizontal range formed by the 15 cents floor and 36 cents ceiling since January 2019. The medium-term outlook also remains neutral, as price would have to breach the ceiling at 36 cents and possibly also break above the 38 cents barrier to switch towards a bullish outlook. Price is expected to stage an upside push above the falling wedge on the daily chart, providing a bullish outlook in the near term.
Did you know that Bitcoin is up +83% since 1/1/20? As world markets plummet due to COVID, investors are turning to crypto now more than ever.
We provide news, research, technical analysis and more at the Coin Agora on all things crypto!
Sign up now and get instant access to our Pick Portfolio – where three of our picks are up more than 180% in the last 12 months.
Disclosure: I/we have no positions in any stocks mentioned, and no plans to initiate any positions within the next 72 hours. I wrote this article myself, and it expresses my own opinions. I am not receiving compensation for it (other than from Seeking Alpha). I have no business relationship with any company whose stock is mentioned in this article.