
The Ethereum price has once again touched the $400 mark. It seems that the ETH/USD price is again on the path of development but we can only confirm this if it stays above $400. At the time of writing this, the Ethereum price is sitting at $401.09 (+2.70%) and it has increased by almost +2.70% in the last 24 hours but in the last 1 hr, the price has not increased and it may again drop to $399. Let’s take a look at it in more detail.
Ethereum Price Analysis: ETH Price Must Stay Above $400
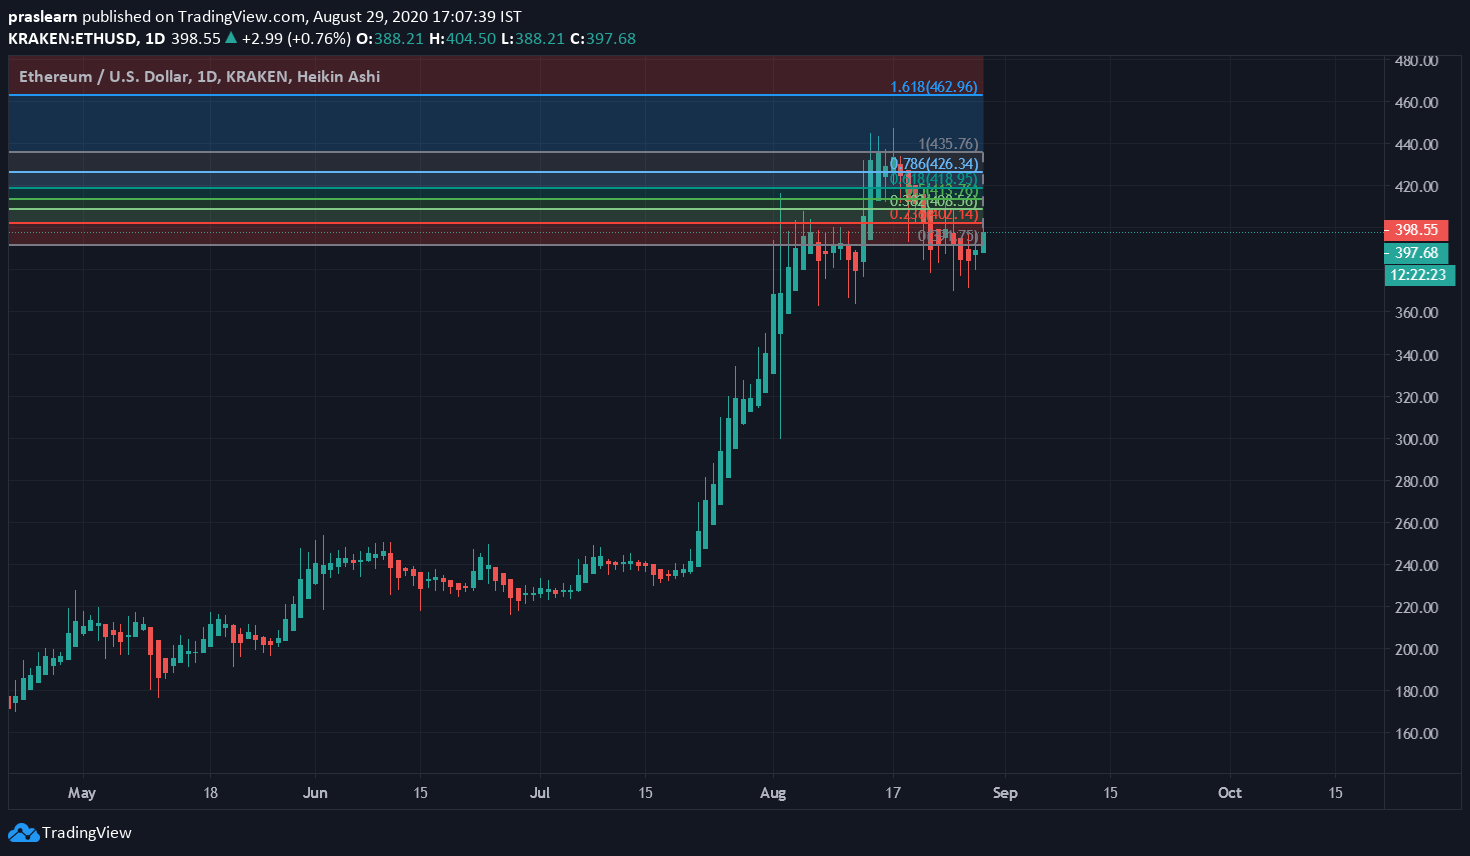
Ethereum Price Analysis of 1 Day: ETH/USD 1 Day Chart: Tradingview
In the last 7 days, the Ethereum price against USD has changed by only +1.86%. Now, Ethereum’s price performance (ROI) over the past 90 days, vs USD has been excellent and the price has changed by almost +73%. If we closely observe then we will find that from the past 30 days or something the ETH price is not displaying the strong bullish momentum. The good thing is that it is not decreasing drastically. So, the Ethereum price needs to stay above $400 consistently for the next few days to once again regain the proper bullish momentum.
Now, in the early hours of Saturday, the ETH price dropped from $393 to $392.52 but then again it increased slightly. As per the 1 day ETH/USD price chart, it seems that the Ethereum price only needs to conquer a few crucial resistance levels to stay comfortably in the $400 and $420 territory. Now, if we closely analyze the daily price chart then at the moment the ETH has multiple resistance levels. The most crucial levels are:

- 0.236 Fib ($402.14)
- 0.382 Fib ($408.56)
- 0.618 Fib ($418.95)
- 0.786 Fib ($426.34)
Now on the downside, if the bears wish to maintain their drive, they’ll need to drop below the $397.34 and then this could be a major concern for its growth. On the other hand, if we closely observe then we will find that the Ethereum price has not much decreased in the past 7 days and it is showing lazy momentum. Now, the Ethereum price Sharpe ratio, calculated over the past 30 days of daily returns is greater than 3.54 and this could be a good sign for ETH price in the next 7 days. As mentioned earlier, the ETH/USD price must stay above $400 to gain a proper bullish momentum.
Ethereum Price Analysis: ETH Price is displaying the bullish buying opportunity?
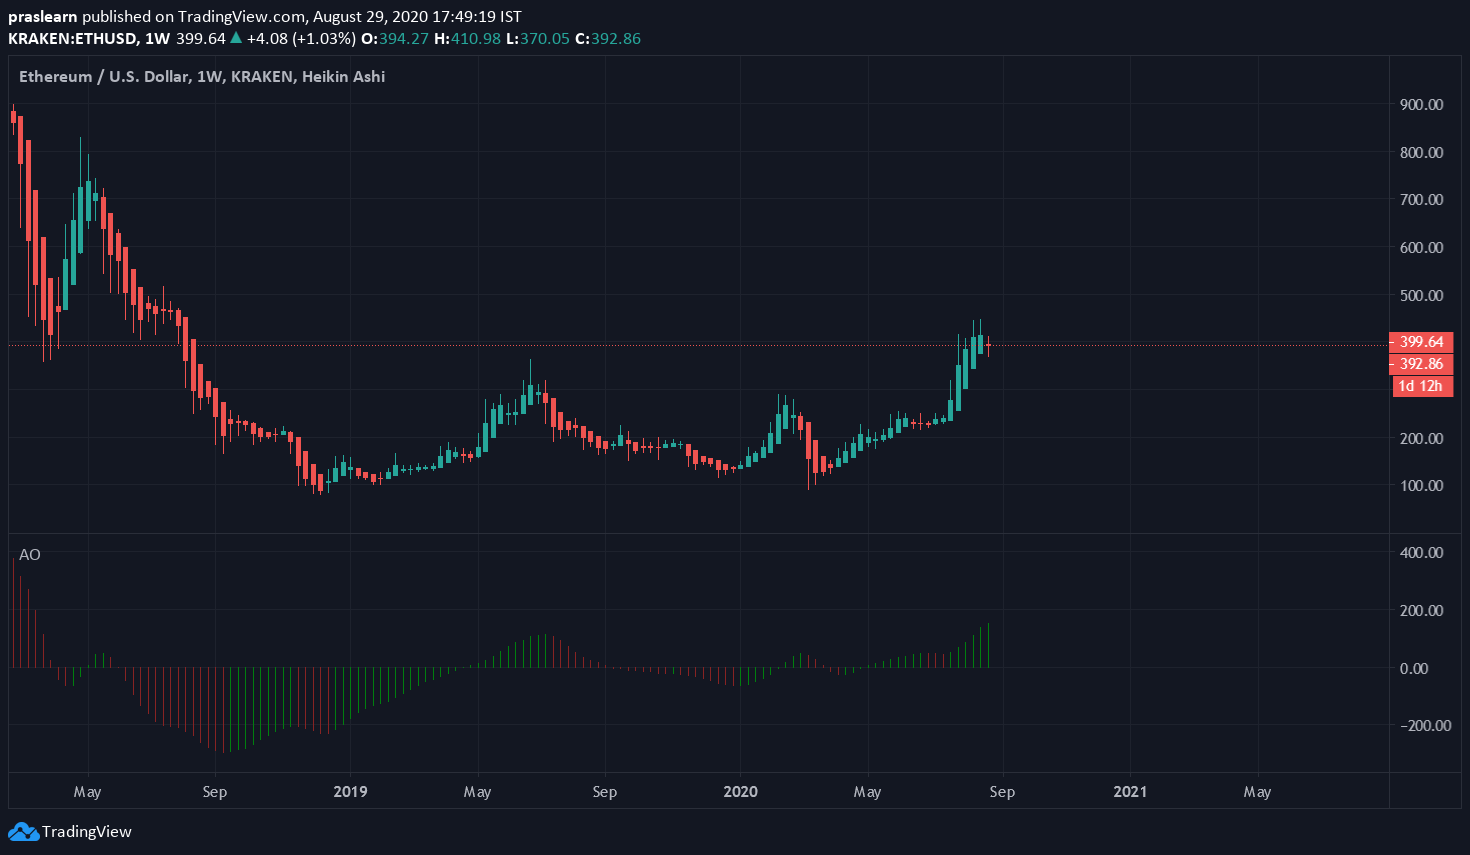
Ethereum Price Analysis of 1 Week: ETH/USD 1 Week Chart: Tradingview
Now, if we closely observe the weekly price chart, then as per the Awesome Oscillator and the difference of a 34 Period and 5 Period Simple Moving Averages, the AO is above the Zero Line and due to that, it could be assumed that the short term momentum is now rising faster than the long term momentum. This can give a bullish buying opportunity. The key metrics are as follows:
- Price $399.52
- 24hr Change +1.89%
- 24hr Vol $771,737,475
- Liquid Marketcap $44,696,712,992
- Liquid Supply 111,800,770
Conclusion
In our previous Ethereum Price Analysis, we had mentioned that ETH is showing signs of laziness and it is still showing no proper momentum. The price has momentarily touched the $400 mark but once again at the time of finishing this the ETH/USD price is between $398.13-$400. So, it seems that bulls may look to gain momentum above $400 mark in expectation of a strong come back towards the 0.618 Fib ($418.95) and 0.786 Fib ($426.34) levels. But before that, the Ethereum price must touch the psychological level of $400 once more. We wish you happy trading!

In order to support and motivate the CryptoTicker team, especially in times of Corona, to continue to deliver good content, we would like to ask you to donate a small amount. Independent journalism can only survive if we stick together as a society. Thank you

Nexo – Your Crypto Banking Account
Instant Crypto Credit Lines™ from only 5.9% APR. Earn up to 8% interest per year on your Stablecoins, USD, EUR & GBP. $100 million custodial insurance.
Ad
This post may contain promotional links that help us fund the site. When you click on the links, we receive a commission – but the prices do not change for you! 🙂
Disclaimer: The authors of this website may have invested in crypto currencies themselves. They are not financial advisors and only express their opinions. Anyone considering investing in crypto currencies should be well informed about these high-risk assets.
Trading with financial products, especially with CFDs involves a high level of risk and is therefore not suitable for security-conscious investors. CFDs are complex instruments and carry a high risk of losing money quickly through leverage. Be aware that most private Investors lose money, if they decide to trade CFDs. Any type of trading and speculation in financial products that can produce an unusually high return is also associated with increased risk to lose money. Note that past gains are no guarantee of positive results in the future.
You might also like
More from Ethereum

Why Is OMG Network Booming?
The OMG Network (OMG) token skyrocketed recently with its price rising from $1.88 to $6.55 (with a high of $9.57) …

The ETH/BTC Flippening Index Approaches 62% As 45K BTCs Are Tokenized On Ethereum!
The flippening index has reached an all time high of 61.9%, as key Ethereum metrics show significant improvement over their …

DeFi Approaches $6.5 Billion TVL! Here Are The Top 5 Emerging Protocols
The rapidly progressing world of Decentralized Finance (DeFi) hit a new milestone as the Total Value Locked (TVL) figure appears …