
- Bitcoin price dumps amidst recent US CPI release.
- Ethereum’s price falls to $1,215 and is likely to continue declining.
- Ripple pulls back after a strong decline. Technicals have room to fall lower.
The crypto market experienced an early morning sell-off. The market is now rallying after the sharp decline but has the potential to decline further.
Bitcoin price dumps
Bitcoin price has lost support from the $19,000 barrier as a strong influx of bearish power has poured into the market. On Thursday, October 13, the peer-to-peer digital currency fell 5% in less than an hour upon the release of US September CPI data that came in higher than expected.
Bitcoin price currently auctions at $18,915. An uptick of volume has been spotted amidst the decline, while the Relative Strength Index is now in oversold territory for the first time since September 8. If market conditions persist, a sweep of the summer lows at $17,621 could occur in the coming hours.
Invalidation of the bearish thesis is a breach above the recently crossed moving averages at $19,280. If the bulls can hurdle this boundary, a spike back toward $20,400 could occur, resulting in a 10% increase from the current Bitcoin price.
BTC/USDT 3-Hour Chart
In the following video, our analysts deep dive into the price action of Bitcoin, analyzing key levels of interest in the market. -FXStreet Team
Ethereum price will sweep the lows
Ethereum price is caught in an unfortunate scenario as the bears have recently breached the September lows. Upon the release of US CPI data, the decentralized smart contract token fell penny-from-Eiffel style into the previous month’s low.
Ethereum price auctions at $1,222. Like Bitcoin, the RSI is now in extremely oversold territory, which suggests any pullback will probably be short-lived. The 8-day exponential and 21-day simple moving averages have also produced a death cross near $1,322, which stands as a firm barrier of resistance.
This thesis proposes that the ETH price will eventually fall below the summer lows at $881, but the move south may take weeks to play out. Ultimately, strong support lies at $750. If the bulls do not hold support at this level, a $400 ETH price could become the norm sometime in 2023.
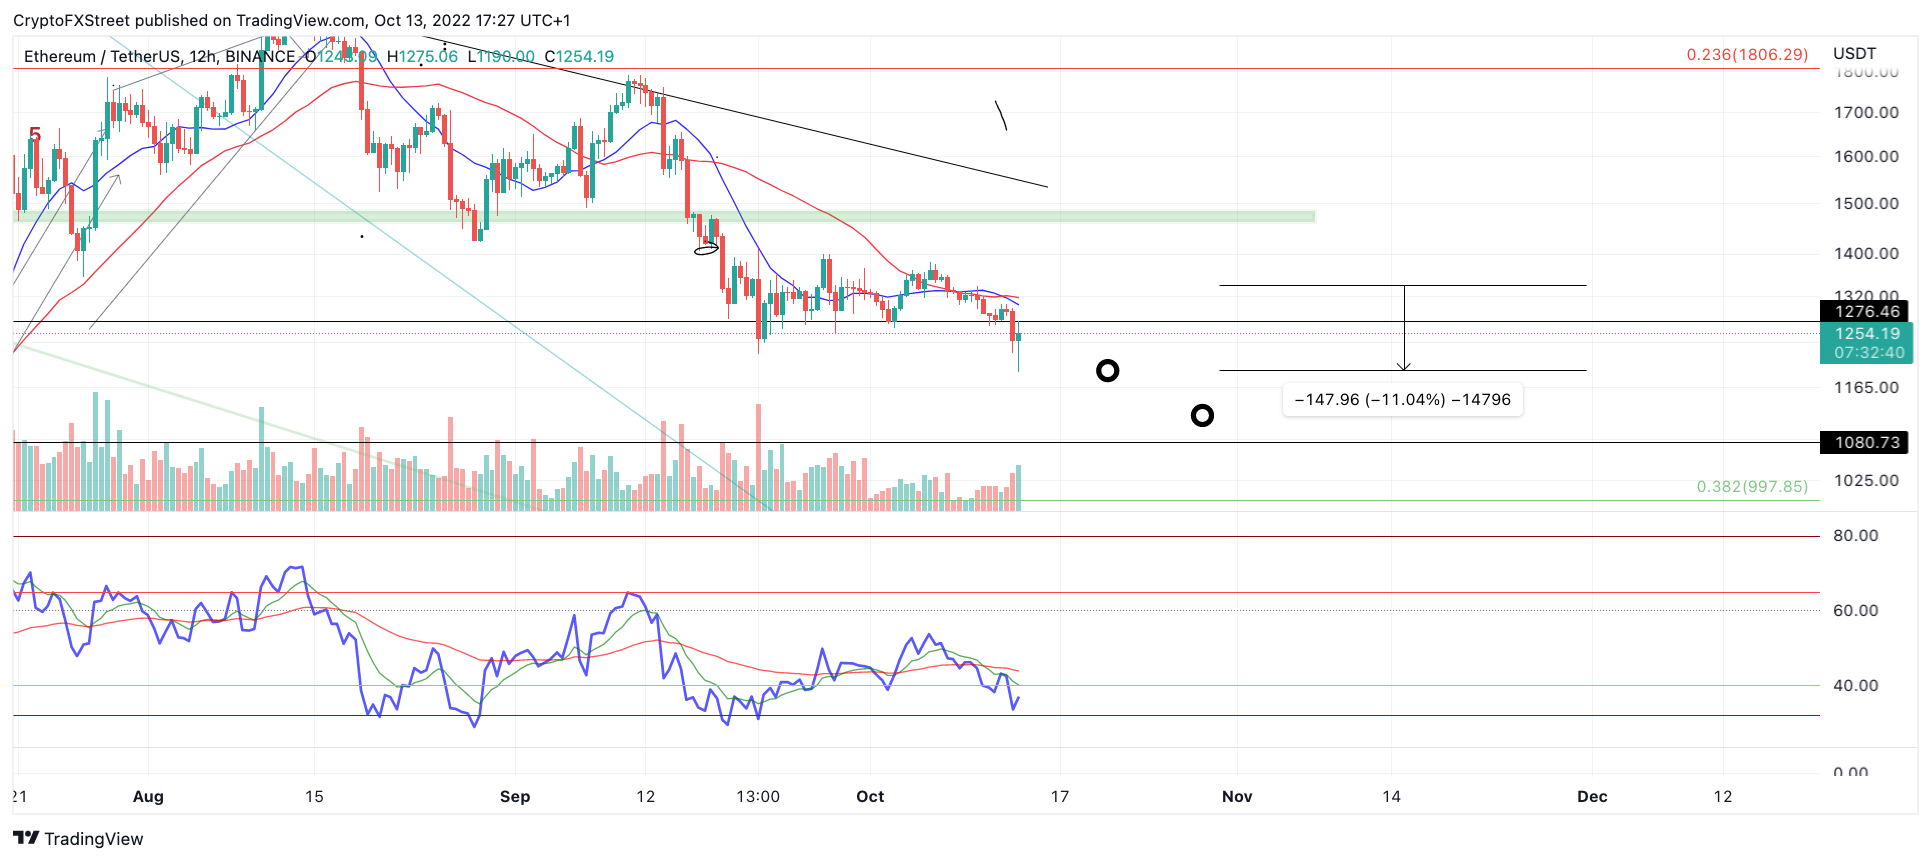
ETH/USDT 12-Hour Chart
In the following video, our analysts deep dive into the price action of Ethereum, analyzing key levels of interest in the market. -FXStreet Team
XRP price falls 10%
XRP price witnessed the strongest decline amongst the top 3 cryptocurrencies as the digital remittance token fell 10% following the US CPI release. The Relative Strength Index fell into historically oversold territory on smaller time frames, and an impressive countertrend rally has ensued.
XRP price currently auctions at $0.47 after falling to $0.44. During the decline, the bears breached both the 8-day exponential and 21-day simple moving averages. Based on the influx of volume during the landing site at $0.44, this thesis proposes that the XRP price will retrace back into the indicators near $0.51. Nonetheless, the XRP price still has more space to fall, and the current price action should only be viewed as a countertrend rally.
This thesis remains bearish with targets at $0.40, provided that the swing high at $0.56 remains unbreached. If the bulls hurdle $0.56, a rally towards $0.61 liquidity levels will be back on the table, resulting in a 32% increase from the current XRP price.
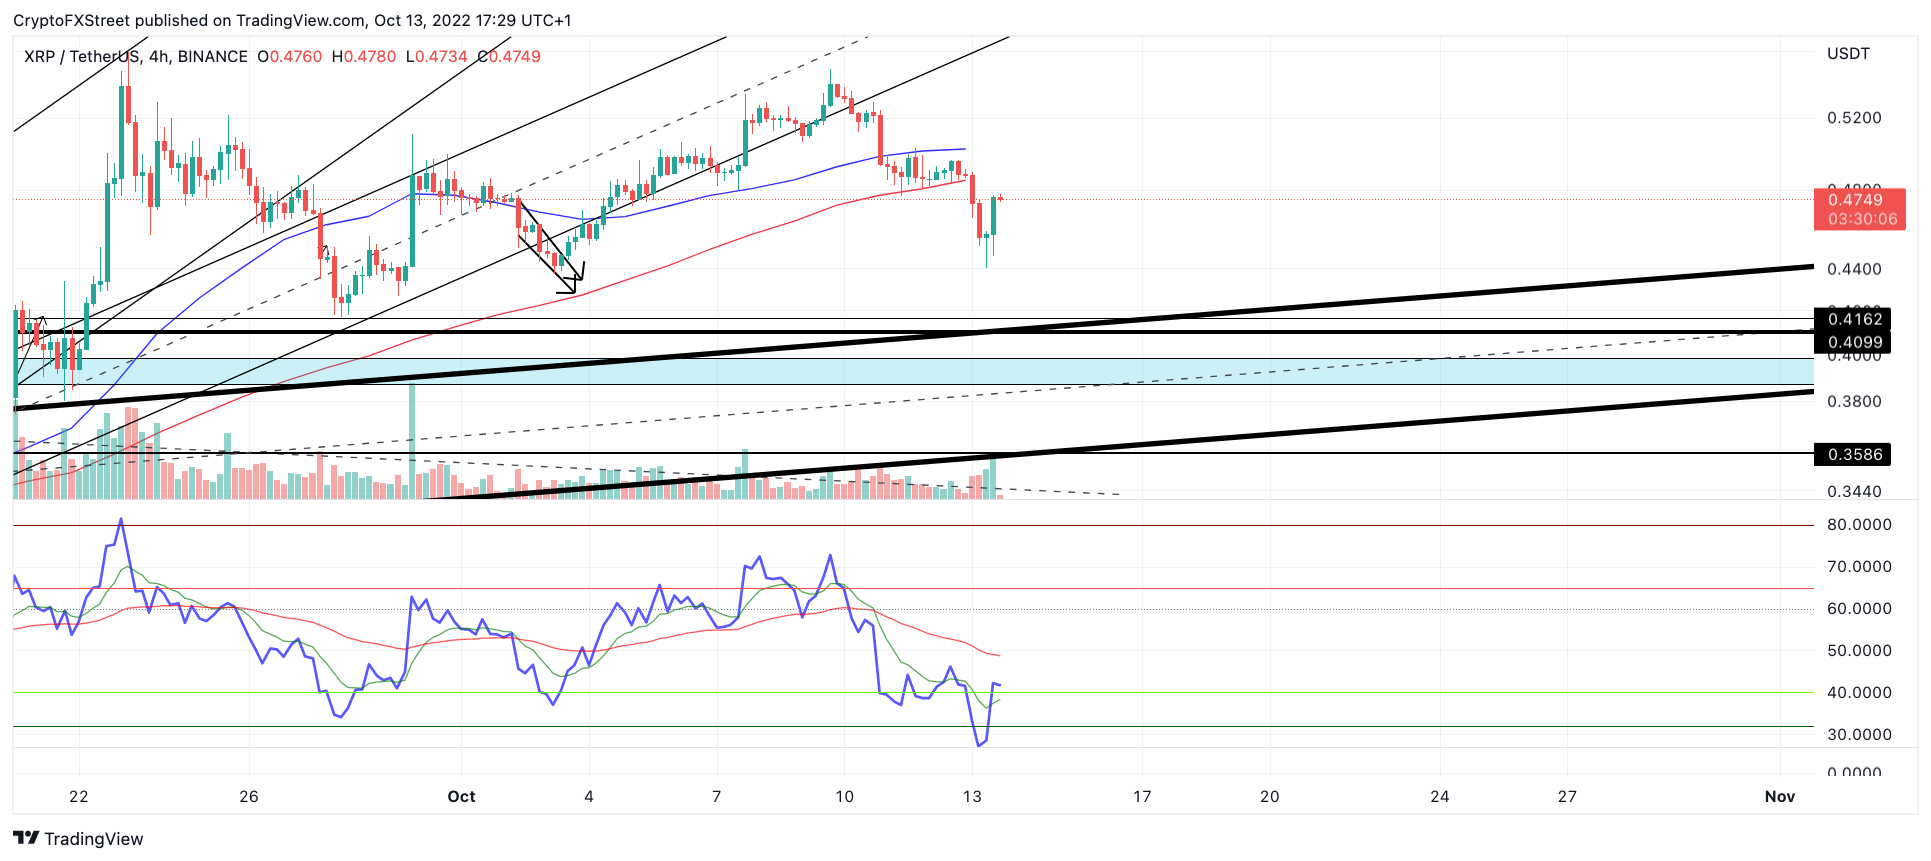
XRP/USDT 4-Hour Chart
In the following video, our analysts deep dive into the price action of Ripple, analyzing key levels of interest in the market. -FXStreet Team