
- Bitcoin price continues to slide lower after facing rejection at the 30-day EMA.
- Ethereum price follows the big crypto’s suit and is heading toward the lower limit of the $1,440 to $1,1280 range.
- Ripple price comes dangerously close to flipping the $0.464 support level into a resistance barrier.
Bitcoin price has shown no signs of slowing down since it began its sell-off on October 18. There is a high chance this trend will continue until BTC finds a stable support level. Until this happens, investors should be open to seeing Ethereum, Ripple and other altcoins also shed weight.
Bitcoin price undoes volatile swings
Bitcoin price saw a massive spike in volatility that resulted in a whipsaw that pushed it down to $17,917. But a spike in buying pressure caused an eventual recovery and bounce that formed a local top at $19,951.
Over the last two days, Bitcoin price has kick-started its retracement, which could retest the midpoint at $18,934. Market participants can expect a move down to the 70.5% Fibonacci retracement level at $18,517, whilst being aware there also exists the risk of a rebound.
In the event of a bounce at the aforementioned levels two major hurdles come up: the 30-day Exponential Moving Average (EMA) at $19.503 and the resistance area, extending from $20.306 to $20.737.
BTC/USD 8-hour chart
A daily candlestick close below $17,593 will invalidate the ‘bounce’ thesis and potentially trigger a sell-off to the $17,000 psychological level.
Ethereum price continues to consolidate
Ethereum price has been stuck between the $1,440 and $1,280 barriers since September 18 and shows no signs of breaking out. For the majority of this rangebound movement, ETH has traded close to the lower limit and is at risk of a breakdown if Bitcoin price does not cauterize its bleeding.
From there, a retest of the September 21 swing low at $1,220 could be possible, but if this move is followed by a quick recovery above $1,280, it could be manipulation from the market makers’ perspective.
If that is the case, market participants can expect Ethereum price to continue its recovery and potentially retest the $1,440 hurdle.
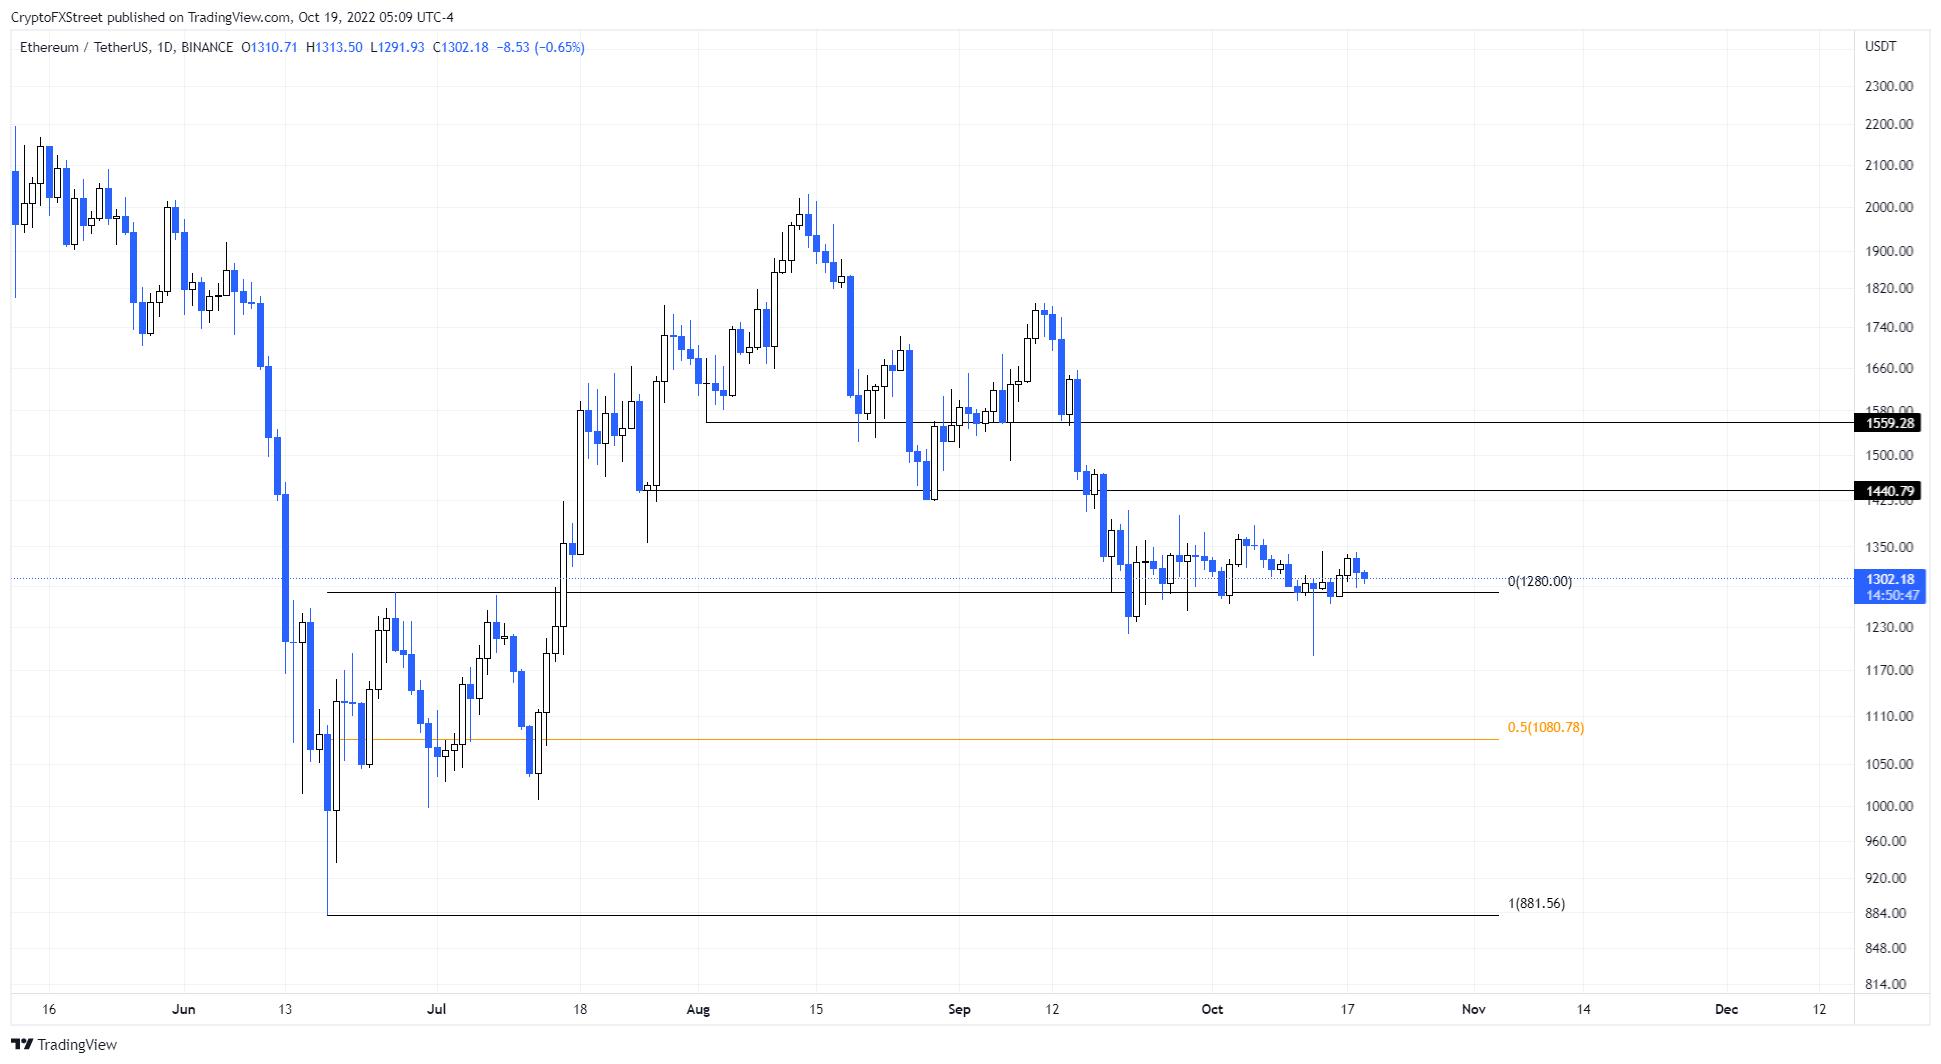
ETH/USD 1-day chart
Regardless of the ongoing consolidation, if Ethereum price produces a daily candlestick close below the $1,200 support level, it will invalidate the bullish thesis. This development could see ETH crash down to $1,080 and $1,000 support levels.
Ripple price at inflection point
Ripple price is eerily close to breaking its bullish market structure. A breakdown of the $0.464 to $0.331 range’s support limit will add a tailwind to the bears’ plan.
This development could see XRP price retest the $0.381 to $0.433 demand zone.A retest of the confluence at the aforementioned range’s midpoint at $0.397 would likely absorb the selling pressure, but it would also disrupt the bullish market structure.
As long as this confluence holds, there is a risk Ripple price could trigger a recovery bounce and retest the $0.561 to $0.596 resistance area.
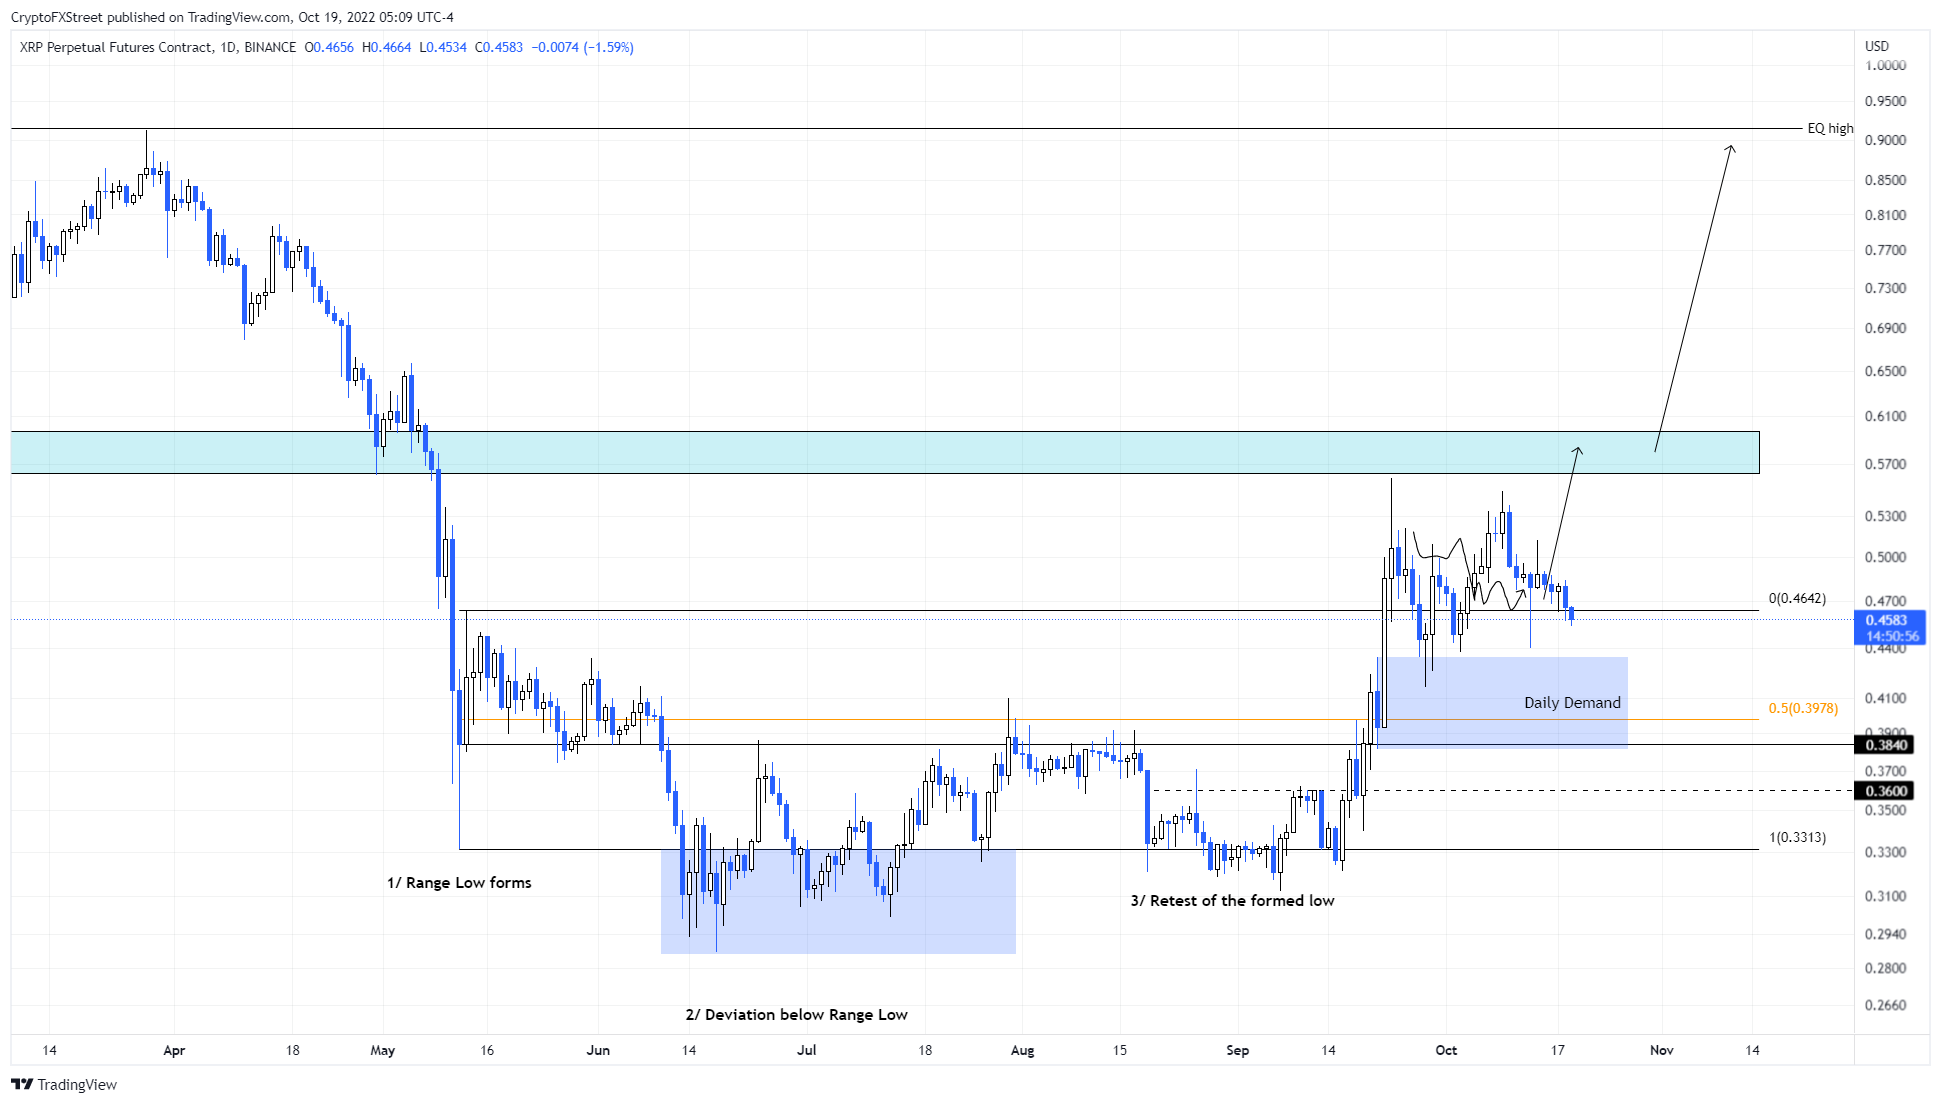
XRP/USD 1-day chart
On the other hand, if Ripple price slices through the $0.381 to $0.433 demand zone’s lower limit, it would invalidate the bullish thesis and catalyze a correction to retest the $0.331 support level.