
BTC/USD, ETH/USD Technical Outlook:
- BTC/USD, ETH/USD look completely broken as they enter the ‘erosion’ phase
- Losses from here could be quite significant, with occasional sporadic moves
Recommended by Paul Robinson
Get Your Free Bitcoin Forecast
Cryptos appear to have entered the ‘erosion’ phase of the deflation process that happens once a bubble bursts. This comes after the initial waves of heavy selling take it down significantly and residual selling takes over. The price action is telling this story as it becomes increasingly less volatile and reactive to other risk trends.
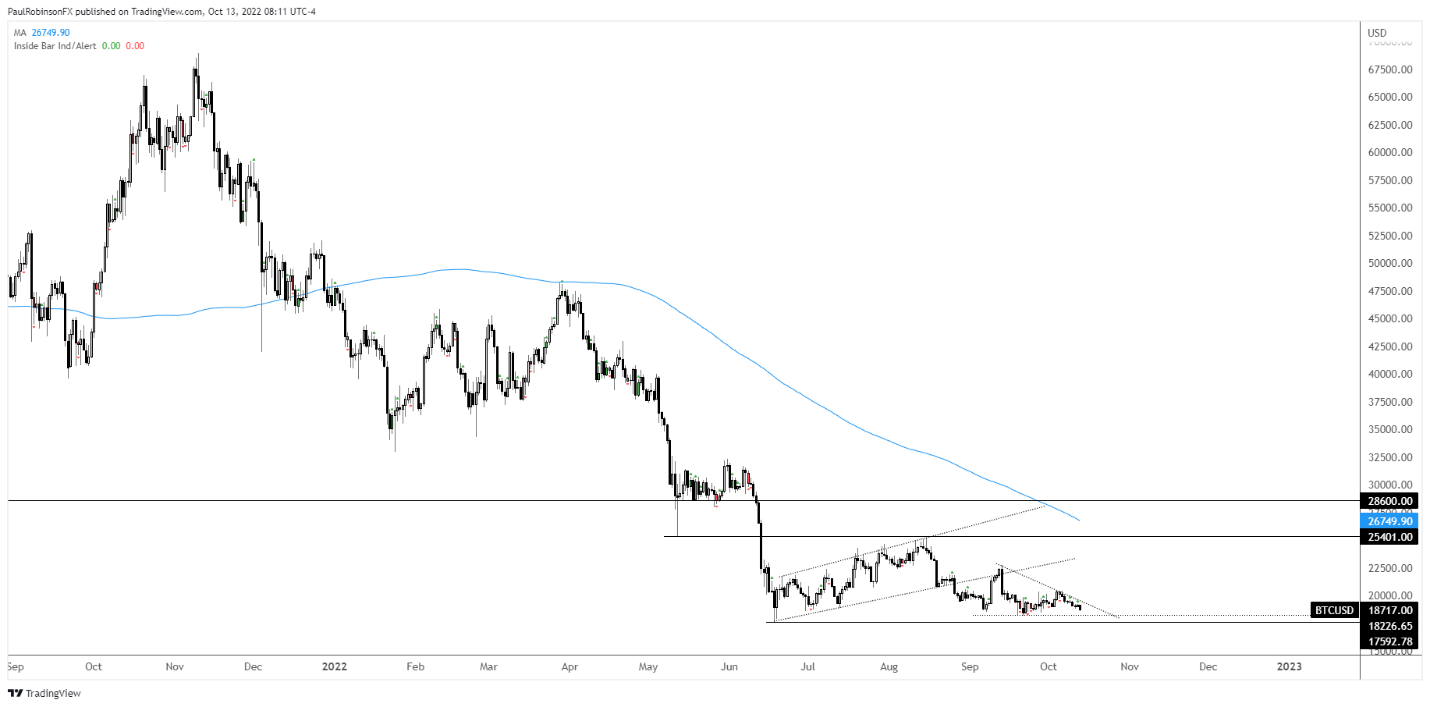
With that in mind, sharp rallies and even very sharp sell-offs will become increasingly less frequent. Although the risk of an occasional large sporadic move is there. On a break of 17592 it is anticipated that selling could pick up in BTC, but don’t be surprised if it doesn’t result in a major rout but rather a slower, more methodical decline as people continue to throw in the towel.
Where BTC could end up is of course to be seen, but given the extent of losses seen following other manias, it would be unsurprising to see 95% or more of value erased, which means we could see 3500 or lower. The next level of support to watch is 13880, the 2019 high, then after that perhaps 10k. Support otherwise becomes hard to find until we get to the 2020 low, which happens to be around 3500.
Getting there will take some time, though, this won’t happen in weeks and not likely in a few months’ time. If BTC is indeed following the typical bubble unwind pattern it could take two years or longer.
BTC/USD Daily Chart
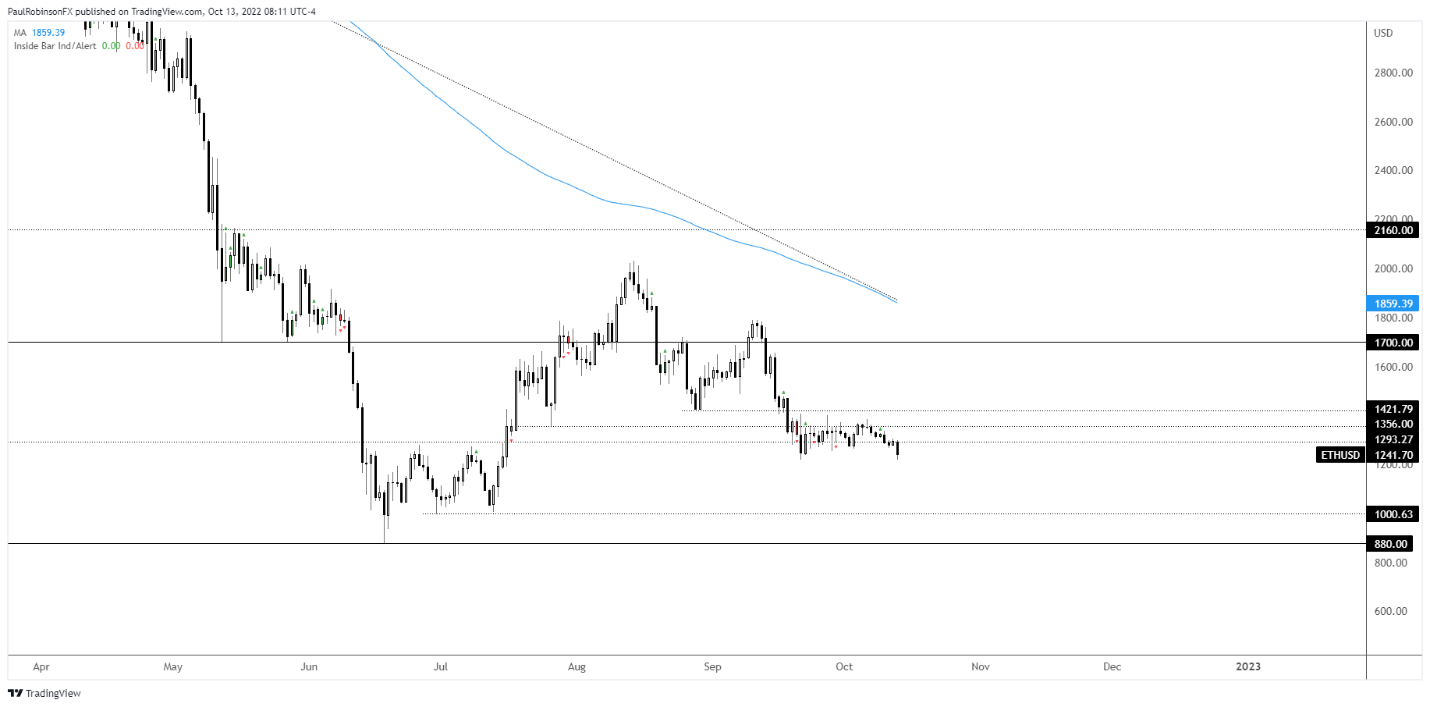
ETH/USD has fared somewhat better, and it’s no surprise as there seems to be a larger contingency of market participants who believe more in the long-term efficacy of ETH than in BTC. With that said, however, it is still seen to suffer a similar fate as BTC. But perhaps if this thing is for real the final tally on losses won’t be as drastic. Levels to watch on the downside are 1k, then the June low at 880. After that, finding levels gets difficult.
ETH/USD Daily Chart
Resources for Forex Traders
Whether you are a new or experienced trader, we have several resources available to help you; indicator for tracking trader sentiment, quarterly trading forecasts, analytical and educational webinars held daily, trading guides to help you improve trading performance, and one specifically for those who are new to forex.
—Written by Paul Robinson, Market Analyst
You can follow Paul on Twitter at @PaulRobinsonFX