
- Bitcoin settles below $19,000 on daily time frames, hinting at more decline in the future.
- Ethereum price loses support at $1,300, buying the low demands a clear invalidation point.
- XRP price has become the diverging outperformer within the crypto space, rallying 30% this week.
The cryptocurrency market has been at its lowest point since the spring. Time will tell if these prices are worth buying.
Bitcoin price offers a discount
Bitcoin price has failed to hold grounds above $19,000. On September 20, the bears have established a large bearish engulfing candle on the 2-day chart while dually have established a new low for September at $18,125
Bitcoin price currently auctions at $18,927. An influx of volume continues to enter the market with the declining price. Still, the Relative Strength Index is near a significant level that has acted as support during previous bull runs. Additionally, there is a divergence between the newly established low and the previous September low at $18,510.
A market bottom could be near, but buying the actual low will not be easy. A breach of the summertime lows at $17,622 is within arms reach. Using it as an invalidation point may be too risky. The macro invalidation point for a Bitcoin bull run remains at $13,880.
BTC USDT 2-Day Chart
In the following video, our analysts deep dive into the price action of Bitcoin, analyzing key levels of interest in the market. -FXStreet Team
BTC USDT 2-Day Chart
Ethereum Price has lost support at $1,300
Ethereum price printed a 2-day candle settled at $1,245, the lowest trading price for ETH since the middle of July. The Volume Profile Indicator still leans upwards as the bulls own the strongest influx days. However, the Relative Strength Index has breached a definitive line in the sand, suggesting a market behavior change could unfold amidst the next countertrend rally.–
Ethereum price currency trades at $1,262. Buying the lows at this point will be very challenging. The safest invalidation to use if trying to buy a dip is the June 12 low at $1,006. Ethereum price should be under no circumstance breach this level. In doing so, the entire uptrend scenario would be void. A decline towards the June 20 low at $881 would be the next stop, resulting in a 30% decline from the current Ethereum price.
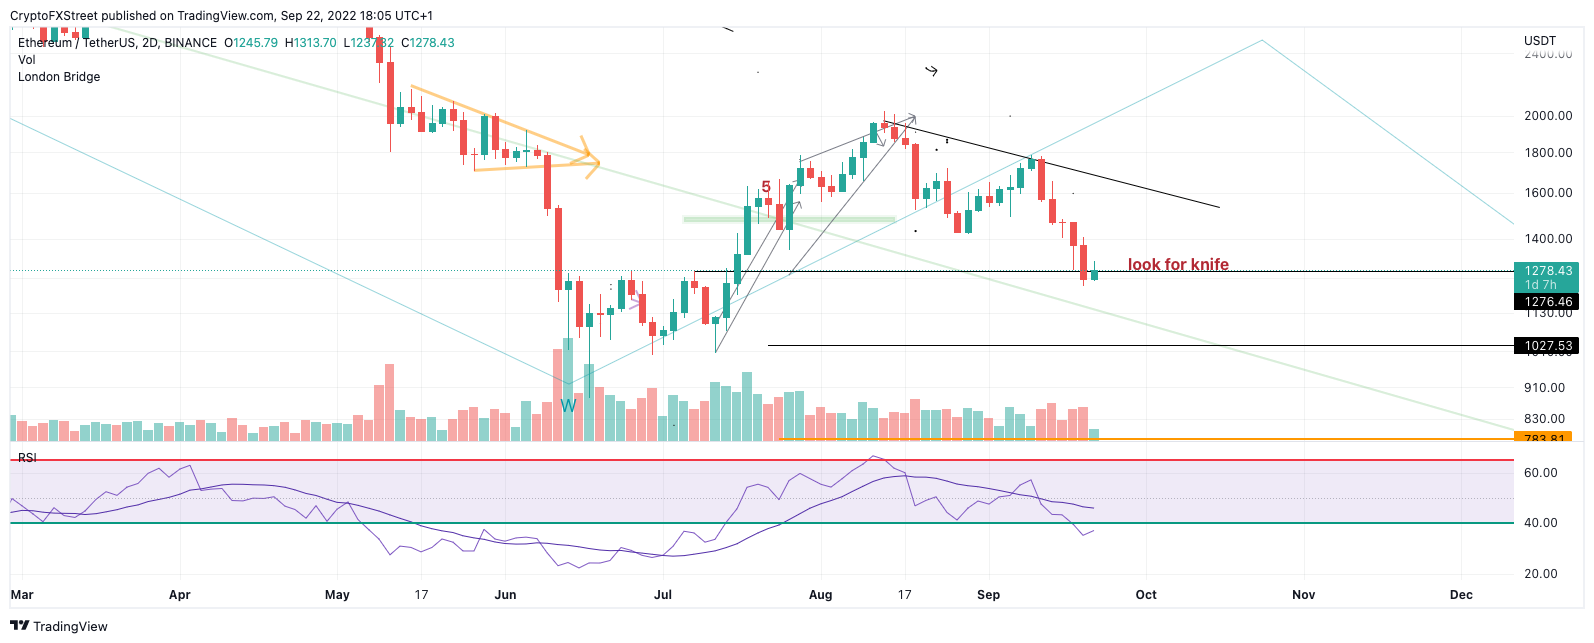
ETH USDT 2-Day Chart
In the following video, our analysts deep dive into the price action of Ethereum, analyzing key levels of interest in the market. -FXStreet Team
XRP price continues to diverge
XRP price has become the outperformer of the bunch and has rallied 30% since September 19. The buyers have produced applaudable price action as consecutive bullish engulfing candles have been displayed on the 4-hour chart.
XRP price currently auctions at $0.4373 as the digital remittance hovers above an ascending parallel channel. An influx of volume has entered the market, compounding the idea that more gains will come for the digital remittance token.
The next major resistance level appears at $0.4575 (based on Fibonacci projections of September’s rally and pullback). If the bulls find support at this level, a $0.50 XRP price will occur in the coming days. Such a move would result in a 16% increase from the current XRP price.
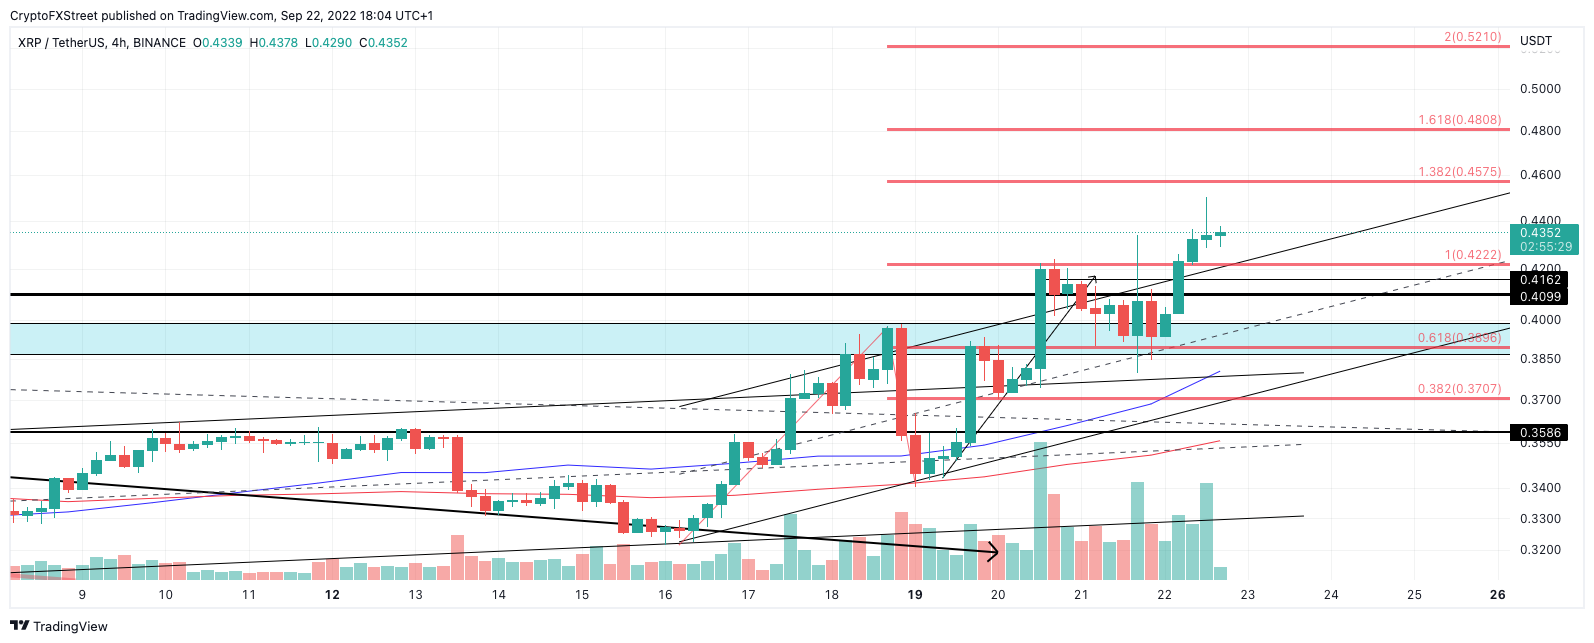
XRP USDT 4-Hour Chart
In the following video, our analysts deep dive into the price action of Ripple, analyzing key levels of interest in the market. -FXStreet Team