
- Bitcoin price seems to be taking continuous jabs at the $24,989 resistance level but to no avail.
- Ethereum price dips seem to be supporting buyers as the Merge continues to creep forward.
- Ripple price is still stuck, trying to flip the $0.381 hurdle so it can revisit the $0.439 resistance barrier.
Bitcoin price reveals a bullish outlook as markets start a fresh week. This development has caused many altcoins, including Ethereum and Ripple, to rally slightly. As BTC cools down, the capital is likely to rotate to other coins. However, a sudden reversal could undo the gains for the altcoins as well.
For now, Ethereum’s upcoming upgrade – the Merge – seems to be driving the altcoins higher, and BTC is playing catch-up. However, this move could exhaust quickly and undo the gains far quicker. Therefore, investors should start booking profits and prepare for an unfortunately timed reversal.
Bitcoin price does not stop trying
Bitcoin price seems to be in the last leg of a distribution phase that is likely to result in a steep correction. The confluence of this move with the 50% retracement level at $24,989 makes this scenario much more compelling.
Additionally, the four-hour chart shows the formation of a bearish divergence, where the price forms a higher high and the Relative Strength Indicator (RSI) forms a lower high. This development adds credence to the bearish outlook.
Due to the recent consolidation, investors should not hold their breath for a correction to $21,440 or $20,750. However, a move to $22,586 seems likely and on the cards for the big crypto this week.
BTC/USD 4-hour chart
While things are looking saucy for Bitcoin price and the struggle at $24,989, investors should note that a daily candlestick close above this level will signal a potential bullish move in play.
Confirmation of the bearish thesis’ invalidation will arrive after a decisive flip of the $24,989 hurdle into a support floor. In such a case, BTC could reach the $25,968 hurdle, where the 100-day Exponential Moving Average (EMA) is located.
Ethereum price remind a force to be reckoned with
Ethereum price has been on a non-stop rally since July 13 and shows no signs of slowing down. Any dips on the four-hour chart have resulted in more than recovery. The recent 5.5% drop is close to being undone as ETH rallies by 4.2%.
If this momentum continues, the chances of ETH reaching $2,158 are high. Therefore, investors should keep an eye out for a quick 8.5% in the near future for the smart-contract token.
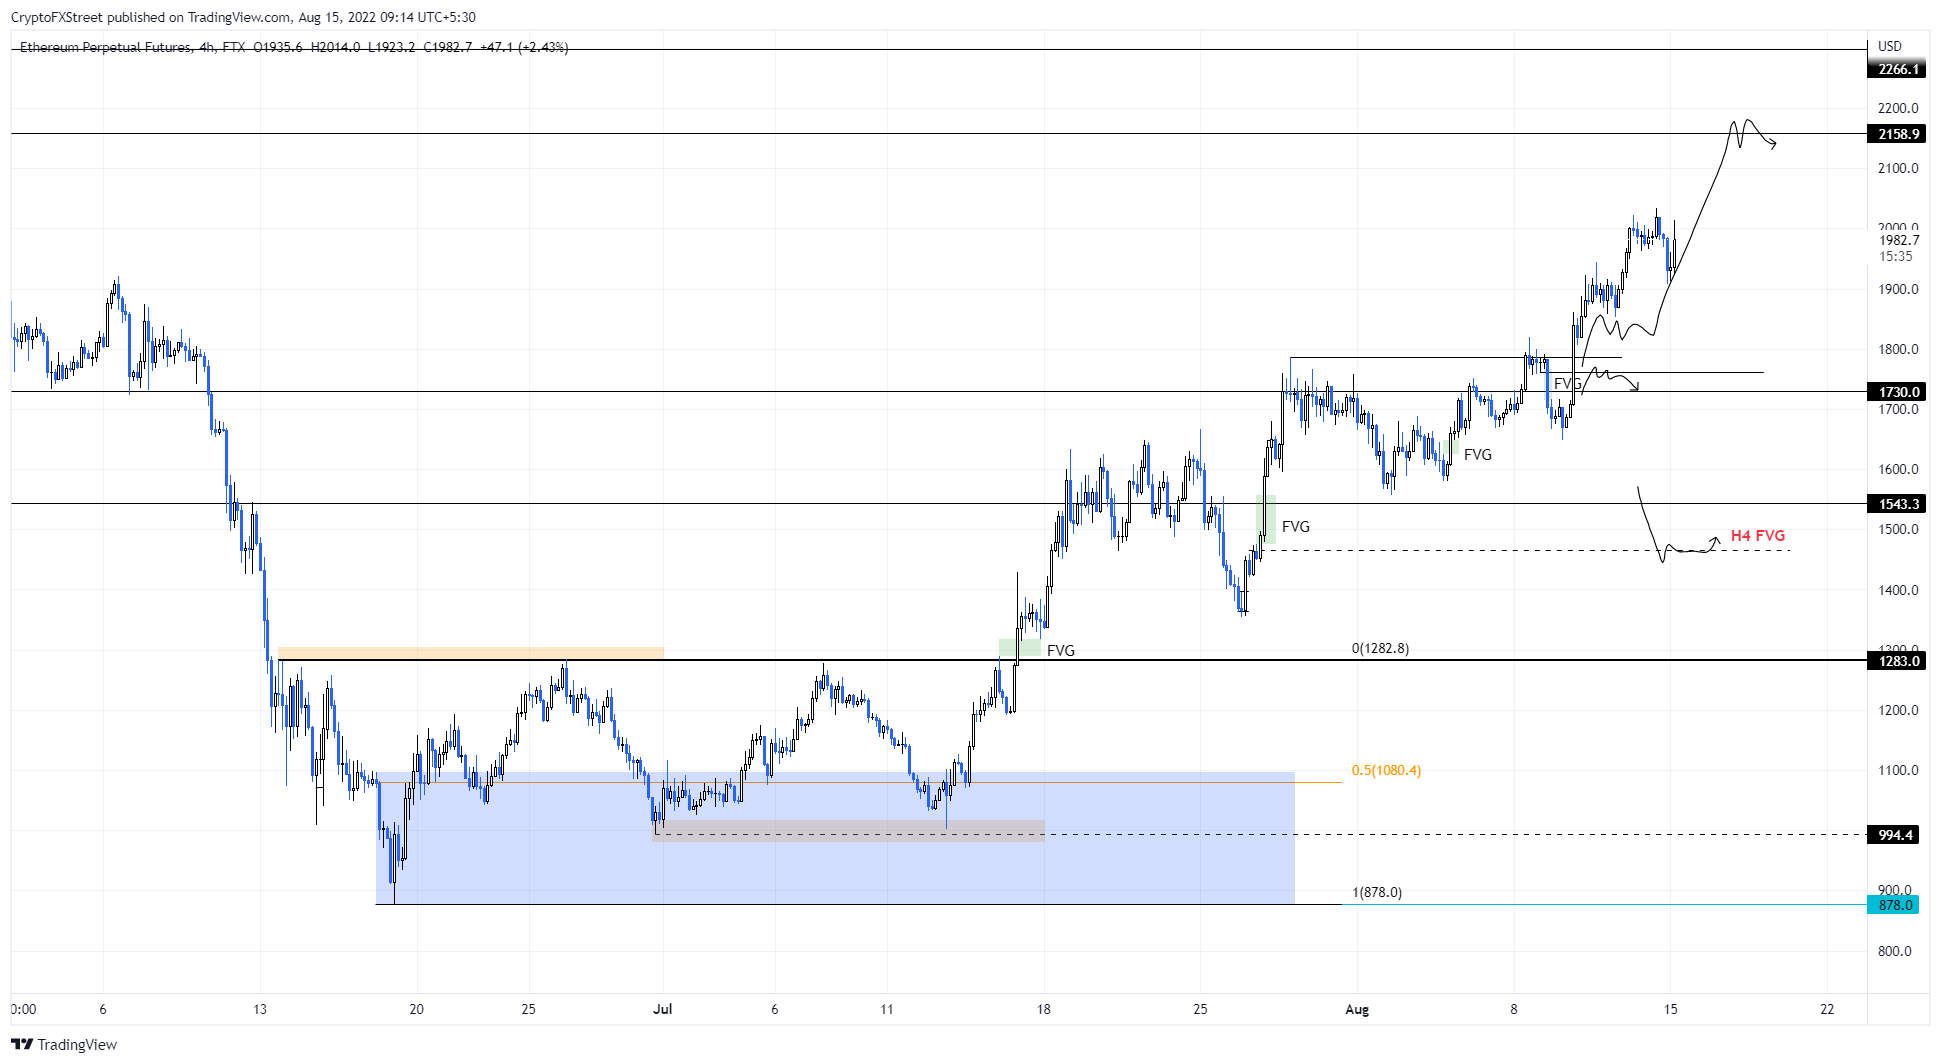
ETH/USD 4-hour chart
On the other hand, if Ethereum price produces a daily candlestick close below $1,730, it will invalidate the bullish thesis and potentially trigger a steep correction to $1,543.
Ripple price sings the same song
Ripple price has been attempting to breach the $0.381 hurdle for the eighth consecutive time and has yielded no discernable result that isn’t different from the rest. The sellers at this level are absorbing the incoming buying pressure, resulting in a consolidation that has been ongoing for two weeks.
The $0.340 support level and the double bottom formed at $0.326 are the two targets for a short-term retracement, should it ever arrive. However, the best place to be a buyer would be a retest of the $0.287-to-$0.311 demand zone.
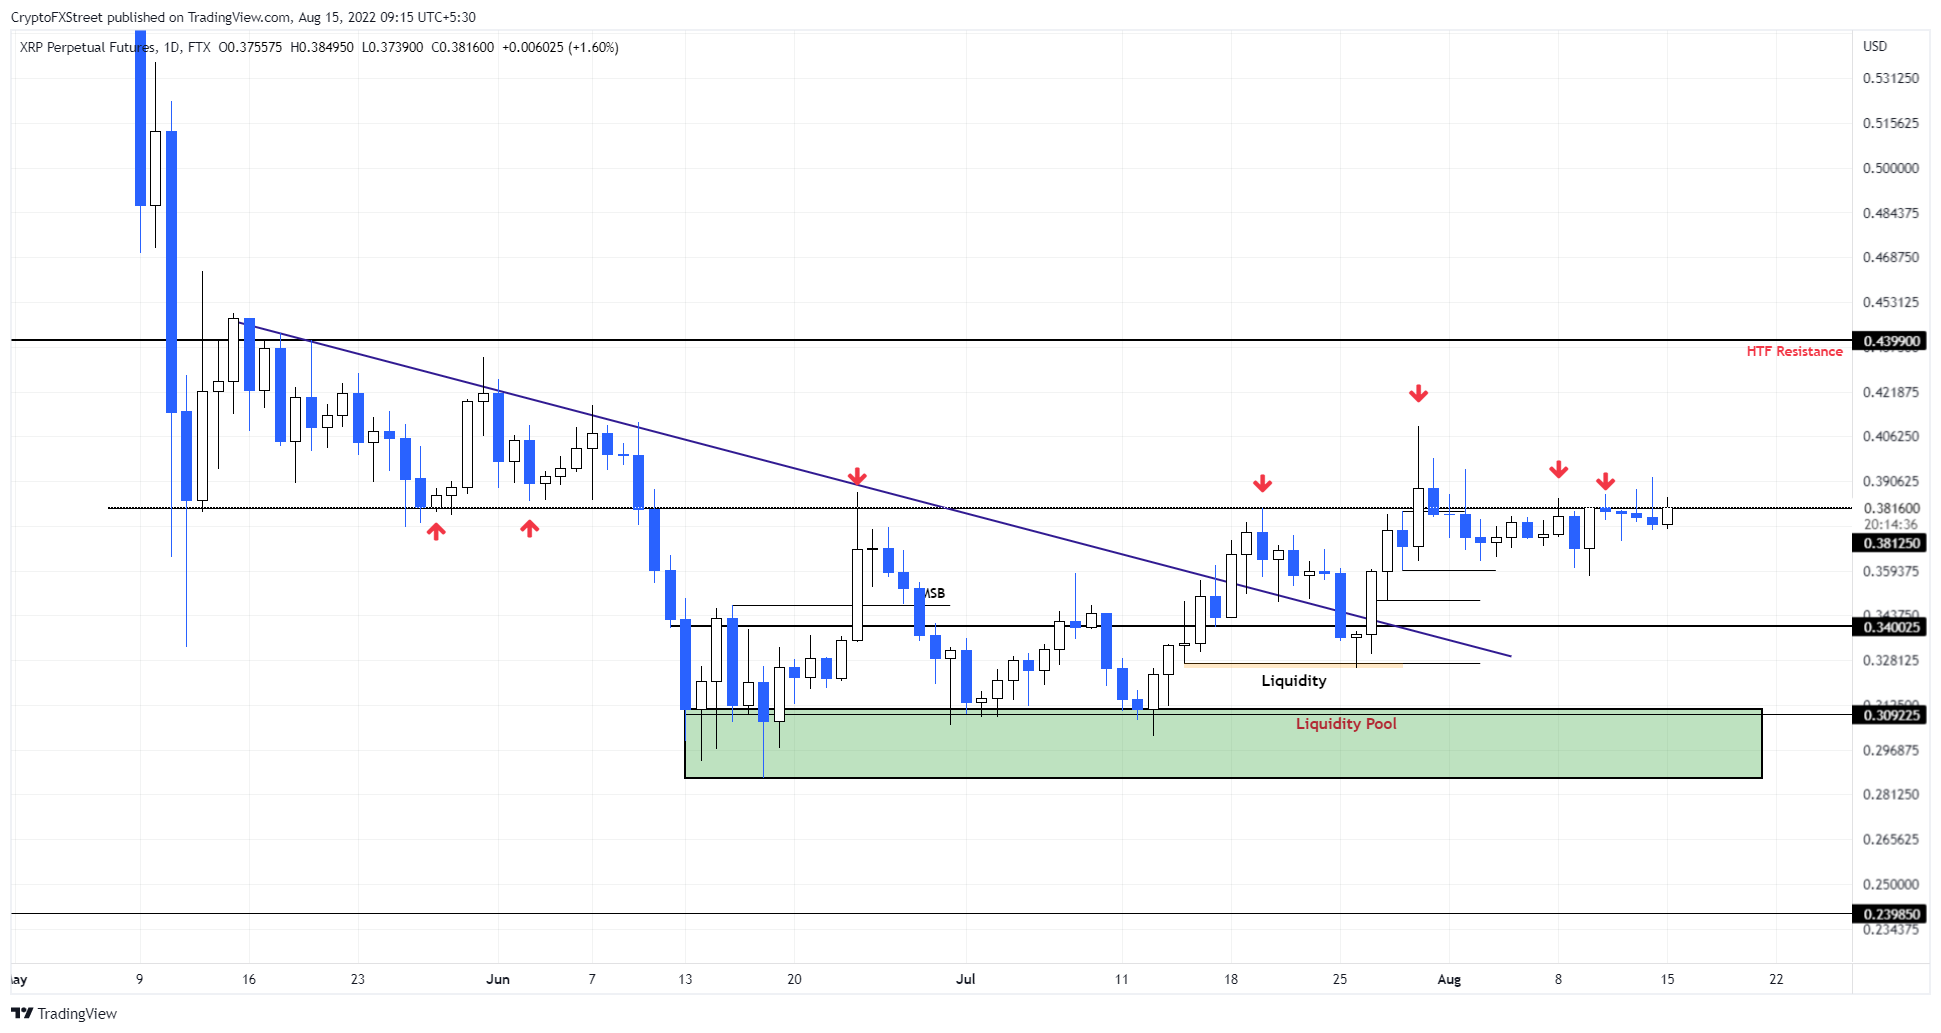
XRP/USD 1-day chart
Regardless of the multiple failed attempts at breaching the $0.381 hurdle, Ripple price remains neutral-to-bullish. A daily candlestick close below the $0.287 level will invalidate the demand zone and the potential bullish thesis for XRP price.
In such a case, investors can expect Ripple price to retest the $0.239 support level.