
All of the top 10 coins are located in the green zone, according to CoinMarketCap.
ETH/USD
The rate of Ethereum (ETH) has risen by 3.56% over the last 24 hours.
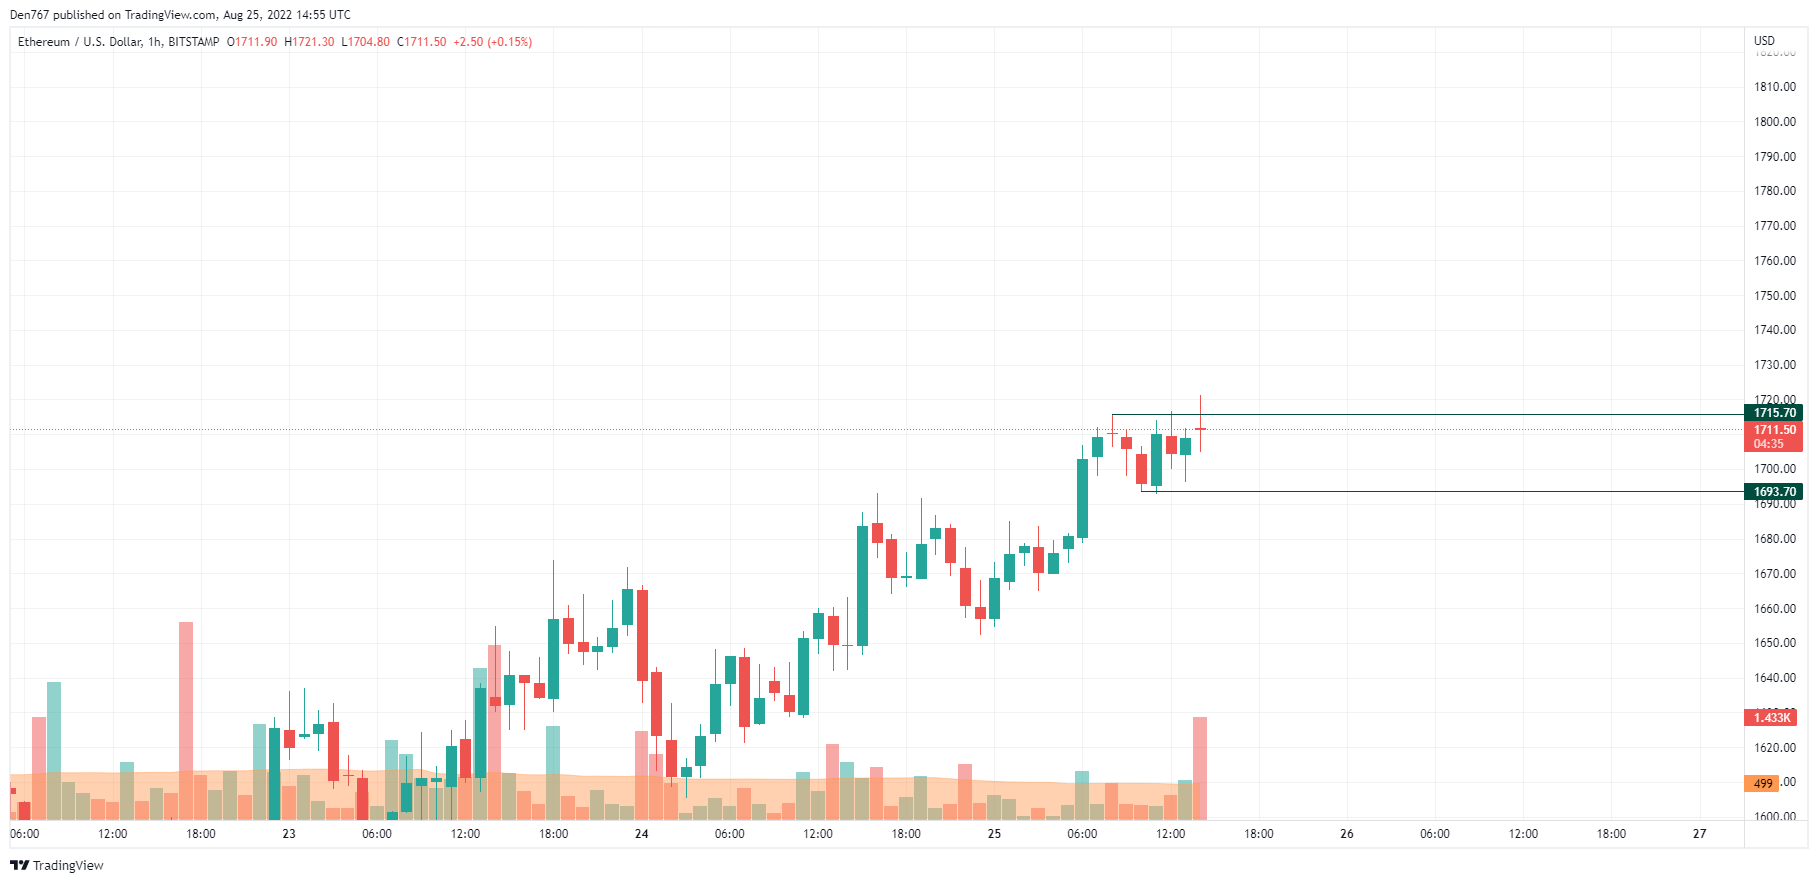
On the hourly chart, Ethereum (ETH) has made a false breakout of the local level at $1,715. In this case, the more likely scenario is a drop to the nearest support around $1,693.
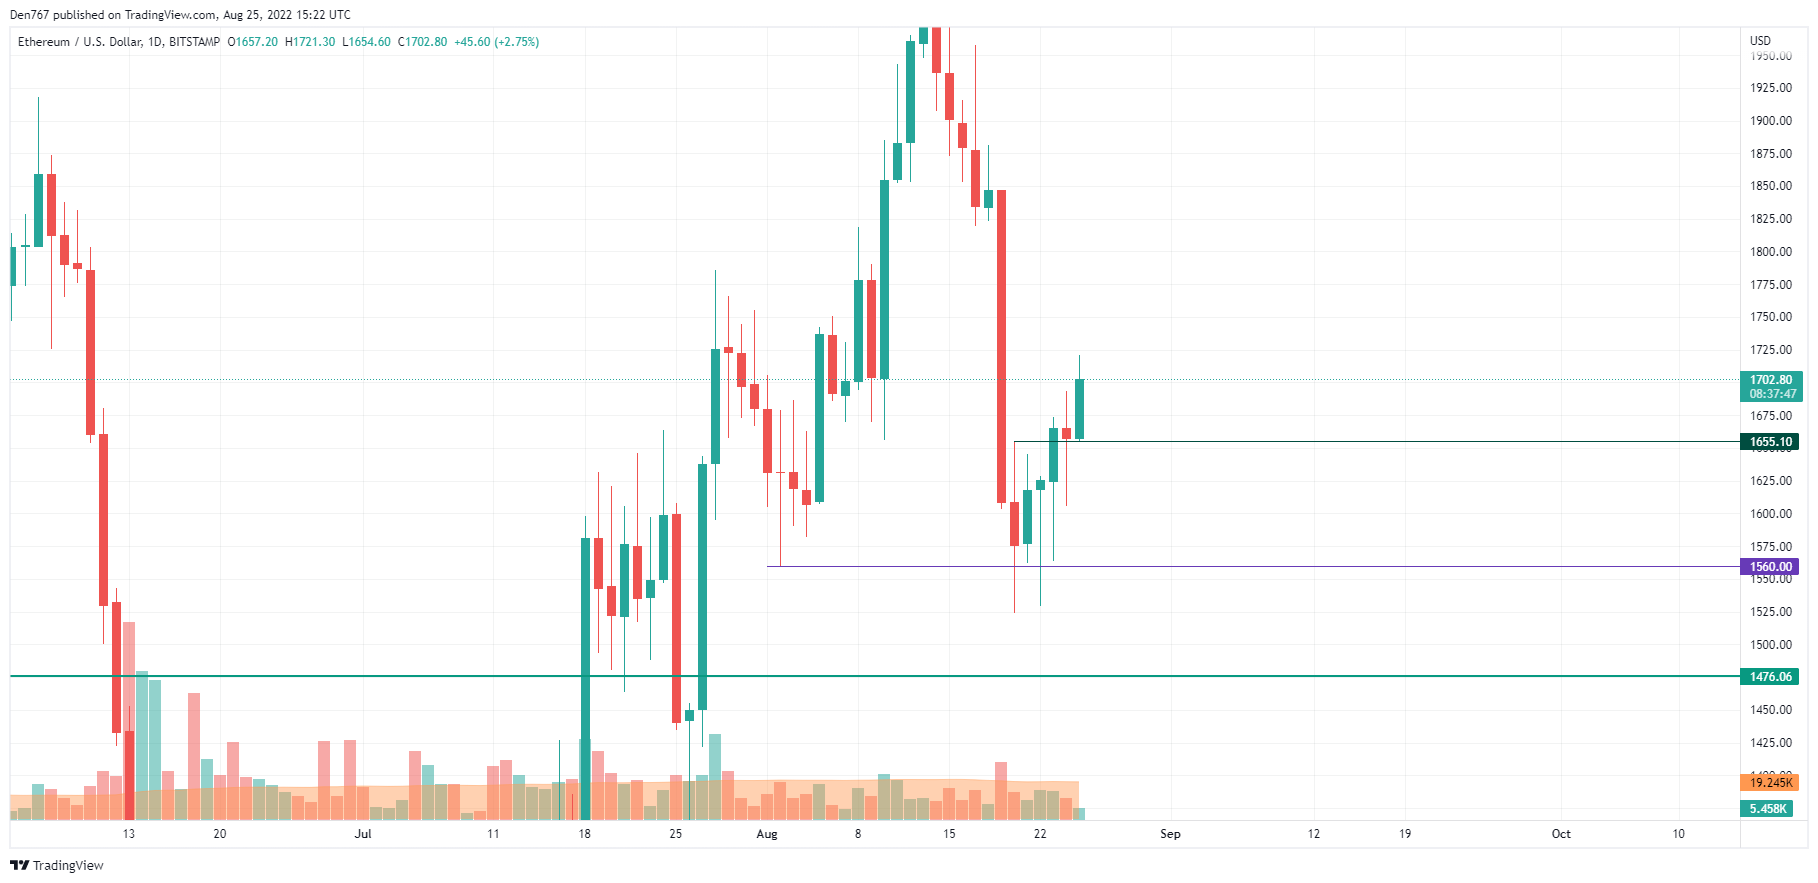
On the daily chart, Ethereum (ETH) remains bullish until the price is above the support level at $1,655. Currently, one should not expect any sharp moves as the leading altcoin has not accumulated enough power for either growth or fall.
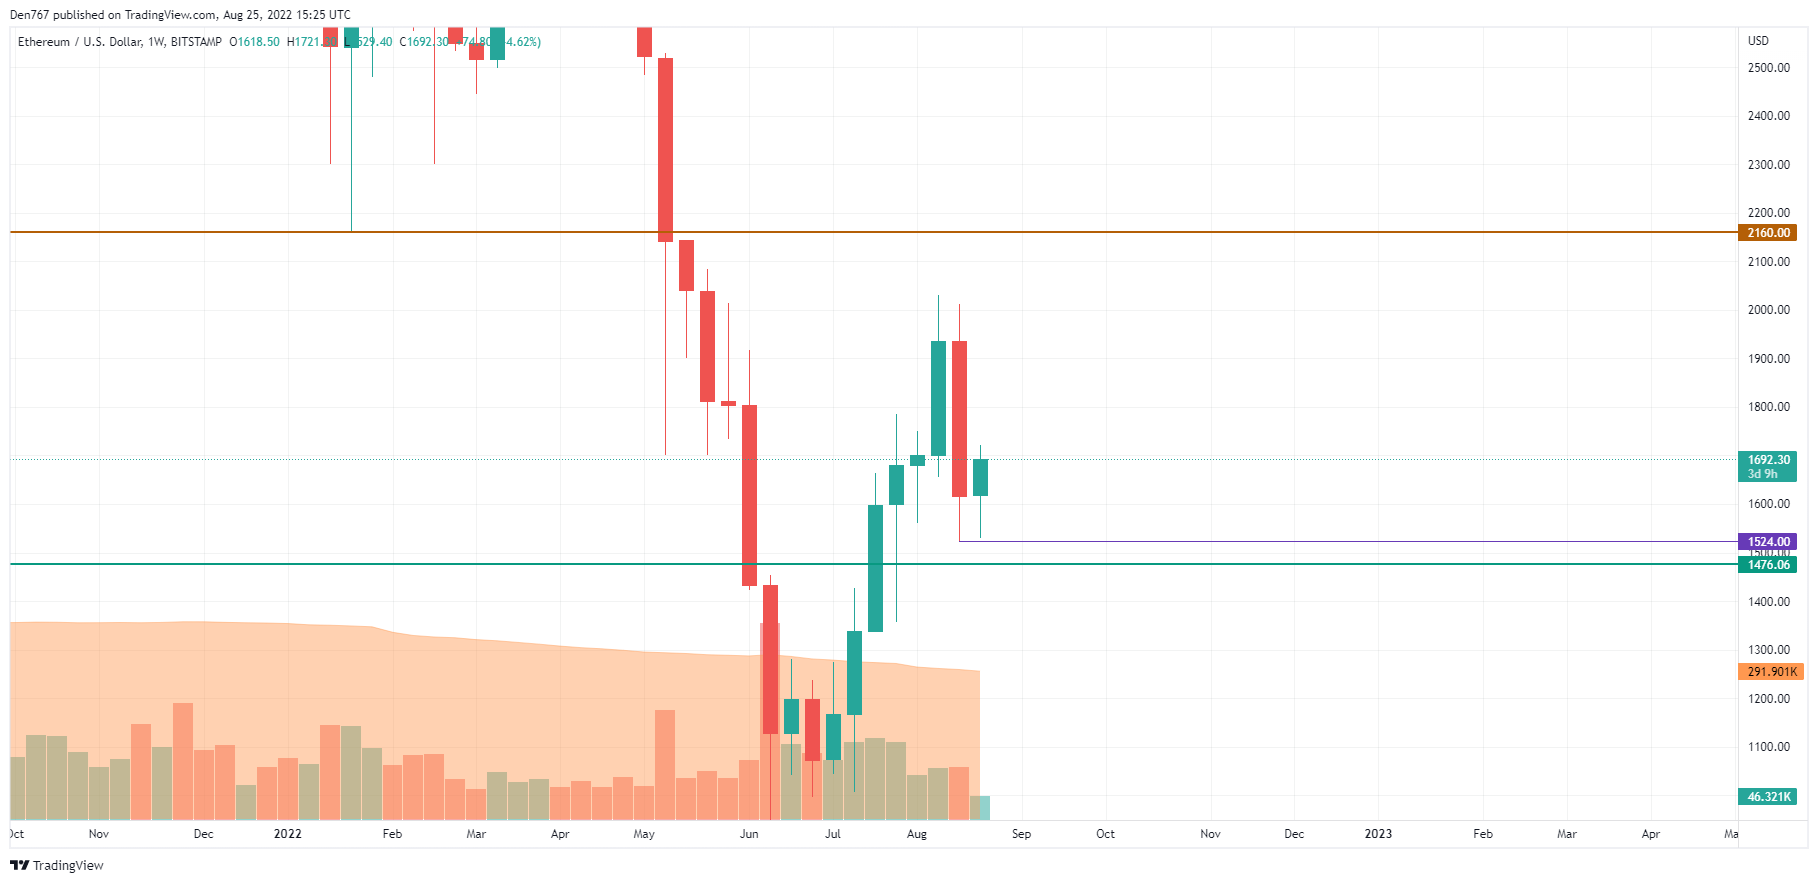
On the weekly time frame, $1,700 plays an important role for bulls. However, if the candle closes below it, there are chances to see a drop to the $1,550-$1,600 area within the next few weeks.
Ethereum is trading at $1,696 at press time.