
The cryptocurrency market is neither bullish nor bearish, according to CoinMarketCap.
ETH/USD
The rate of Ethereum (ETH) has gone down by 18.23% over the last week.
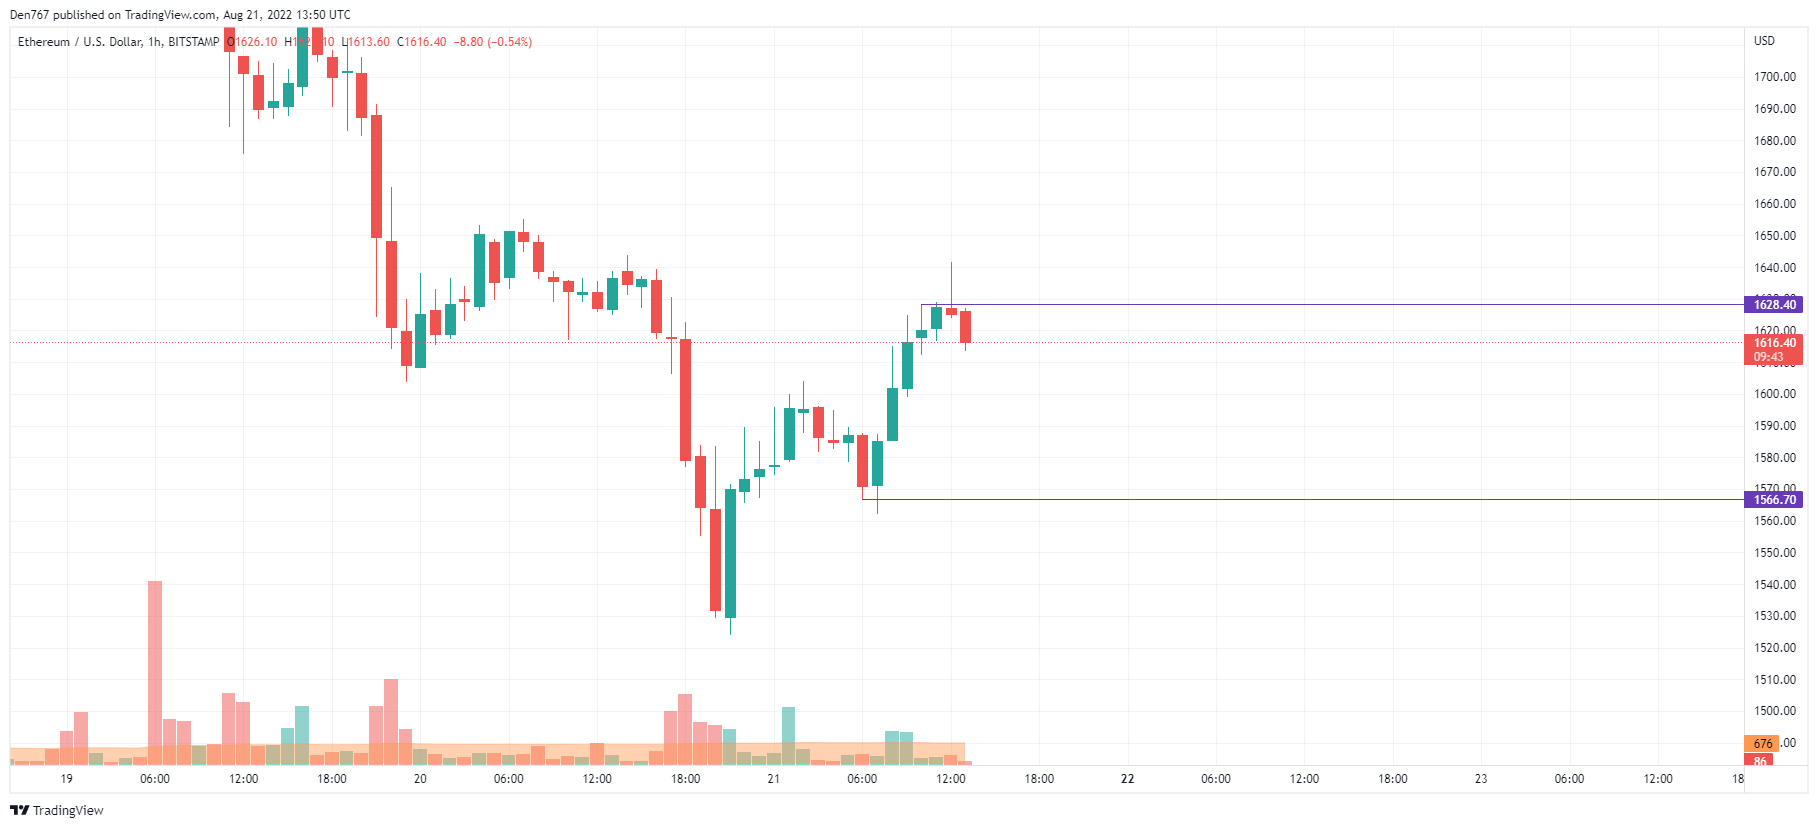
On the local time frame, Ethereum (ETH) has bounced off the $1,628 level. If buyers can’t seize the initiative, there is a high chance to see a test of the $1,600 mark by the end of the day.
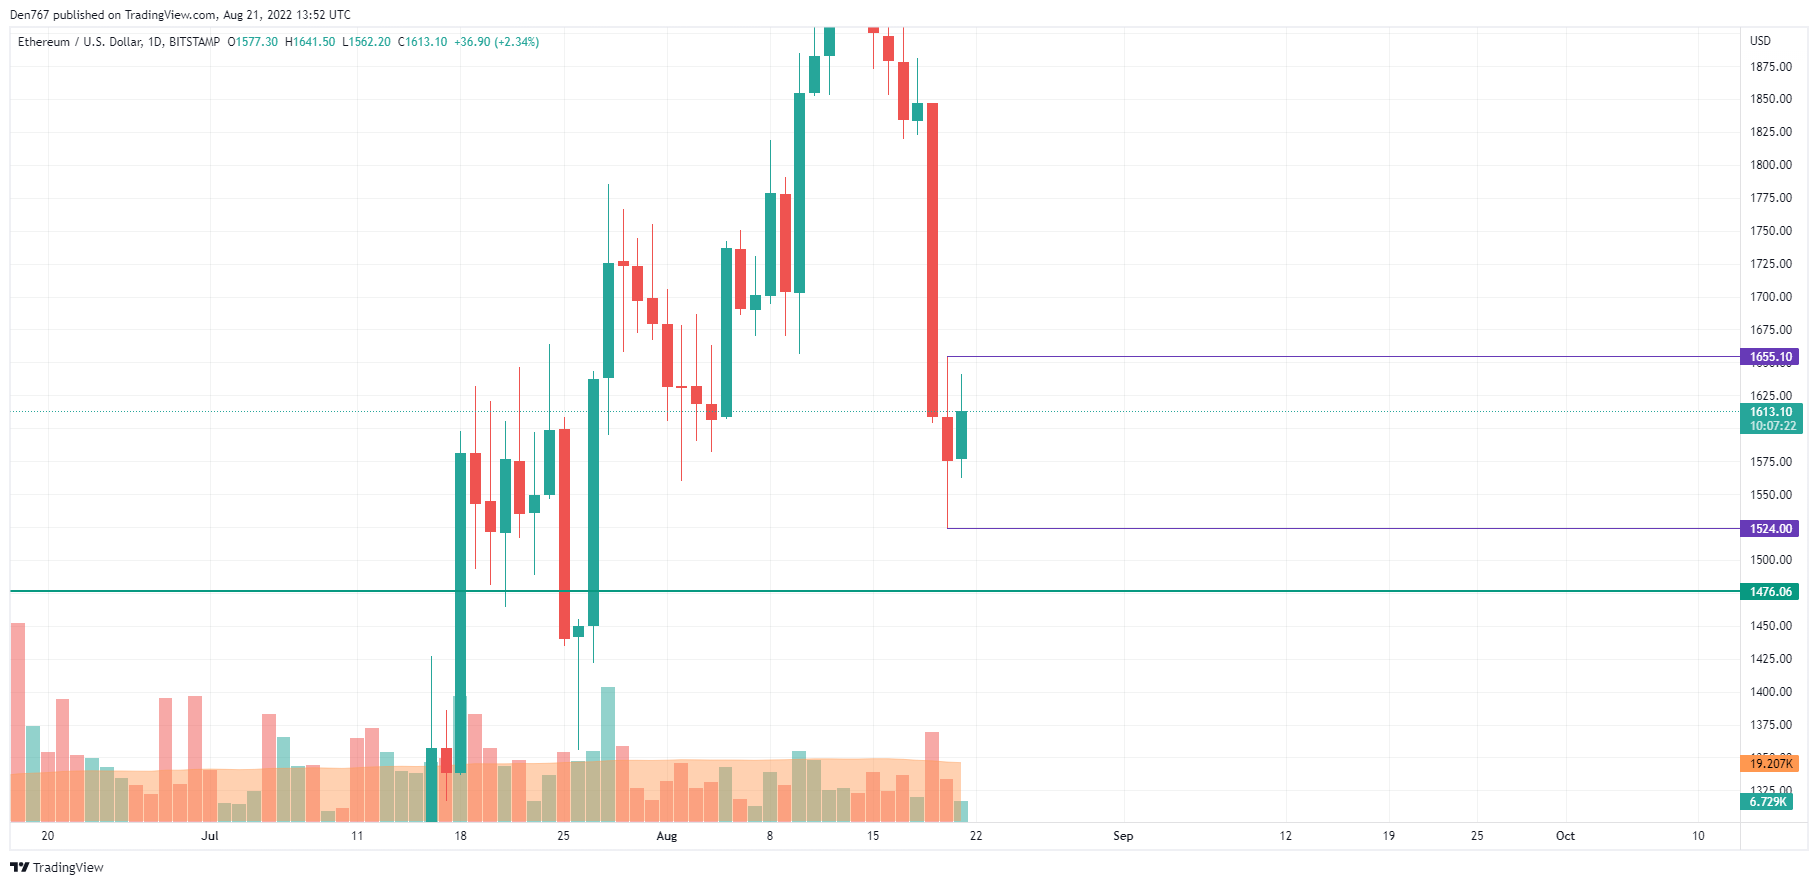
On the daily chart, Ethereum (ETH) is located in the middle of the narrow range between the support at $1,524 and the resistance at $1,655. Currently, neither side has accumulated enough power for a sharp move. Respectively, sideways trading around the mentioned levels is the more likely scenario for the upcoming week.
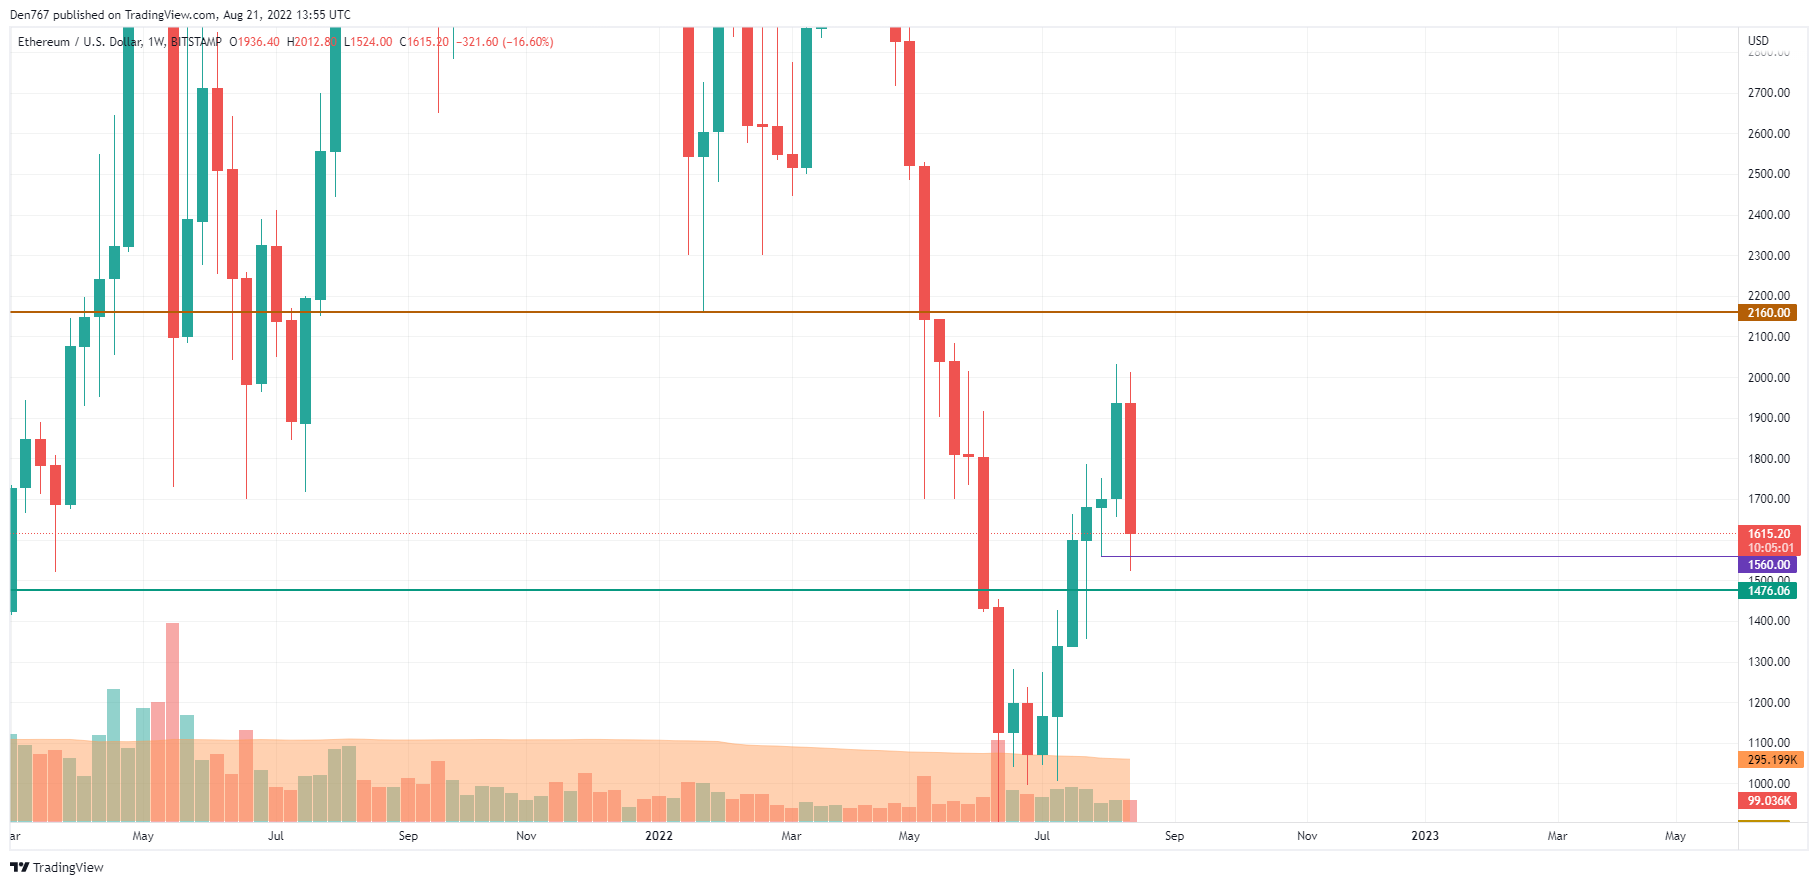
From the mid-term point of view, Ethereum (ETH) has made a false breakout of the support level at $1,560. Until the price is above it, bulls have a chance for an upward move. In addition, the selling volume is low, which means that bears are running out of strength.
Ethereum is trading at $1,608 at press time.