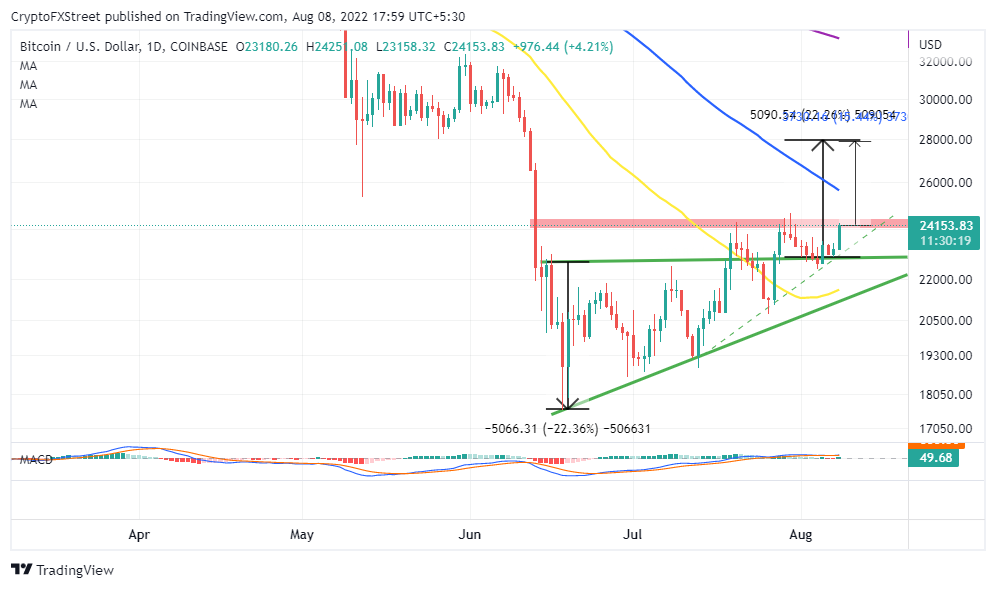
- Bitcoin price reaffirms a triangle breakout to $28,000 after surpassing $24,000.
- Whales holding 1,000 and more coins grow to 2,051 from 2,040 in a week.
- Bitcoin price is required to make a daily close above $24,000 to reinforce the move to $28,000.
Bitcoin price kicked off the new week on a positive note, climbing 4.50% to trade at $24,086 at the time of writing. The larger cryptocurrency market appears to have flipped green, led by Avalanche’s 11.30% gains, Polkadot’s 9.20%, Solana’s 7.30% and Ethereum’s 6.50%. As for Bitcoin price, fundamentals are growing stronger by the day, thus becoming the main bear market rally drivers.
Bitcoin Whales Return With A Bang
There are 2,051 addresses holding 1,000 and above BTC. This number has increased by 0.54% from 2,040 addresses on August 2. A whale is any Bitcoin address containing not less than 1,000 BTC. The actual owners of these wallets remain largely unknown due to the pseudonymous nature of the blockchain network.
Bitcoin Supply Distribution
Bitcoin price tends to increase in value when whales buy in droves; the opposite also holds water. As observed in the chart above, Bitcoin price has been unable to sustain any bullish reversal attempts from the beginning of the year because whales increasingly sold, adding to the selling pressure.
Bitcoin price settled above $24,000 as part of the plan to close the gap to $28,000 if large volume investors keep their buying activities intact.
A closer glance at the technical outlook for Bitcoin price shows the possibility of a bullish daily candle forming, which will go a long way to affirm the buyers’ newly reclaimed control. After testing the ascending triangle’s hypotenuse, Bitcoin price retriggered the potential for a 22.36% breakout to $28,000.
Including the step above $24,000, the flagship cryptocurrency is already quite close to hitting the upside target. Bitcoin price will only need to move another 15% to brush shoulders with $28,000.
BTC/USD Daily Chart
Similarly, the Moving Average Convergence Divergence (MACD) position on the daily chart further tips the scale in the bulls’ favor. As long as the MACD keeps moving higher above the mean line, the path with the least resistance will be to the upside. Traders should keenly follow the overlap of the 12-day Exponential Moving Average (EMA) and the 26-day EMA to quickly and accurately time price reversal.

