
As El Salvador becomes the first country to adopt bitcoin as legal tender, shares of Coinbase Global (COIN) are dropping in early trading Tuesday.
Let’s take a look at COIN’s technicals.
The charts of COIN are showing some improvement, showing us a base pattern which, while not particularly big, can give us some positive results.
In the daily bar chart of COIN, below, we can see a four-month saucer base pattern. The shares found buyers in the $225-$220 area. COIN is now trading above the 20-day and the 50-day moving averages. These are shorter averages but are more sensitive to picking up a new trend.
The On-Balance-Volume (OBV) line shows a developing uptrend from early August telling us that buyers of COIN are becoming more aggressive. The Moving Average Convergence Divergence (MACD) oscillator is above the zero line in a bullish alignment.
In this weekly Japanese candlestick chart of COIN, below, we can see a number of doji patterns and small spinning tops to help mark the bottom area in June and July.
In this daily Point and Figure chart of COIN, below, we can see a potential upside price target of $339.
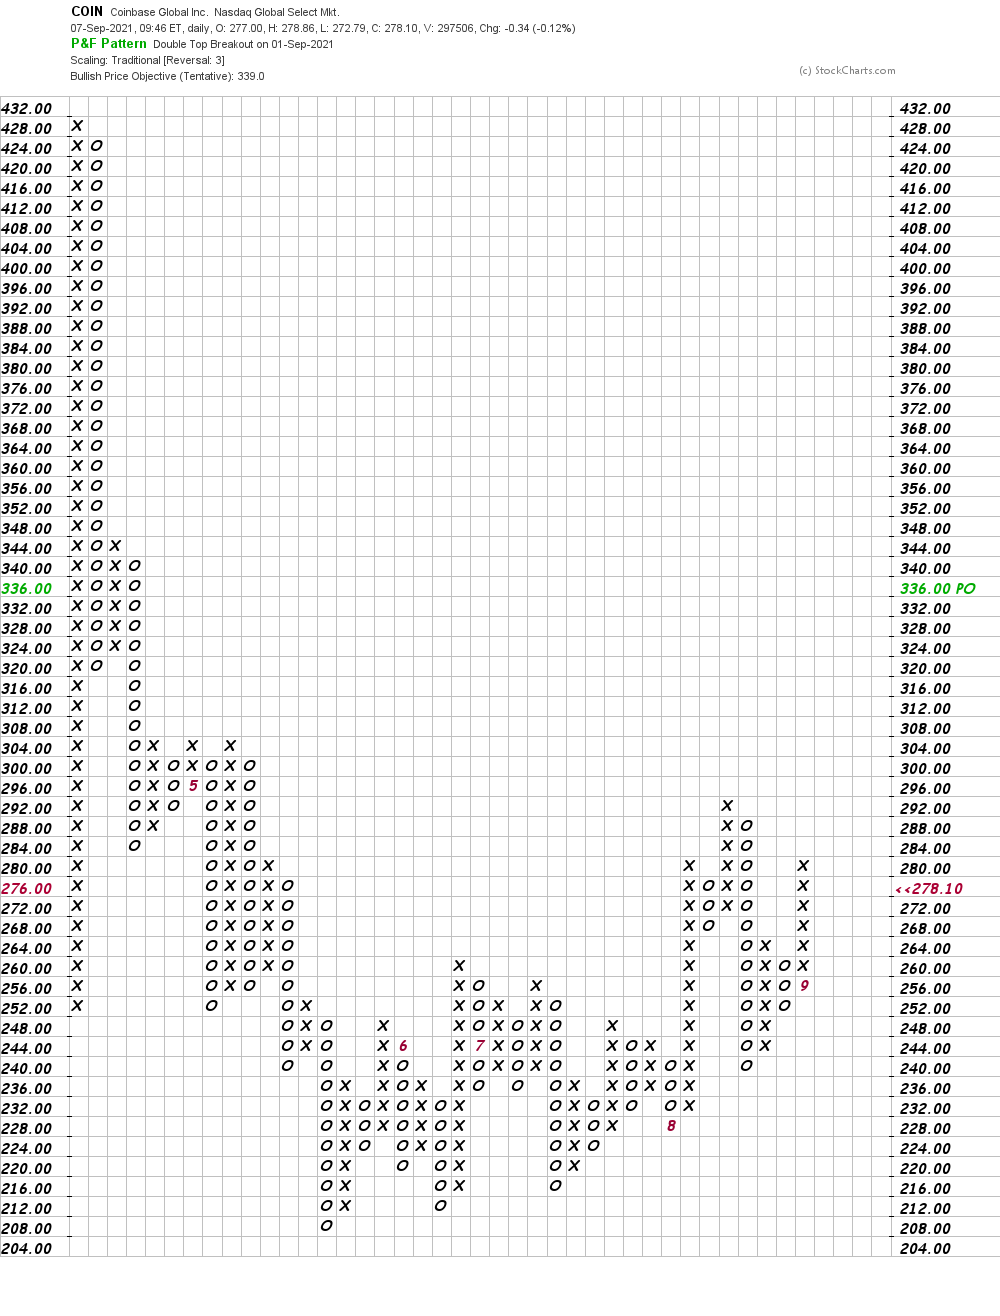
Bottom-line strategy: Aggressive traders could go long COIN at $275 or better, risking to $249. The $339 area is our initial price objective.
Get an email alert each time I write an article for Real Money. Click the “+Follow” next to my byline to this article.