
Monero (XMR)
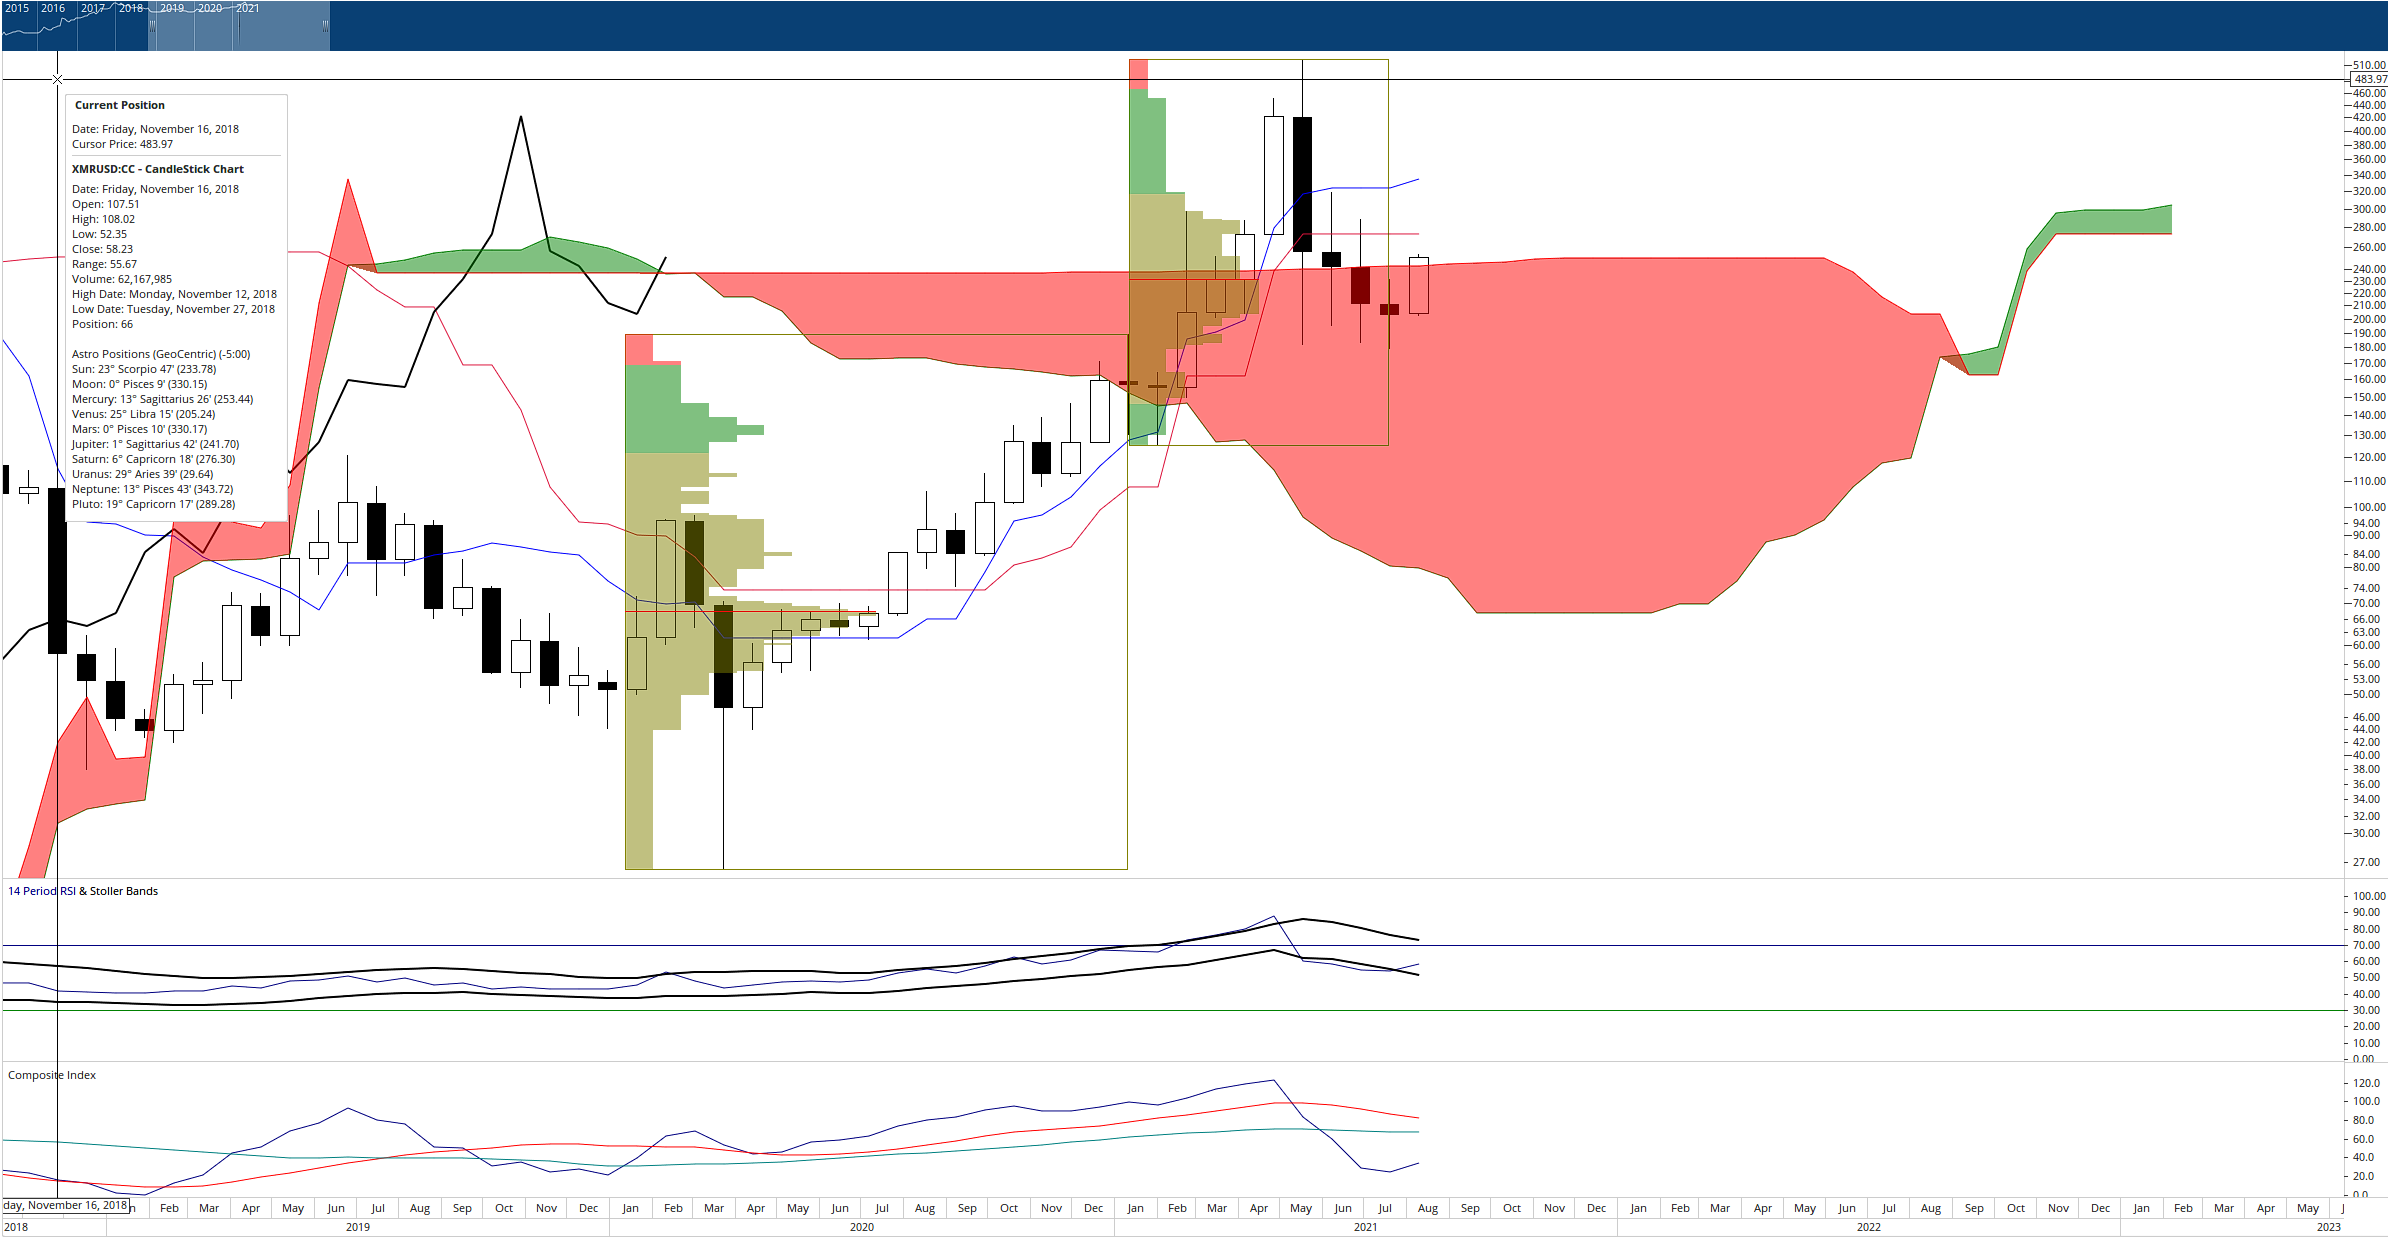
Above: Monero (XMRUSD)
The leader in the privacy coin space, Monero bulls have been frustrated since the end of July to get a daily close above the important $250 level. Thursday’s trading has seen Monero traded as high as $266.54 but with 30 minutes (at the time of writing) before close of the daily candlestick , Monero has returned to $251.22. The $250 level is the final major resistance zone before Monero could skyrocket higher. The chart above is Monero’s 3-week chart. It is just above the Cloud and below the Kijun-Sen (which is at $273.45). But the importance of a close above this 3-week cloud and above $250 isn’t because of the candlestick – it’s because of the Lagging Span. The 3-week Lagging Span has crossed above a Kumo Twist (a Kumo Twist is when Senkou Span A crosses Senkou Span B, or you can think of it as when the Cloud changes color). It’s been my experience that when the Lagging Span crosses a Kumo Twist and then closes in the direction of that crossover/crossunder, it most often creates major, major trending moves. The next major resistance for Monero, if it can sustain a move above $250, will be at the 3-week Kijun-Sen and high volume node near $277.
Stellar (XLM)
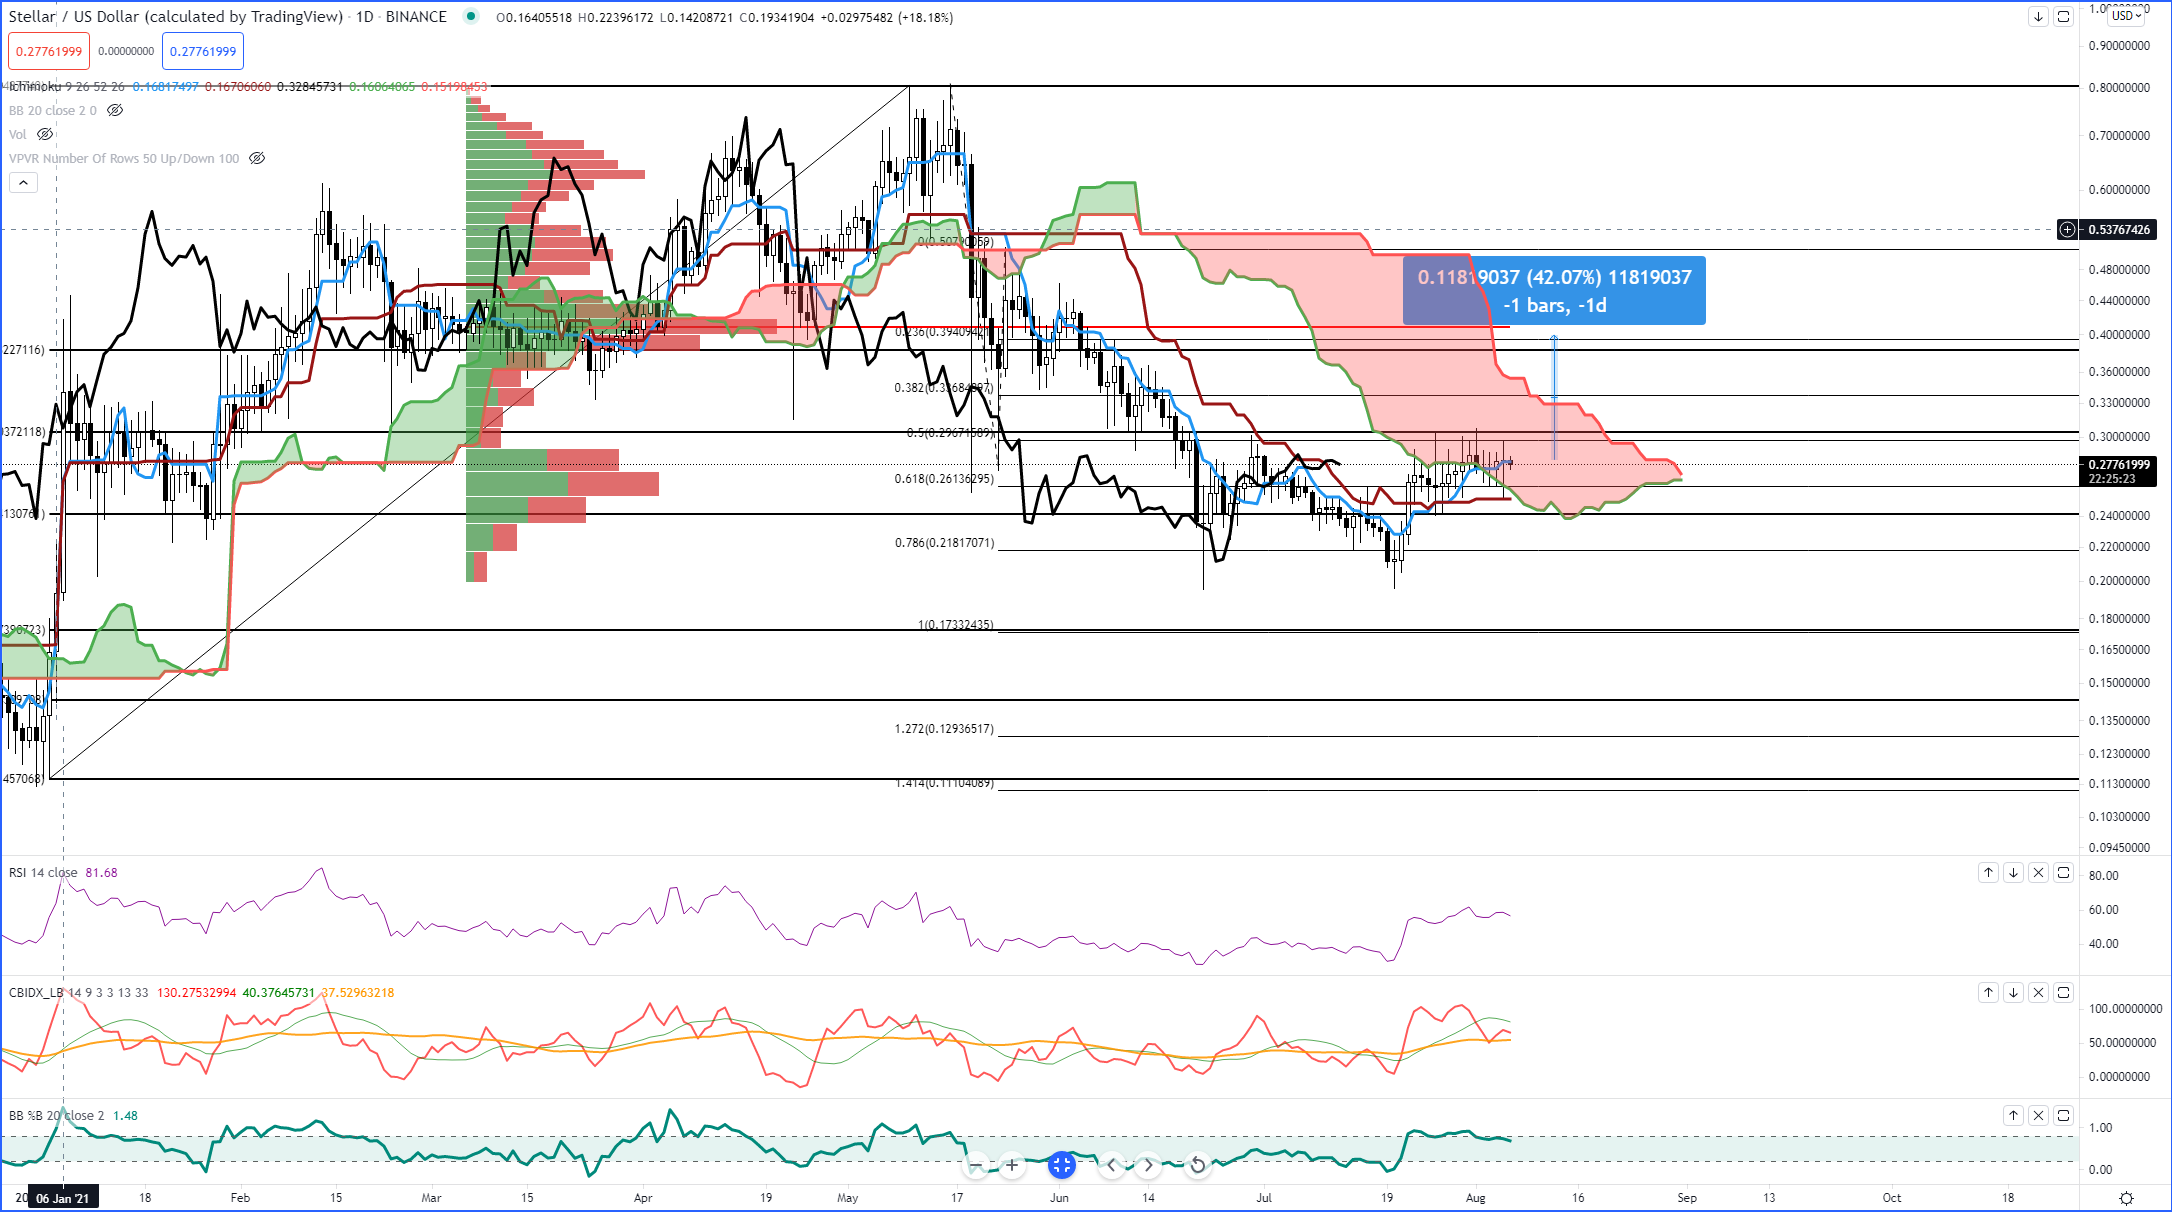
Above: Stellar (XLMUSD)
Stellar (XLM) remains in the devil playground (also known as the Cloud). Just look at the wicks on the daily candlesticks and you can just feel the frustration, volatility and indecision that exists. Like Monero, Stellar needs to cross above a strong psychological number that contains strong technical resistance levels. The $0.305 value area contains the 50% Fibonacci Retracement and the 50% Fibonacci Extension. Adding to the resistance is the a high volume node – consequently, it is the second highest high volume node for 2021 and if Stellar were to trade near the $0.30 level for a few more days, it might convert into the VPOC. If Stellar were to close at $0.31 and maintain that level, it could easily create a greater than 40% move higher to target the 38.2 Fibonacci Retracement and 2021 VPOC at $0.382 (notice how the price level and the Fibonacci levels are the same digits?).
Polygon (MATIC)

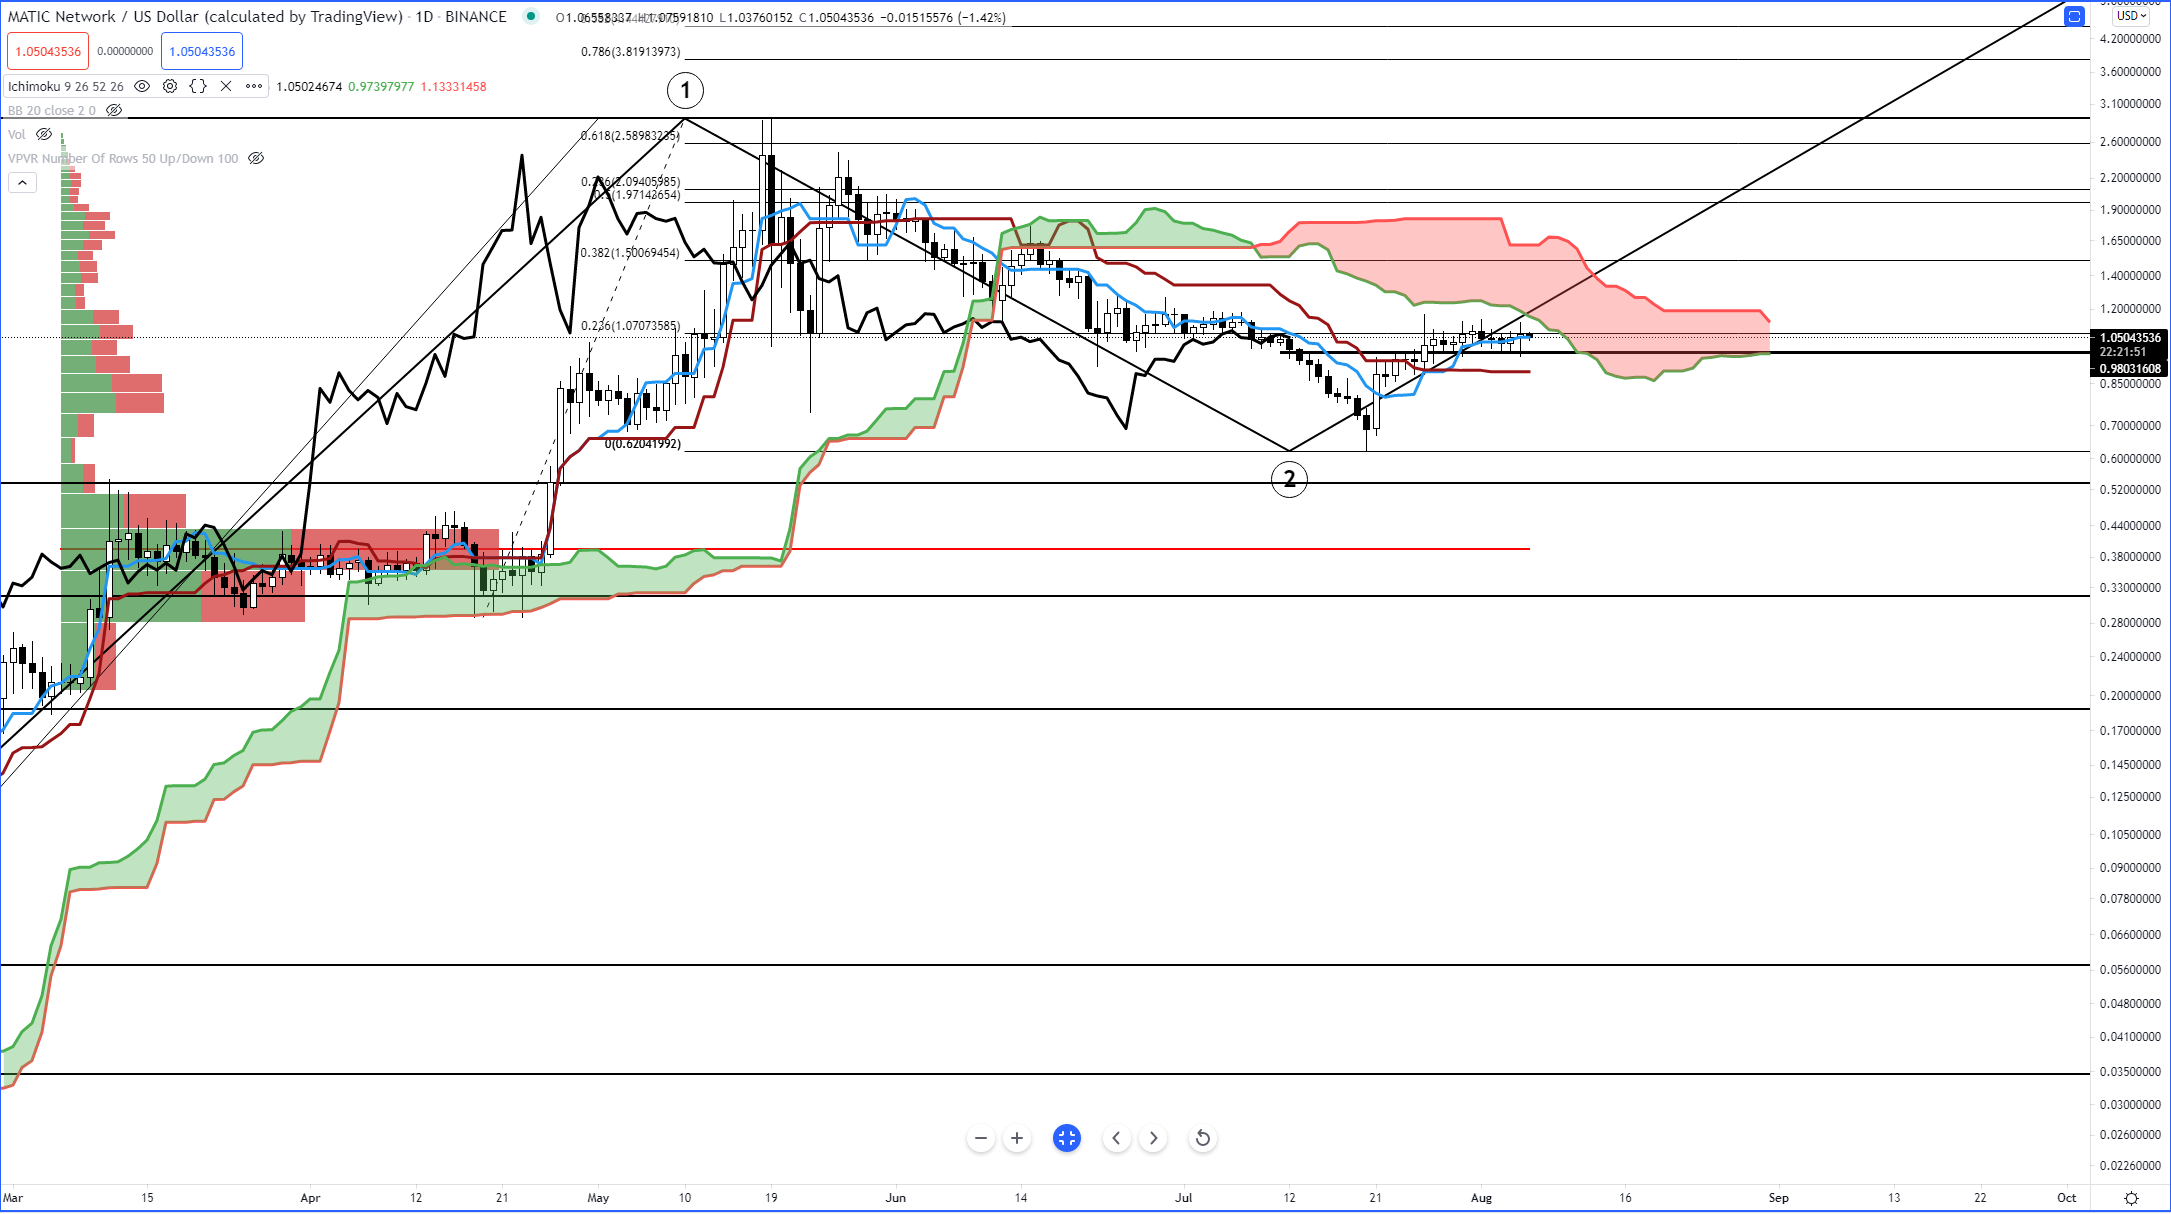
Above: Polygon (MATICUSD)
Polygon’s consolidation here is impressive. Over the past nine days, the lowest close and highest open is in a range of $0.06. These last nine days also represent the second longest and second most constricted trading range since the last two weeks of March 2021. Near term resistance for MATIC is the bottom of the Cloud at $1.15.However, if MATIC were to drive up to $1.20, hold, and then push a little higher, it could very easily move from $1.20 to $1.45 – $1.50 as the volume profile thins out considerably. The psychological value of $2.00 is near the a collection of Fibonacci Extensions and I expect it to face some selling pressure there on its first test of that level.
Advertisement
Save money on your currency transfers with TorFX, voted International Money Transfer Provider of the Year 2016 – 2020. Their goal is to connect clients with ultra competitive exchange rates and a uniquely dedicated service whether they choose to trade online or over the telephone.
Find out more here.