
Ethereum (ETH/USD) Talking Points:
- Ethereum ran as much as 91% from the low set just three weeks ago.
- The bullish trend in ETH/USD is pulling back and the question now is where support may set-in. Below I look at three potential zones of interest.
- The analysis contained in article relies on price action and chart formations. To learn more about price action or chart patterns, check out our DailyFX Education section.
The bid has remained strong behind Ethereum as the cryptocurrency’s bullish trend has continued. At this point, ETH/USD is 79% above the July 20th low; but that number was as high as 91% when Ethereum tested a breakout beyond the 3190 level yesterday. That breakout could not hold and prices have pulled back, so the objective at this point becomes seeking out support potential.
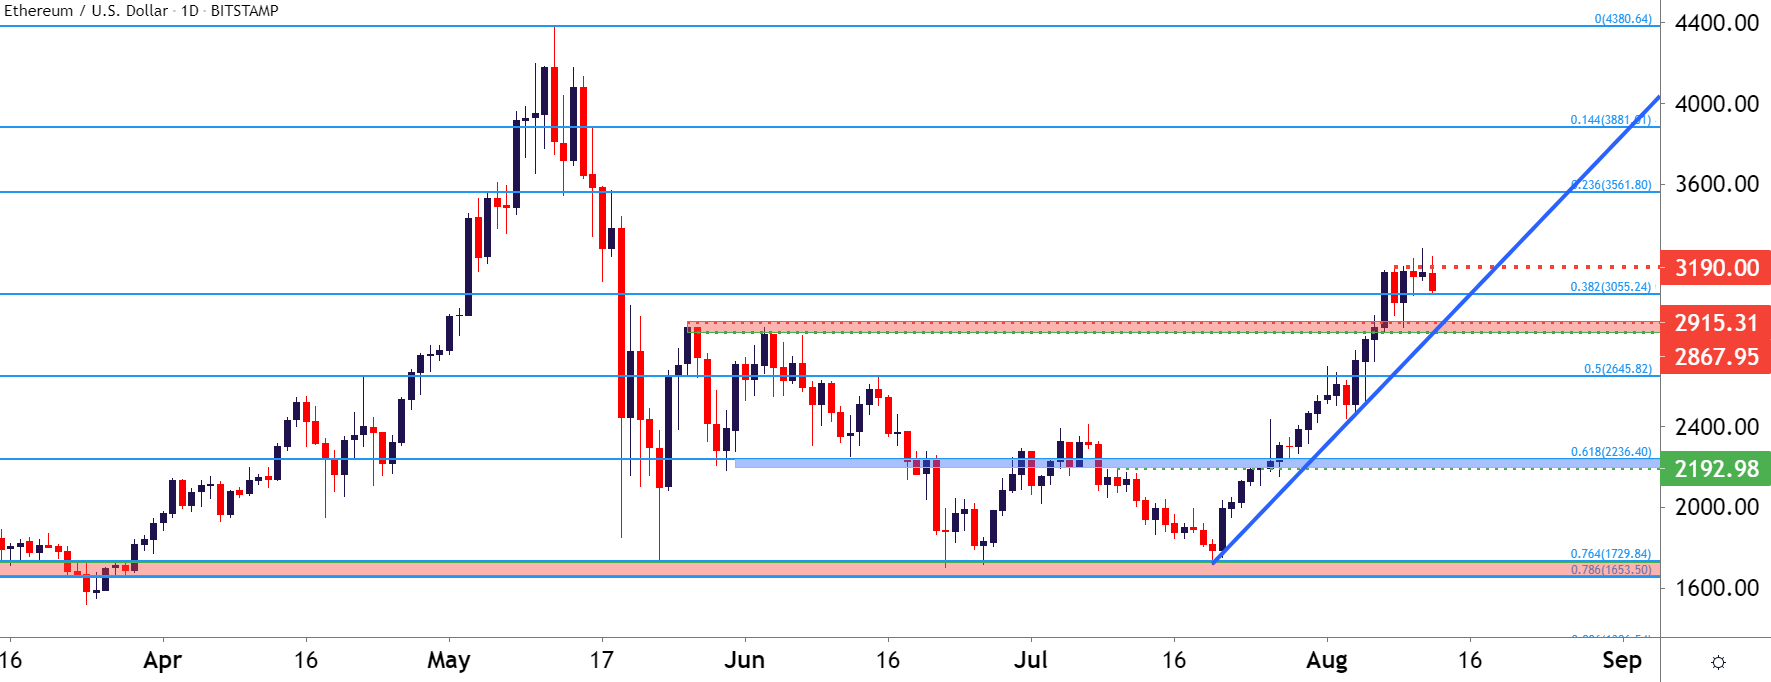
There’s a nearby level of note that’s currently being tested and this comes from the Fibonacci retracement that I had pointed out last week on Ethereum. The same retracement helped to define support around the multi-month lows while also offering some instances of short-term resistance. The level at play right now is the 38.2% retracement of that major move, and this provided a brief spot of support on Tuesday. The nearby 3k level is also of interest but given proximity, traders may look at that as confluent with the Fibonacci level plotted at 3055.
To learn more about Fibonacci, check out DailyFX Education
A bit lower is a prior resistance zone that led into the most recent breakout, and this plots from 2867-2915. This area caught a couple of different swing highs back in May and June before coming back as resistance last Friday. Prices broke out over the weekend but quickly checked back to this level for support before jumping up to another fresh high. This zone is also currently confluent with the bullish trendline that can be found by connecting the swing lows over the recent three-week-trend.
To learn more about drawing and working with trendlines, check out DailyFX Education
If those levels do not hold the pullback, a deeper reversal move may be brewing as there’d be a clear sign that momentum is slowing. But – the 50% marker of that Fibonacci retracement could be looked at as an ‘s3’ type of level and this plots around 2645. A hold of support here can open the door to short-term bullish themes and if this level is in-play anytime soon, that would mean bullish reversal potential. A breach below 2645 would be disconcerting for bulls, at which point the environment should be re-assessed regarding trend potential.
Ethereum (ETH/USD) Daily Price Chart
Chart prepared by James Stanley; Ethereum on Tradingview
— Written by James Stanley, Senior Strategist for DailyFX.com
Contact and follow James on Twitter: @JStanleyFX