
- Bitcoin price has dipped into the demand zone ranging from $43,150 to $45,791 in search of a stable foothold.
- Ethereum price is trading below the $3,000 psychological level, anticipating a sell-off to $2,893.
- Ripple price shows strength as it retests the recently flipped support level at $1.09.
Bitcoin price has slid deep into the newly formed demand zone where it is searching out stable ground for a trend reversal. This move has pushed many but not all altcoins into a momentary downtrend. Investors can expect this descent to transform into an upswing soon.
Bitcoin price awaits resurgence of buyers
Bitcoin price is currently trading inside the demand zone ranging from $43,150 to $45,791 after setting up a range high at $47,886 on August 13. If this trend continues, BTC might slide 5% and retest the range high at $42,451.
A resurgence of buyers here could kick-start a new uptrend toward $49,024. Successfully breaching this barrier would open the path to the $50,958 supply area. In a highly bullish case, the big crypto might make a run at the $55,210 ceiling.
BTC/USDT 1-day chart
On the flip side, things might get ugly for the pioneer cryptocurrency if the $42,451 support level is shattered. This move will confirm weakness among buyers and open the path for further descent.
In this case, Bitcoin price is likely to retest the support levels at $41,333 and $40,500. A breakdown of $40,500 will invalidate the bullish thesis.
Ethereum price stoops below a critical level
Ethereum price dropped roughly 11% over the past two days and is currently grappling with the $3,000 psychological level. ETH seems to be stuck between a critical support barrier at $3,000 and a supply zone ranging from $3,201 to $3,559.
Considering the recent sell-off, Ethereum price is likely to continue heading lower to find support around the $2,893 demand level.
A potential spike in selling pressure here could finish the higher low and spark a new uptrend. The resulting ascent must produce a decisive daily candlestick close above $3,559 to confirm a brand new move higher.
If it occurs, Ethereum price has free space to move to the $3,716 and $4,071 ceilings.
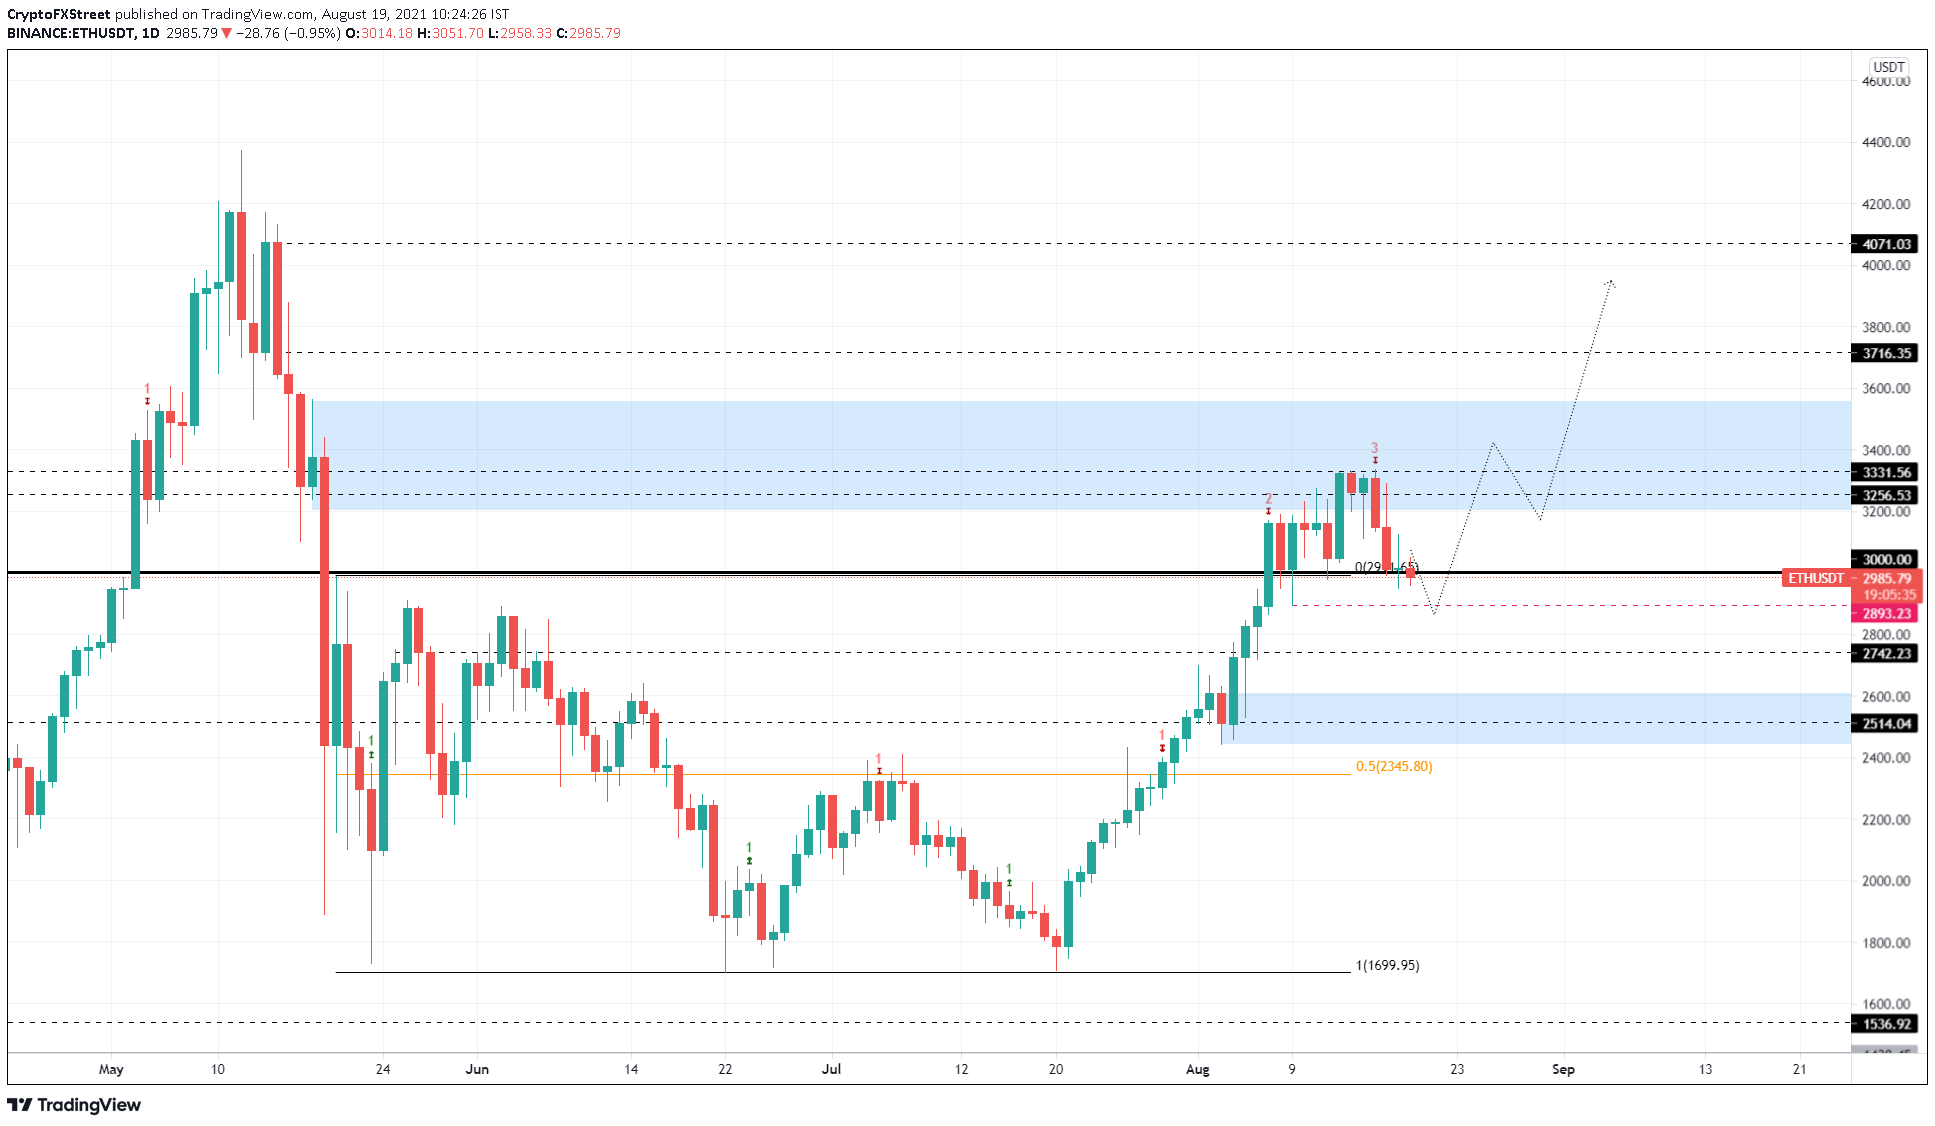
ETH/USDT 1-day chart
Regardless of the optimism around the $2,893 support level, a sudden spike in selling pressure that shatters this area to produce a lower low will invalidate the bullish thesis.
In this case, ETH might crash to either $2,742 or $2,514 based on the intensity of the bearish momentum.
Ripple price shows signs of reversal
Ripple price has been setting up higher highs and higher lows since November 2020. Drawing trend lines connecting these swing points shows the formation of an ascending parallel channel. On July 22, XRP price bounced off the lower trend line and rallied roughly 161%. This ascent sliced through two of three crucial resistance barriers and tagged the midpoint of the channel at $1.31.
While impressive, the rally has since retraced 20% and is currently grappling with the $1.09 demand barrier and shows signs of resuming the uptrend.
If the $1.09 level fails to hold, XRP price might crash 12% to tag the next support level at $0.964, where the buyers are likely to make a comeback.
The resulting upswing must shatter the channel’s midpoint and take a jab at the $1.70 resistance barrier after a 55% upswing.
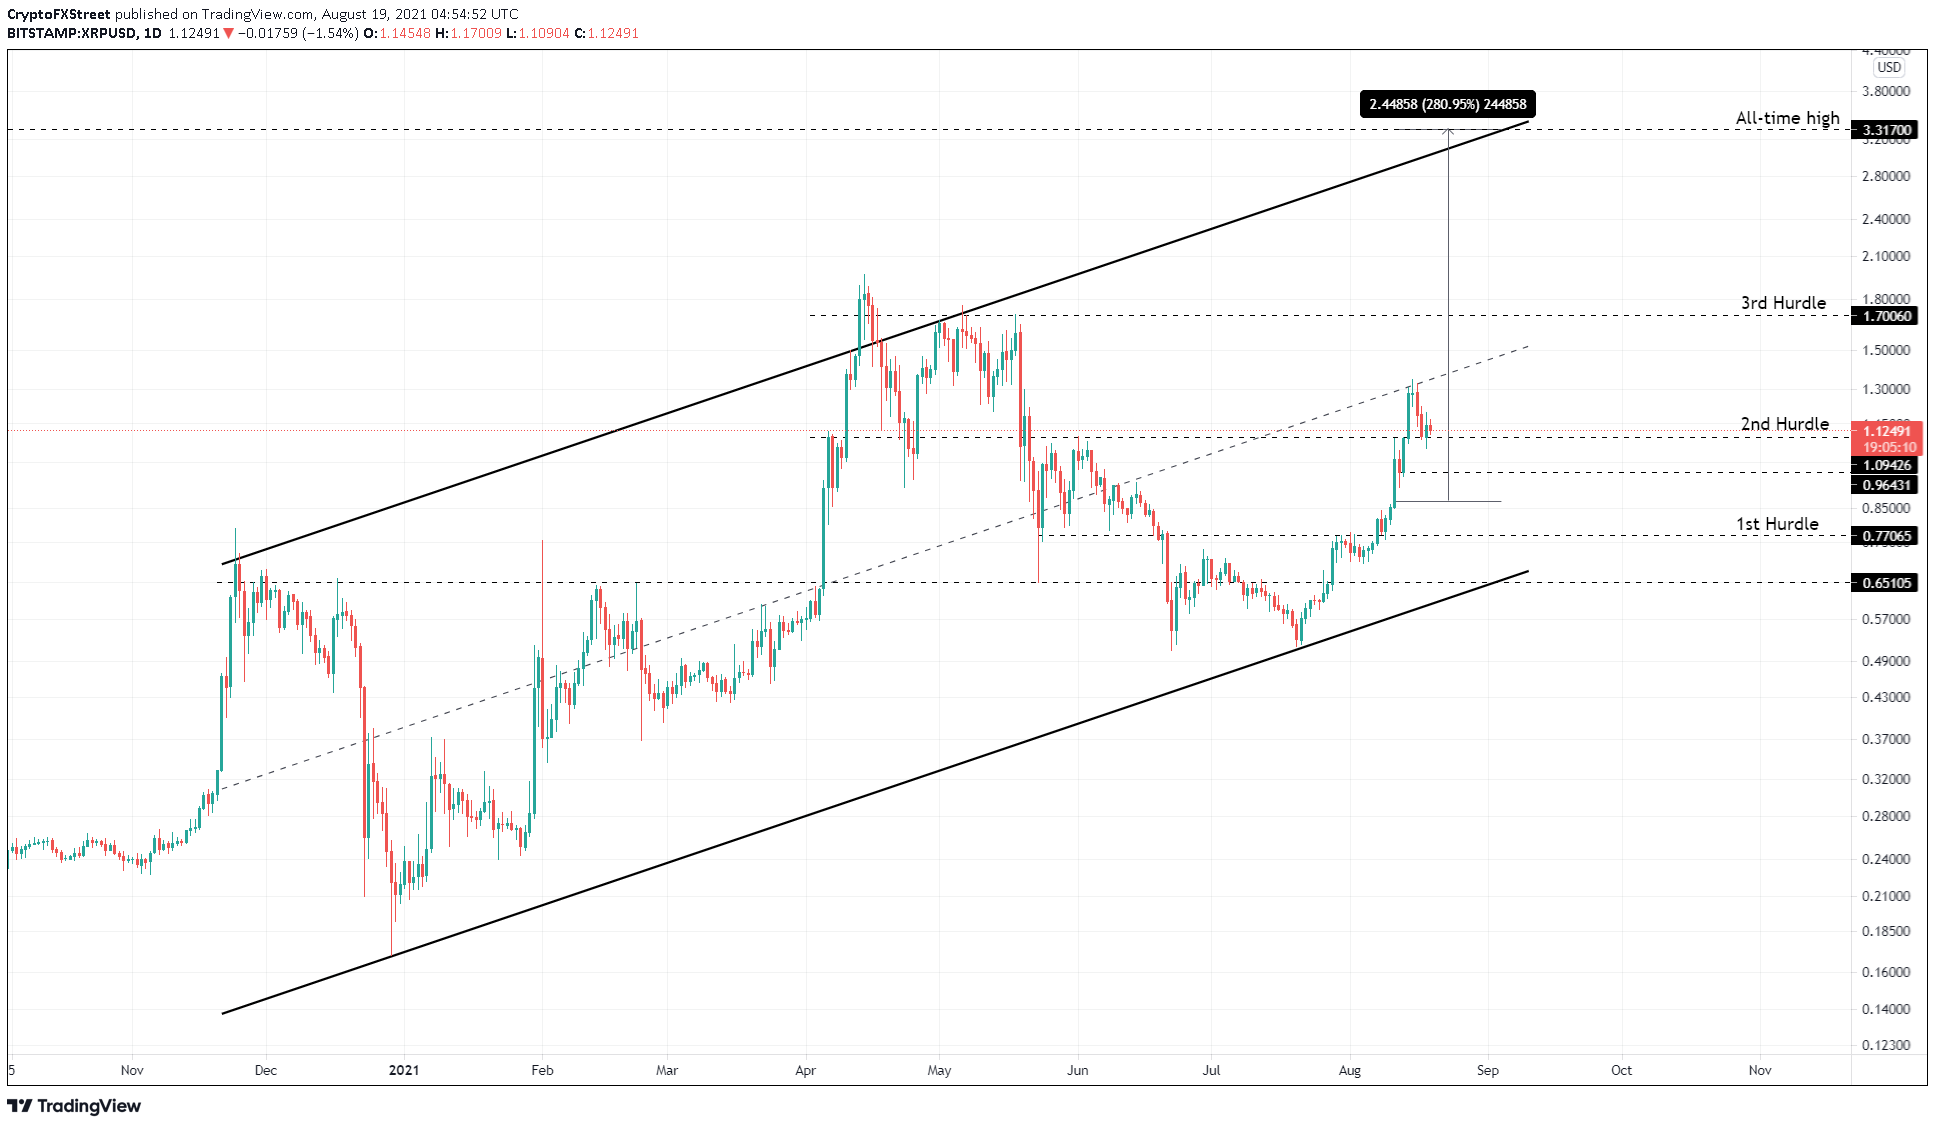
XRP/USDT 1-day chart
While assuming a resurgence of buyers around $1.09 or $0.964 is convenient, investors need to note that things will go south if bullish momentum fails to show up or if investors continue to book profits. Such a move that produces a convincing close below $0.964 will invalidate the optimistic narrative.
In a highly bearish case, this development might trigger a 20% crash to $0.77.