
- Bitcoin price has dropped 10% since its August 1 swing high at $42,599.
- Ethereum price follows BTC and has shed 9% as it bounces off the $2,460 support level.
- Ripple price came extremely close to retesting the range high at $0.785 but is now undergoing correction.
Bitcoin price retested the range high during its recent exponential upswing and the altcoins followed suit. However, this uptrend is running out of steam and is retracing as investors continue to book profits.
Ethereum and Ripple will also likely correct to stable support levels before the markets establish a direction.
Bitcoin price sets up a lower low
Bitcoin price shed roughly 10% since retesting the range high at $42,451. This down move has created a lower low at $37,955, indicating that this sell-off might continue up to $37,241, roughly 3% from the current position.
In some cases, BTC might head as low as $36,361 before the uptrend resumes. However, any breach below the 50% Fibonacci retracement level at $35,618 could lead to a negative impact on the bullish outlook.
BTC/USDT 9-hour chart
A bounce from $37,241, $36,361 or the 50% Fibonacci retracement level at $35,618 is likely to resume the uptrend. However, a breakdown of $35,618 leading to a decisive 9-hour candlestick close below it will invalidate the bullish outlook.
In some cases, the resulting selling pressure might push BTC down to $34,666 or lower.
Ethereum price awaits a catalyst
Ethereum price has been following Bitcoin’s footsteps closely. However, starting July 31, ETH seems to have temporarily broken free and rallied higher despite BTC’s slump.
Since this move was ephemeral, Ethereum price fell in line as it continued to retrace lower. So far, the smart contract token has dropped 9% to retest the support level at $2,460.
As with BTC, Ethereum price might kick-start its uptrend from $2,460 or retest the range’s midpoint at $2,297. This move would reveal a total retracement of 15% and would most likely be the place where sidelined buyers might step in and trigger another leg-up.
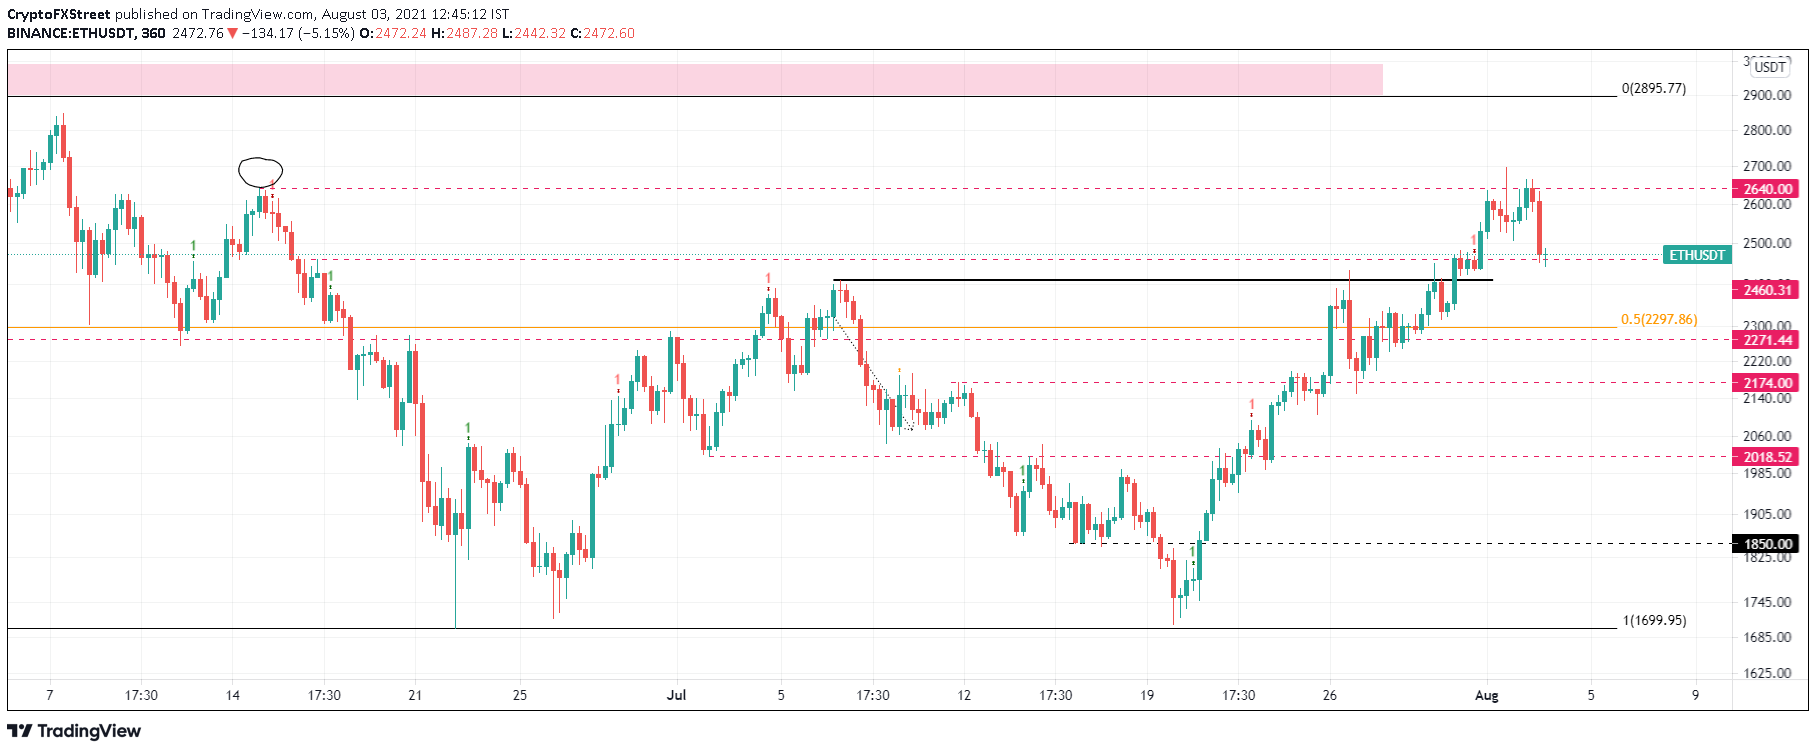
ETH/USD 6-hour chart
Regardless of the bullish outlook due to the recent climb, Ethereum price might face trouble if the $2,271 support level is breached. Such a move will invalidate the bullish outlook and indicate weak buying pressure.
Under certain circumstances, the move might even instigate holders to sell, pushing ETH as low as $2,018.
Ripple price takes a hiatus
Ripple price rallied roughly 50% from the range low at $0.508 to the range high at $0.785 in less than two weeks. Since its peak on August 1, XRP has dropped roughly 9% and is currently hovering above $0.689.
Although a bounce from the said support level is likely, a breakdown of it could lead to a retest of $0.665 and $0.647, the trading range’s midpoint, in some cases.
Investors can expect a reversal from either of the levels mentioned above to retest the $0.785 resistance level.
This move would represent a 21% upswing from $0.647.
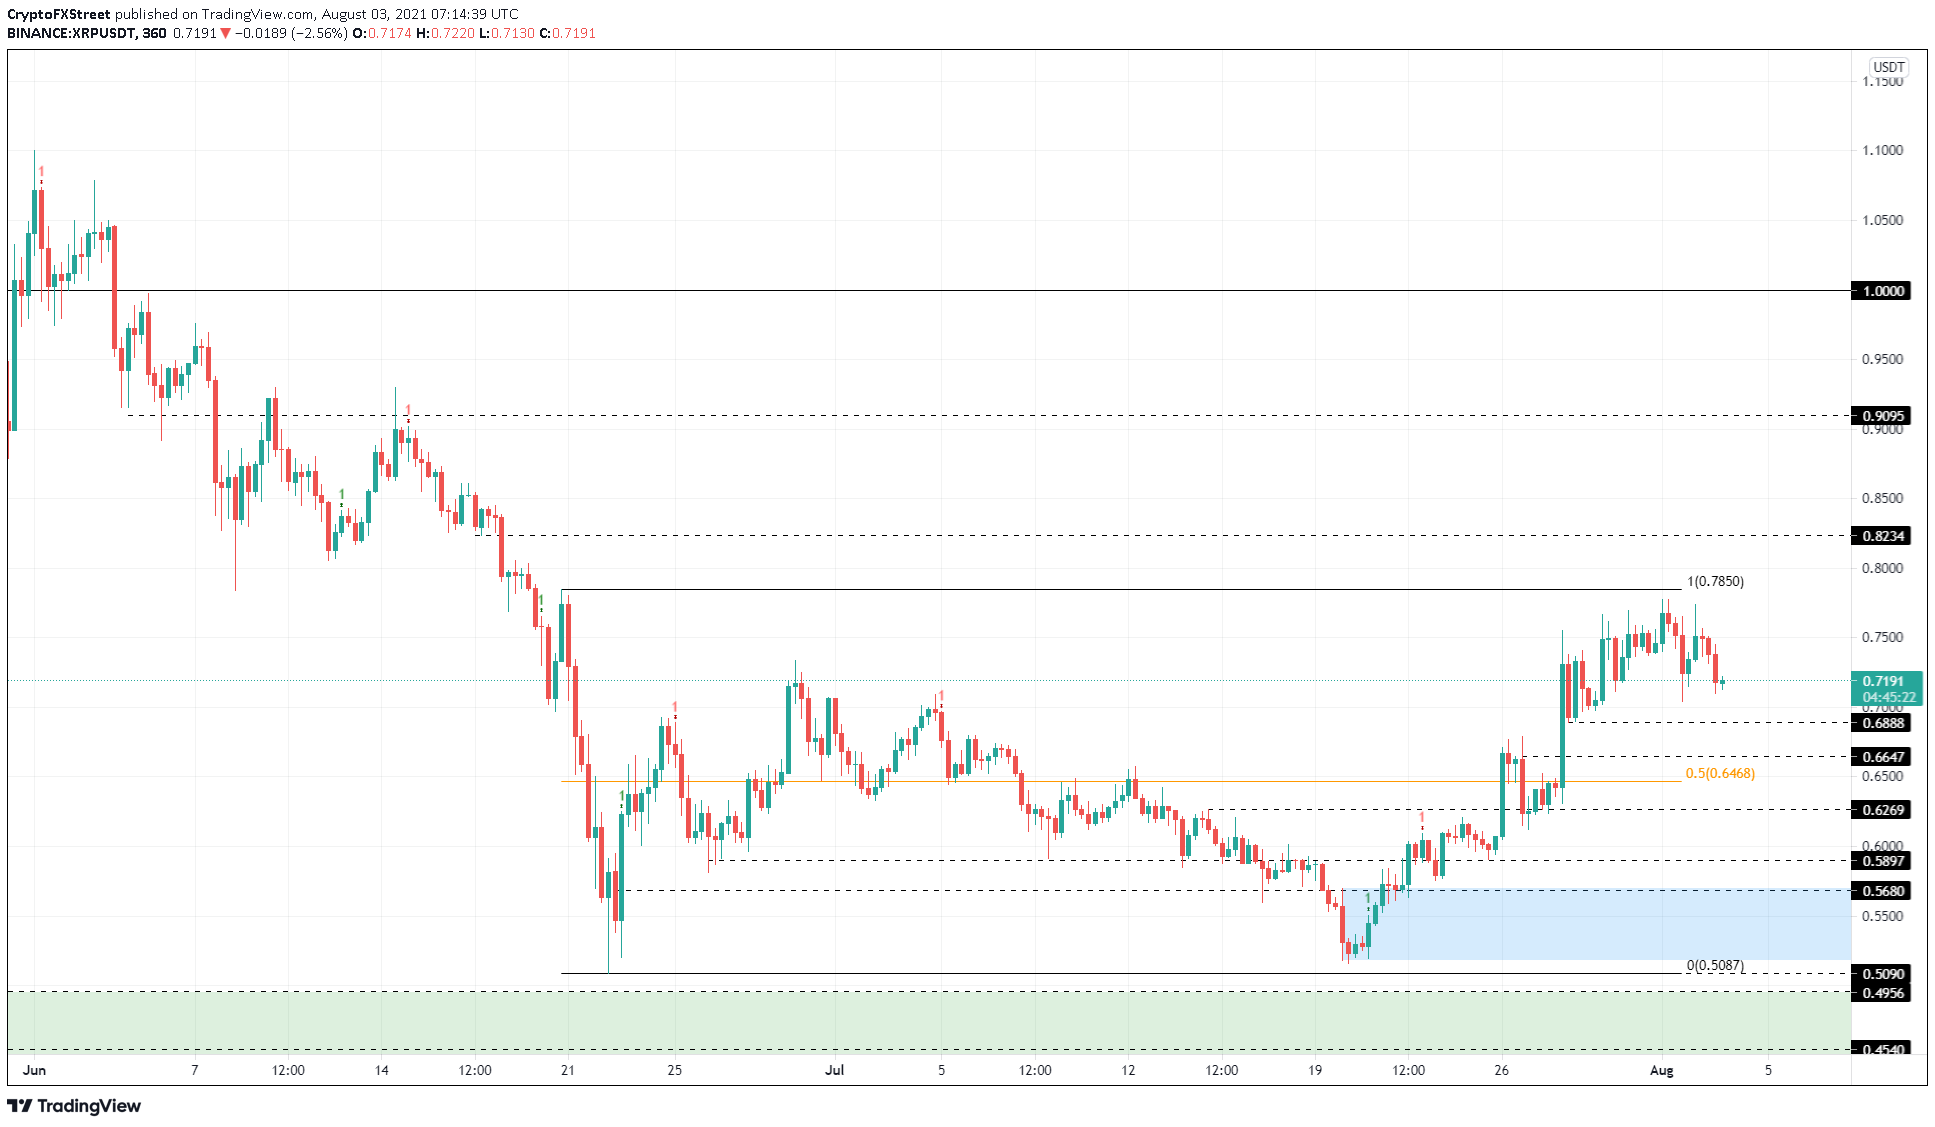
XRP/USDT 6-hour chart
On the other hand, a breakdown of $0.647 will indicate weak buying pressure and might catalyze a move lower. If this were to happen, leading to a breach of the $0.627 support level, it would invalidate the bullish thesis and trigger a 6% move to $0.590.