
- Bitcoin price deviation from its long-term trend indicates the flagship cryptocurrency is cheap.
- Ethereum price overcomes the noteworthy resistance of the February 2021 high, but volume remains thin.
- XRP price encounters the formidable resistance defined by the 200-day SMA and the anchored VWAP.
Bitcoin, Ethereum and Ripple overcome minor resistance levels in the latest step of advancing their rebounds from June 22 lows. Significant obstacles remain, creating technical headwinds as the cryptocurrency complex attempts to leave the second quarter corrections in the past.
Meanwhile, the South Africa financial regulator says its hands are tied in an alleged $3.6 billion Bitcoin fraud, but it will introduce new regulations in the coming months.
South African regulators now consider cryptocurrency regulations
Africrypt, a firm launched in 2019 by two South African brothers, promised a minimum return of fives times the amount invested, according to police, but it appears they only invested $126k. Legal representatives of affected clients say the brothers and the Bitcoin worth as much as $3.6 billion have disappeared.
The South Africa financial regulator says it cannot do anything regarding the alleged fraud because cryptocurrency is not a regulated financial product. Instead, the Financial Sector Conduct authority can only examine complaints with no regulatory recourse available.
However, in response to the alleged fraud and other scams, South Africa is urgently moving to introduce the oversight of cryptocurrency assets. The new regulatory timeline projects a working framework within six months, adopting the view that “crypto is a financial product and should be regulated as a financial product.”
As part of the framework, South African regulators will begin with rules related to knowing the customer for crypto exchanges and creating surveillance systems to monitor if money is being laundered out of the country. Guidelines for investor protection and rules for managing capital risk will come later.
Despite the global boom in the asset class, South African cryptocurrency service providers have been functioning with no supervision of regulatory powers. It is hoped that the new measures will treat cryptocurrencies as risky and “ensure that the financial sector is aware of those risks and pricing for those risks properly.”
It is another step in developing global regulation of the asset class. It follows the decision over the weekend by the U.K. financial regulator to ban Binance Markets Ltd. from doing any business in the country over.
Bitcoin price builds on the rebound, but resistance looms large
Last week’s rebound from the increasingly critical $30,000 was the fifth reminder of how vital the level is to the future of Bitcoin price. The quickness of the rebound communicates the presence and interest of prominent investors, including institutions, using the risk level to accumulate positions. Undoubtedly, retail investors participated, but it is large investors that can ignite sizeable BTC rebounds.
Each successful test establishes a better foundation to absorb negative news, such as the decision by the U.K. regulator, Financial Conduct Authority, to ban Binance from operating in the U.K. over the weekend.
The chart below (as of June 22) from Willy Woo emphasizes how large investors are capitalizing on pullbacks to the $30,000 range.
Source: Willy Woo
The result of last week’s volatility was a bullish weekly hammer candlestick pattern that closed Bitcoin price above the strategically important 50-week simple moving average (SMA) at $30,452 and the anchored VWAP from July 2020 at $33,422. The hammer was triggered yesterday with a trade and daily close above the hammer high of $35,741. The bullish price action has increased the odds that BTC will seek higher prices moving forward.
Some resistance will materialize at the 50-day SMA at $37,768. Still, Bitcoin price should overcome the moving average and steadily rise to fierce resistance at $41,500-43,500 that includes the 38.2% Fibonacci retracement of the April-June correction at $42,589. A rally of that magnitude would deliver a 25% gain from the current price.
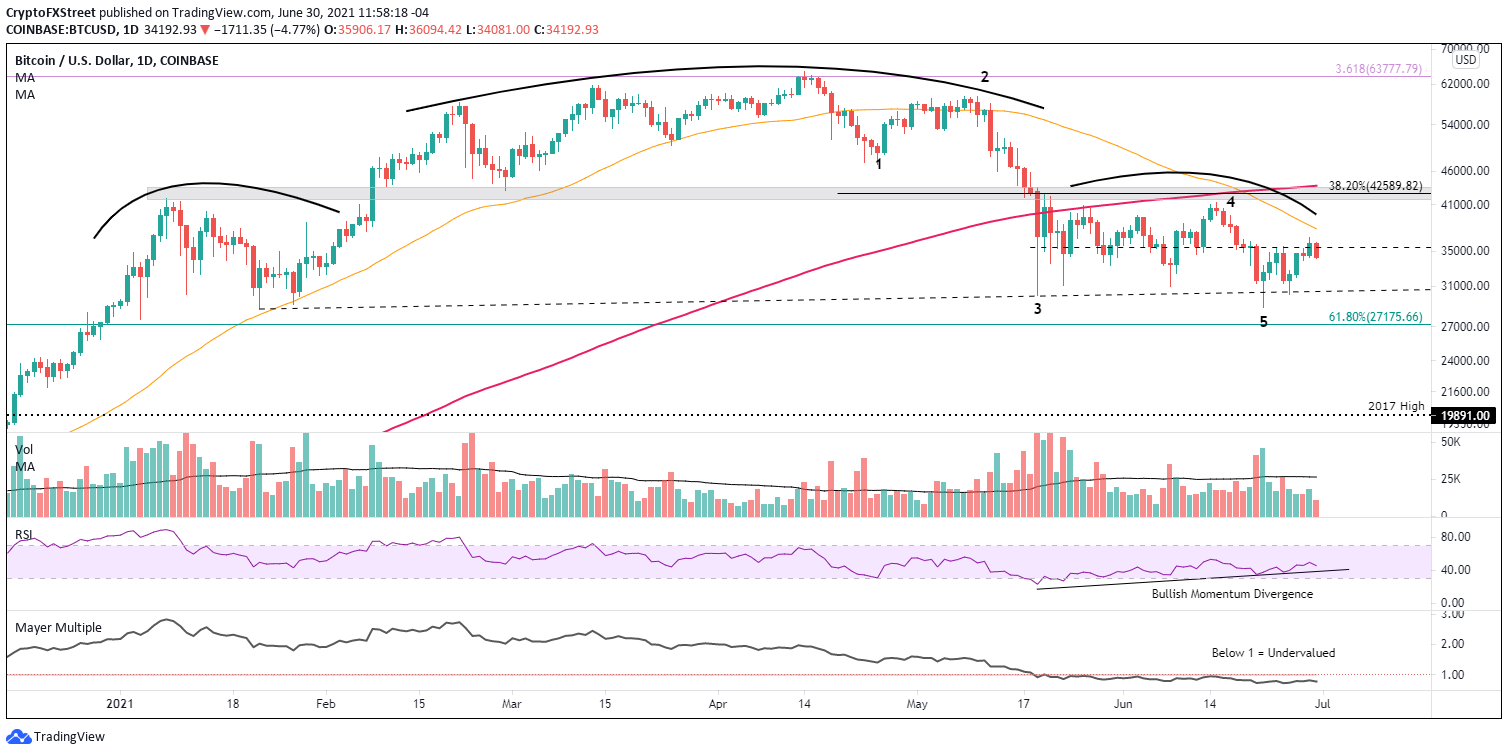
BTC/USD daily chart
From a bigger picture, Bitcoin price did trigger the neckline of a head-and-shoulders topping pattern on June 22. The pattern remains active until BTC trades above the right shoulder high of $41,332, thus improving the probabilities that last week’s low was the correction low. Moreover, the digital asset did trigger a bearish Death Cross pattern on June 19 when the 50-day SMA crossed below the 200-day SMA.
Both bearish developments need to be present in formulating and executing BTC trading programs.
To date, Bitcoin price has afforded the BTC investor with weekly hammer candlestick pattern that triggered yesterday, a bullish momentum divergence on the daily Relative Strength Index (RSI), and a complete Elliot five wave down pattern. Moreover, the Mayer multiple, a ratio of the Bitcoin price to its 200-day SMA, indicates that Bitcoin is cheap relative to its long-term trend and is an excellent time to buy.
These factors combined with the support of key price levels suggest BTC is primed for better outcomes moving forward.
Ethereum price trend gets stronger, but commitment remains subdued
The positive response of Ethereum price to the outstanding support framed by the 200-day SMA at $1,878, the 2020 rising trend line at $1,793, the 61.8% retracement of the March 2020-May 2021 advance at $1,730 and the May 23 low of $1,728 created a hint of optimism for enthusiastic ETH investors and short term speculators on June 22.
The price action that followed was not compelling or comparable to rebounds in other altcoins, suggesting that ETH continued to be harnessed by depleted interest and attempts to overcome the February high of $2,041 on a daily closing basis would be a remote possibility. However, on June 28, Ethereum price closed above the February high, enlisting the first positive step towards higher prices. The positive step was followed by another strong day yesterday.
Ethereum price is still confronted by other technical levels, including the 50-day SMA at $2,564, the apex of the symmetrical triangle at $2,730 and the daily Ichimoku Cloud, creating a trifecta of resistance moving forward.
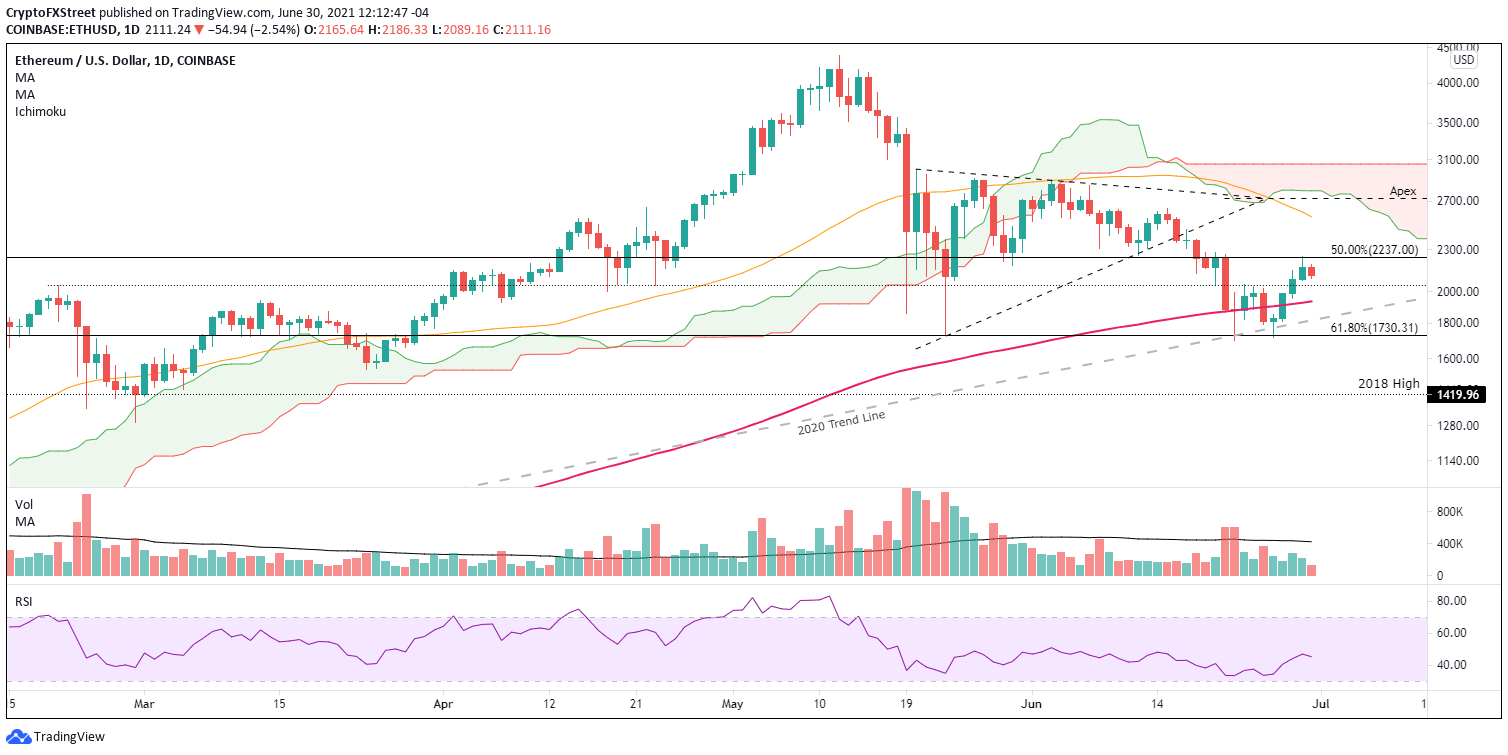
ETH/USD daily chart
On the flips side, if Ethereum price logs a daily close below the 2020 trend line at $1,807 and the 61.8% retracement at $1,730, ETH may explore the support established by the 2018 high at $1,419, yielding a 32% decline from the current price.
There is no other way to say it; Ethereum price had been zombie-like until this week, showing no signs of relative strength against Bitcoin or other digital assets, thereby keeping forecasts tilted bearish or at least neutral. Nevertheless, this week’s strength might be the catalyst to shake ETH from the doldrums and on the path to higher price levels.
XRP price logs big gain but may be part of a bearish pattern
At the June 22 low, XRP price had declined 70% from the April high of $1.96 and a noticeable 50% from the June 1 high while liquidating the May 23 low of $0.652, a level fortified by weekly highs in late 2020 and February 2021. Nonetheless, Ripple realized three important technical milestones that provoked a 43% rebound: a test of the 78.6% retracement of the December 2020-April 2021 advance at $0.555, an undercut of the 50-week SMA at $0.540 and registered an oversold reading on the daily RSI for the first time since late December 2020.
Notably, the XRP price outlook received a jolt of optimism on June 28 when Ripple closed the week just below the May low of $0.652 and in the upper half of the weekly trading range. A vast improvement considering that at one point last week, XRP price appeared ready to test the 200-week SMA at $0.449.
Yesterday’s near double-digit rise lifted XRP price above $0.652 and a test of the 200-day SMA at $0.730. The gain fell short of the anchored VWAP from December 29, 2020, at $0.740 and the fierce resistance defined by the neckline of a multi-year inverse head-and-shoulders pattern which rests at $0.760.
As stated previously, XRP price will not be free until a daily close above $0.760. If achieved, Ripple can expect a rally to the 50-day SMA at $0.952 and potentially to the psychologically important $1.00.
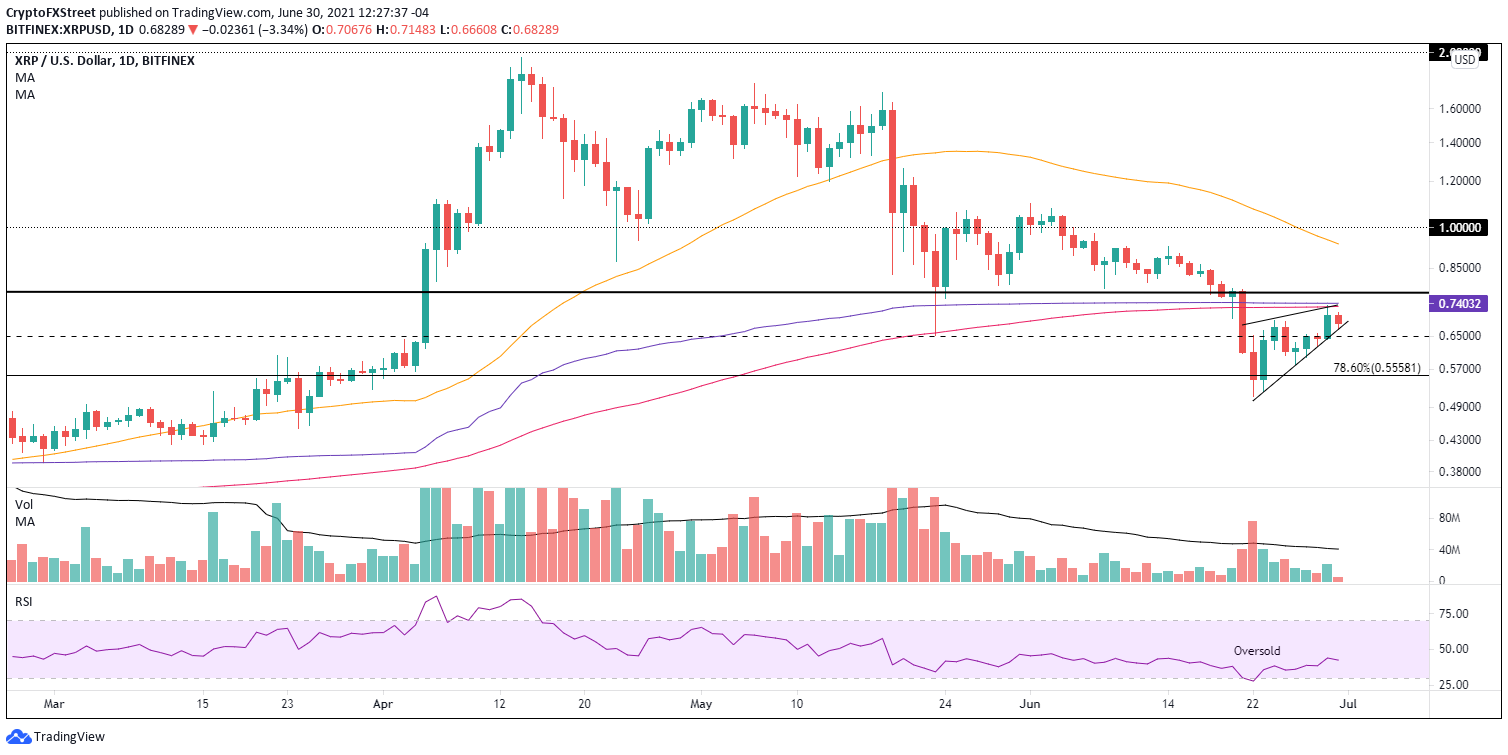
XRP/USD daily chart
Conversely, the developing rebound below $0.760 could be shaping a bearish flag formation. A resolution to the downside could trigger a weekly close below the 50-week SMA at $0.551. If XRP price closes below $0.551, it may signal a complete reversion to the mean and test the 200-week SMA at $0.451. A drop to the mean would equal a 33% decline from the current price.
Moving forward, XRP price may choose to trade between the 50-week SMA at $0.540 and the resistance around $0.740. It would grant ideal trading conditions for swing traders due to the bulking support and resistance levels and the resulting 30% profit opportunities that lie between.