
- Litecoin Token is trading under the strong support zone, while if it manages to hold, we can see a good price recovery.
- The token is trading under all moving averages, and the 50-DMA is heading towards 200-DMA for death or bearish crossover.
- The pair of LTC/BTC is trading under pressure at 0.003971 BTC with an intraday loss of -8.15%; whereas, the ratio of LTC/ETH is CMP at 0.06644 ETH (-4.56% in the last 24-hours)
Over the monthly chart, Litecoin token is trading under the strong support zone, and sharp recovery is expected if it manages to hold support. Moreover, the coin is trading below all vital moving averages of 20, 50, 100, and 200-DMA, while 50 and 200-DMA are heading for a death crossover. The bulls seem trapped as LTC is continuously trading on a bearish note with good selling volume. Likewise, if the bulls fail to hold the support zone of $140 to $115, we can see a sharp correction or selloff. While the closing of day candles above 20 and 200-DMA with good volume will show the first sign of strength. Support on the lower side is at $115 and $98; whereas, resistance on the higher side is $180 and $230.
Litecoin Token Trading on Bearish Note
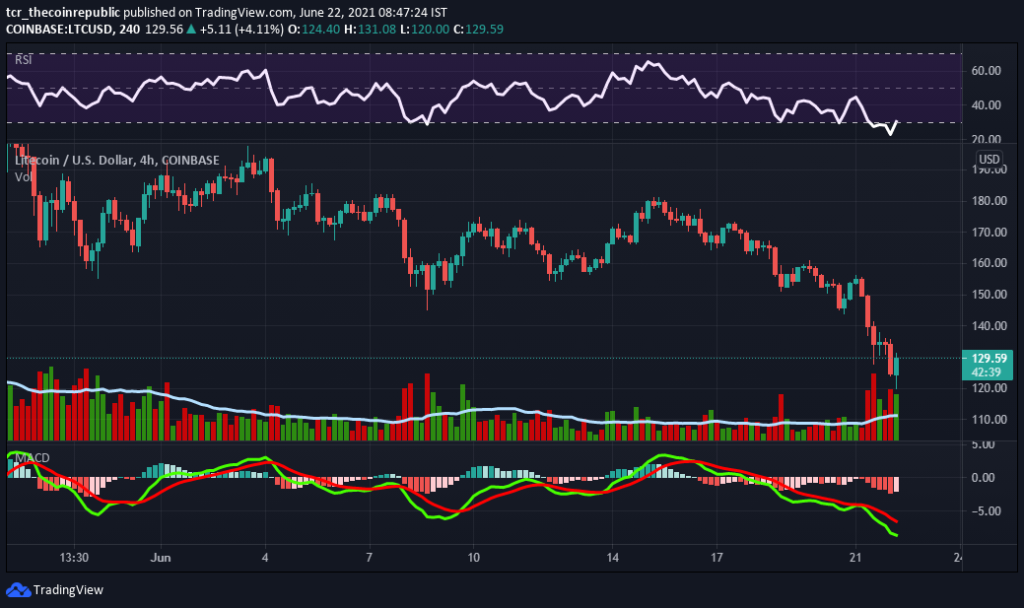
Litecoin token trading on the bearish note will continuously be heading towards the lower levels, and selling volume also jumped above the average line. Moreover, the digital asset reaches under the oversold zone and can give a short-term pullback soon. However, the temporary weekly chart structure still looks bearish, with technicals also oversold. Presently the coin is trading at $129 with an intraday loss of -14.45%, and volume jumped nearly +71%, standing at $3,252,515,094.
Relative Strength Index (NEUTRAL): litecoin token presently reaches the oversold zone over the weekly chart as it is now trying to recover from lower or oversold levels. While trading at 30.
Moving Average Convergence Divergence (BEARISH) currently indicates a bearish trend on the daily chart with no sign of strong recovery. The buyer’s signal line (green) is trading under pressure, and the seller’s line (red) is more significant.
Support levels: $115 and $98
Resistance levels: $180 and $230.