
- Litecoin Price is facing a hurdle of 20-day short term moving average while also face strong buying interest from lower levels of $100-$105 zone
- The coin is currently trading below all vital moving avengers of 20, 50, 100, and 200-Day with average volume action
- The pair of LTC/BTC is trading under pressure with an intraday loss of -2.73% at 0.003862 BTC; while the ratio of LTC/ETH is CMP at 0.06802 ETH with minor gains of +0.28% in the last 24-hours
Over the monthly chart, litecoin price is trying to recover after an intense or continuation selling pressure from the higher levels. Meanwhile, the token slipped near the last 90-days lows of $105, although some recovery is also seen from lower levels. Since the recovery is not supported by volume action, the Bulls must face resistance or rejection of the 20-DMA line. The sustainability of day candles above 20 and 200-DMA will strengthen the bulls in upcoming trading sessions. The major or phycological hurdle on the higher side is at $200-$220. Support on the lower levels is at $110 and $95, while resistance to higher grades is $158 and $189.
Litecoin Price is Now Trying to Recover From Lower Levels
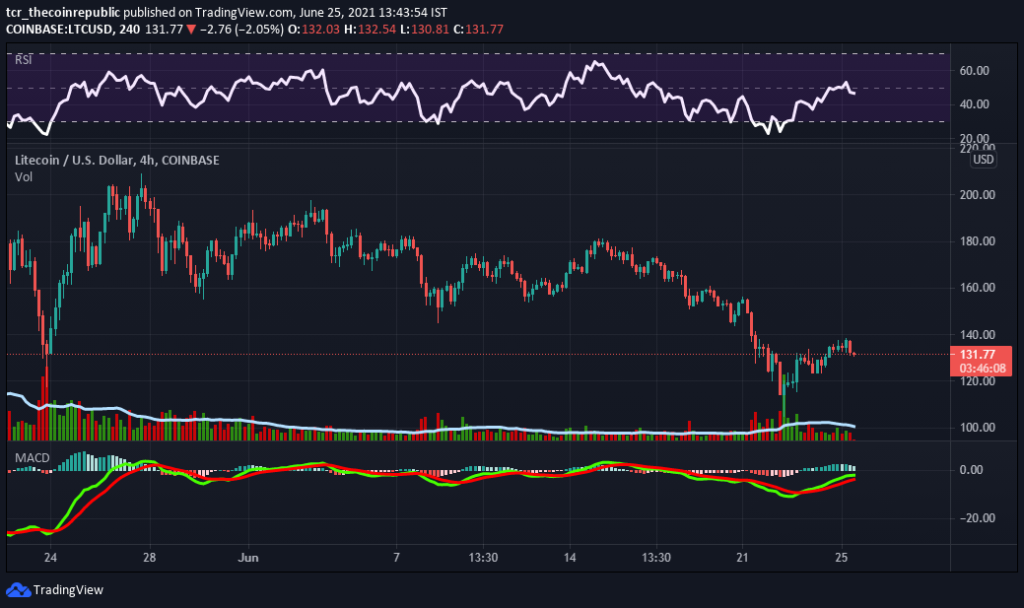
After a short selling or downtrend over the weekly chart, Litecoin’s price is now trying to recover from lower levels. While the recovery is not many significant and technical parameters also seem to get weaker. The token can witness a small pullback from the higher levels as technical indicators also suggest the same. Presently the token is trading at $131 with an intraday loss of -0.81% and volume/market cap ratio standing at 0.2065.
Relative Strength Index (CAUTION): litecoin price RSI presently projects bearish or caution over the weekly chart. In contrast, the RSI is heading towards the oversold zone after a good recovery from lower level CMP at 47.
Moving Average Convergence Divergence (BULLISH) currently indicates a bullish trend on the daily chart. The buyer’s signal line (green) is more significant than the seller’s line (red). The buyer signal line is gradually heading closer to the seller signal line, and the crossover will create bearish momentum.
Support levels: $110 and $95
Resistance levels: $158 and $189.