
Bitcoin (BTCUSD)
Above: Bitcoin (BTCUSD) Chart
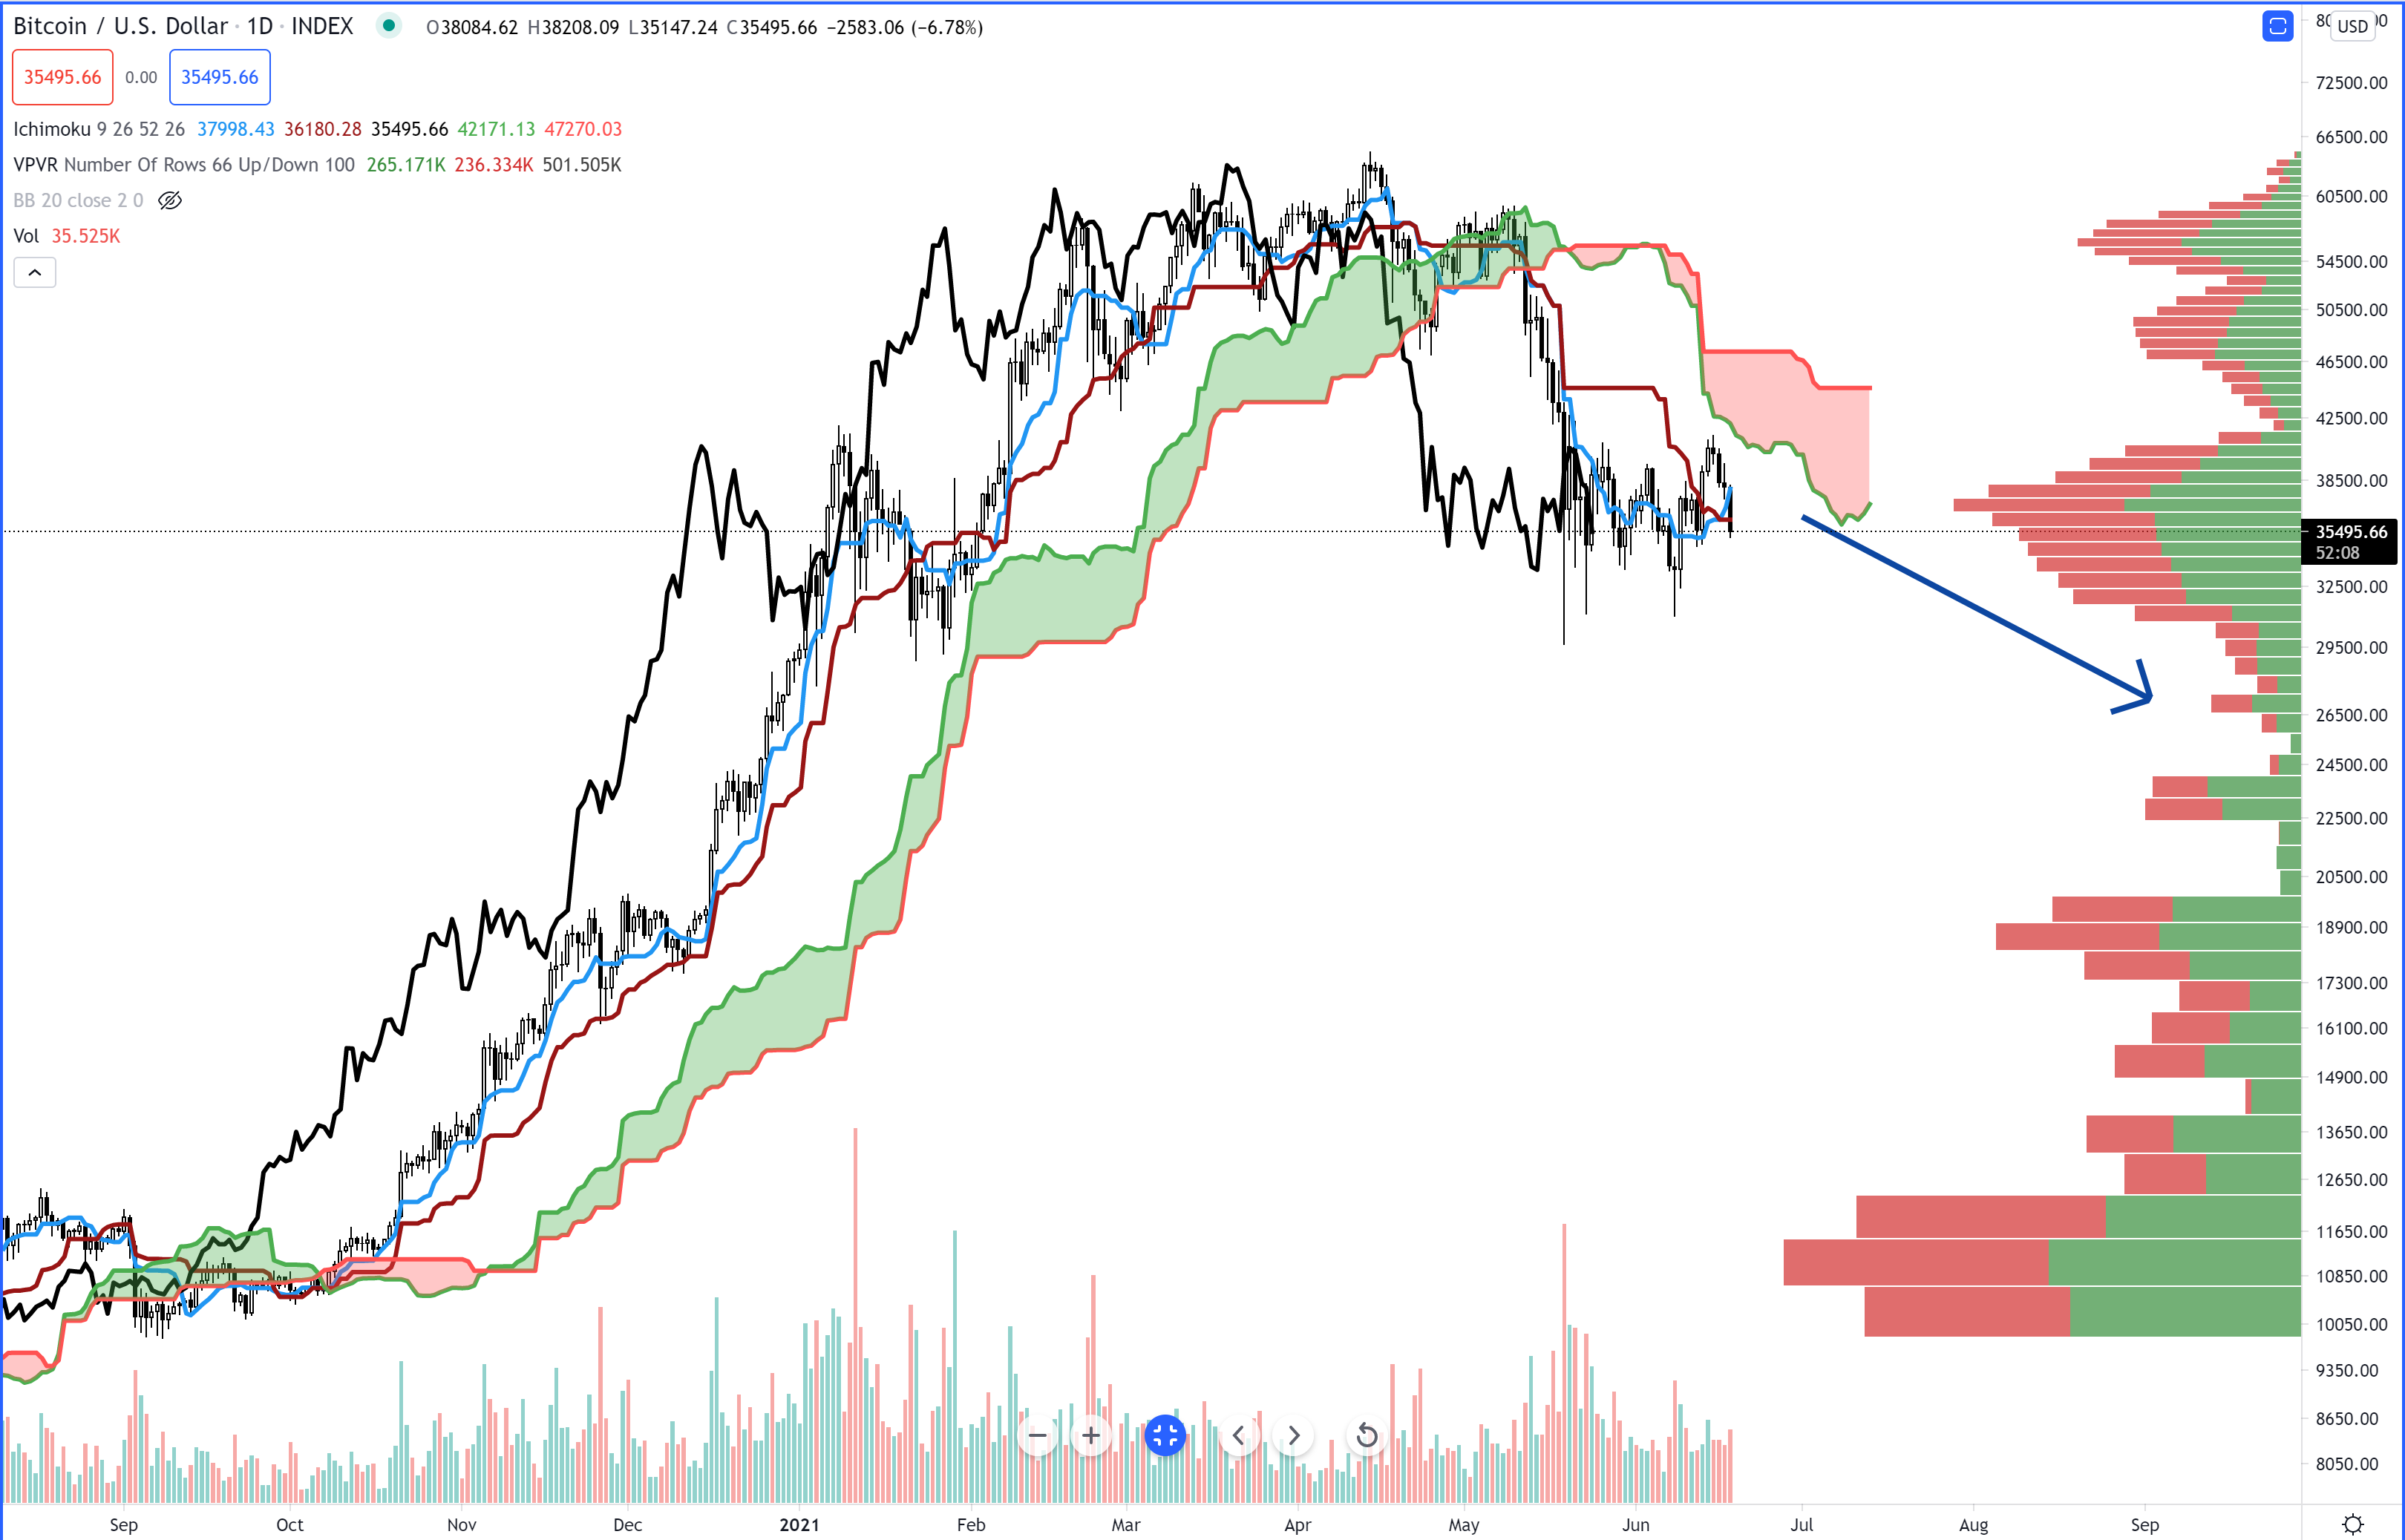
If you watched a few of my prior Bitcoin videos this week, you may recall the foldback pattern that I placed on Bitcoin’s chart. The foldback pattern (not shown) indicates that Bitcoin is at a point where the next swing structure begins – and that is a swing lower. The key level for Bitcoin as we head into the weekend is 33,500. If Bitcoin closes below 33,500 or remains below that level, then Bitcoin is heavily bearish. If you look at the blue arrow on the chart above, you’ll see its angled down and to the left and follows the contour of the volume profile before ending at 27,500. Pay attention to the volume profile – it is telling us that Bitcoin has an easier time moving lower than it does moving higher and the lower it moves, the speed of the descent increases. 27,500 is the next high volume node to test as support.
Litecoin (LTCUSD)
Above: Litecoin (LTCUSD) Chart
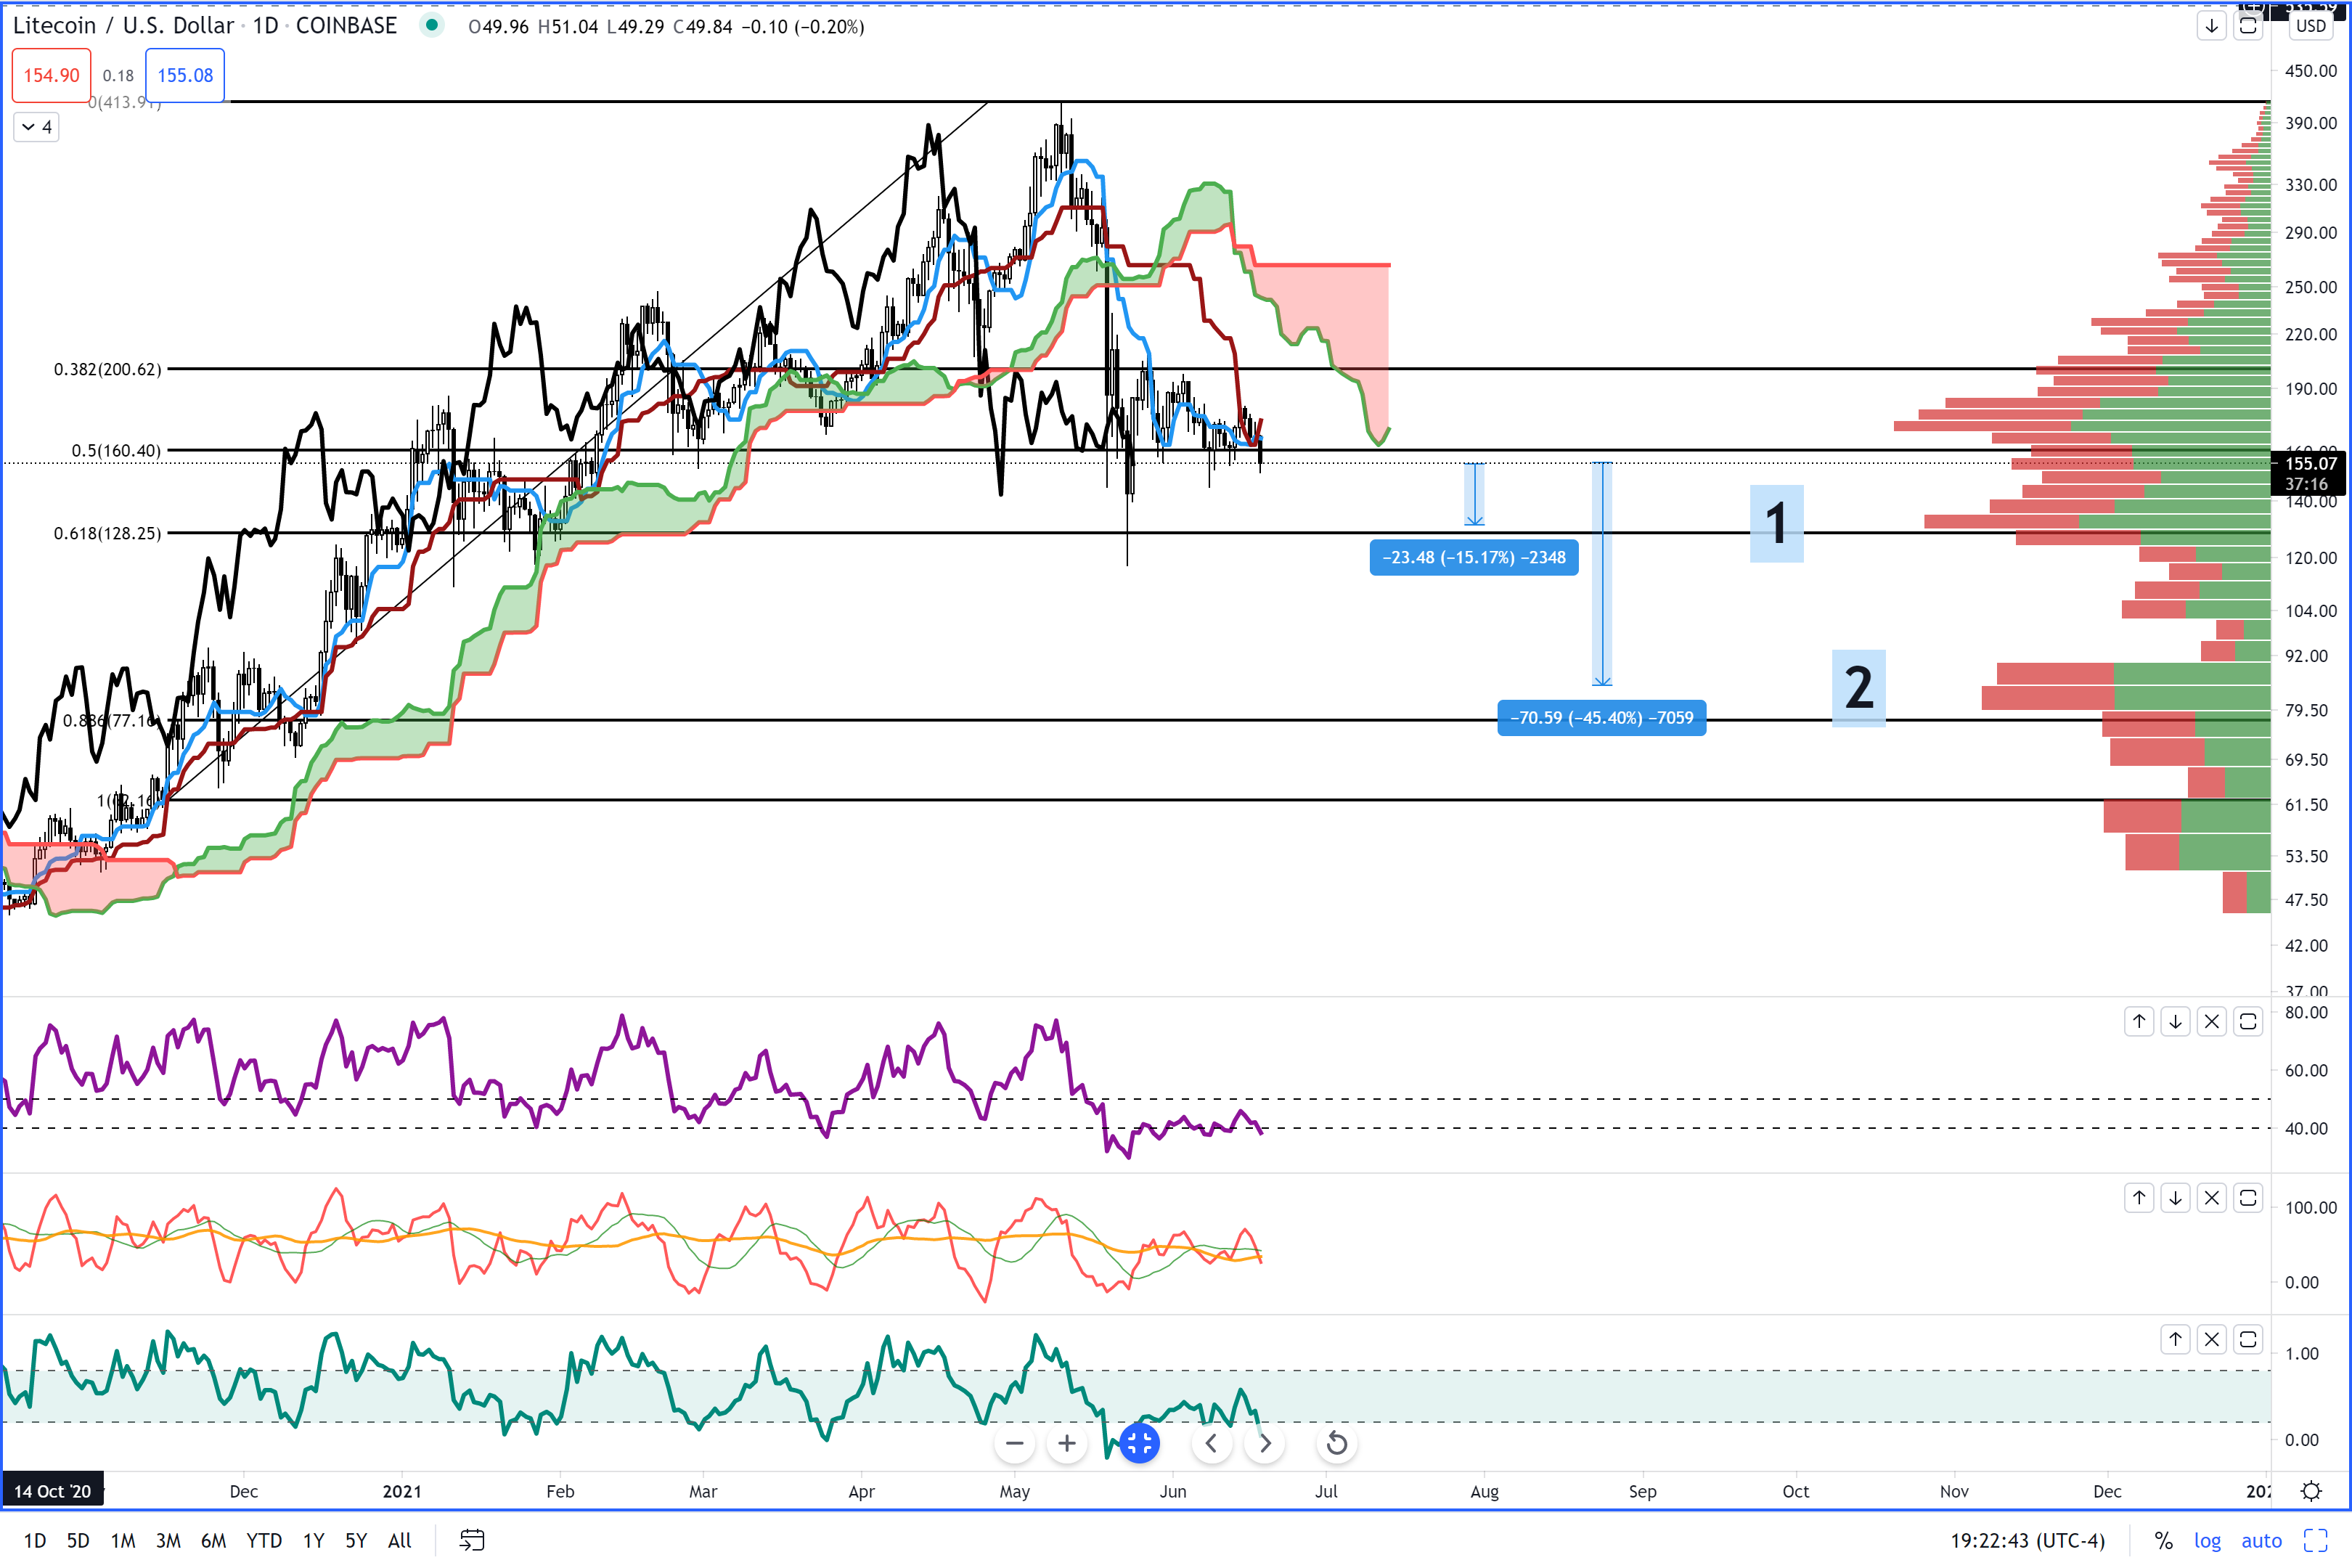
It’s been a while since I’ve written about Litecoin! There are two primary levels of support that I see and I consider both as a level to take profit on a short or to initiate a buy limit order(s). The first level, at #1, is the 132 value area. 132 contains a high volume node as well as the 61.8% Fibonacci Retracement. From the current traded level of 155, 132 is roughly a -15% drop. The last primary support zone is at #2 – the 89 value area. Down at the 89 level the powerful 88.6 Fibonacci level along with a high volume node and represents a -45% Fibonacci Retracement from the current close on the chart above.
Polygon (MATIC)

Above: Polygon (MATICUSD) Chart
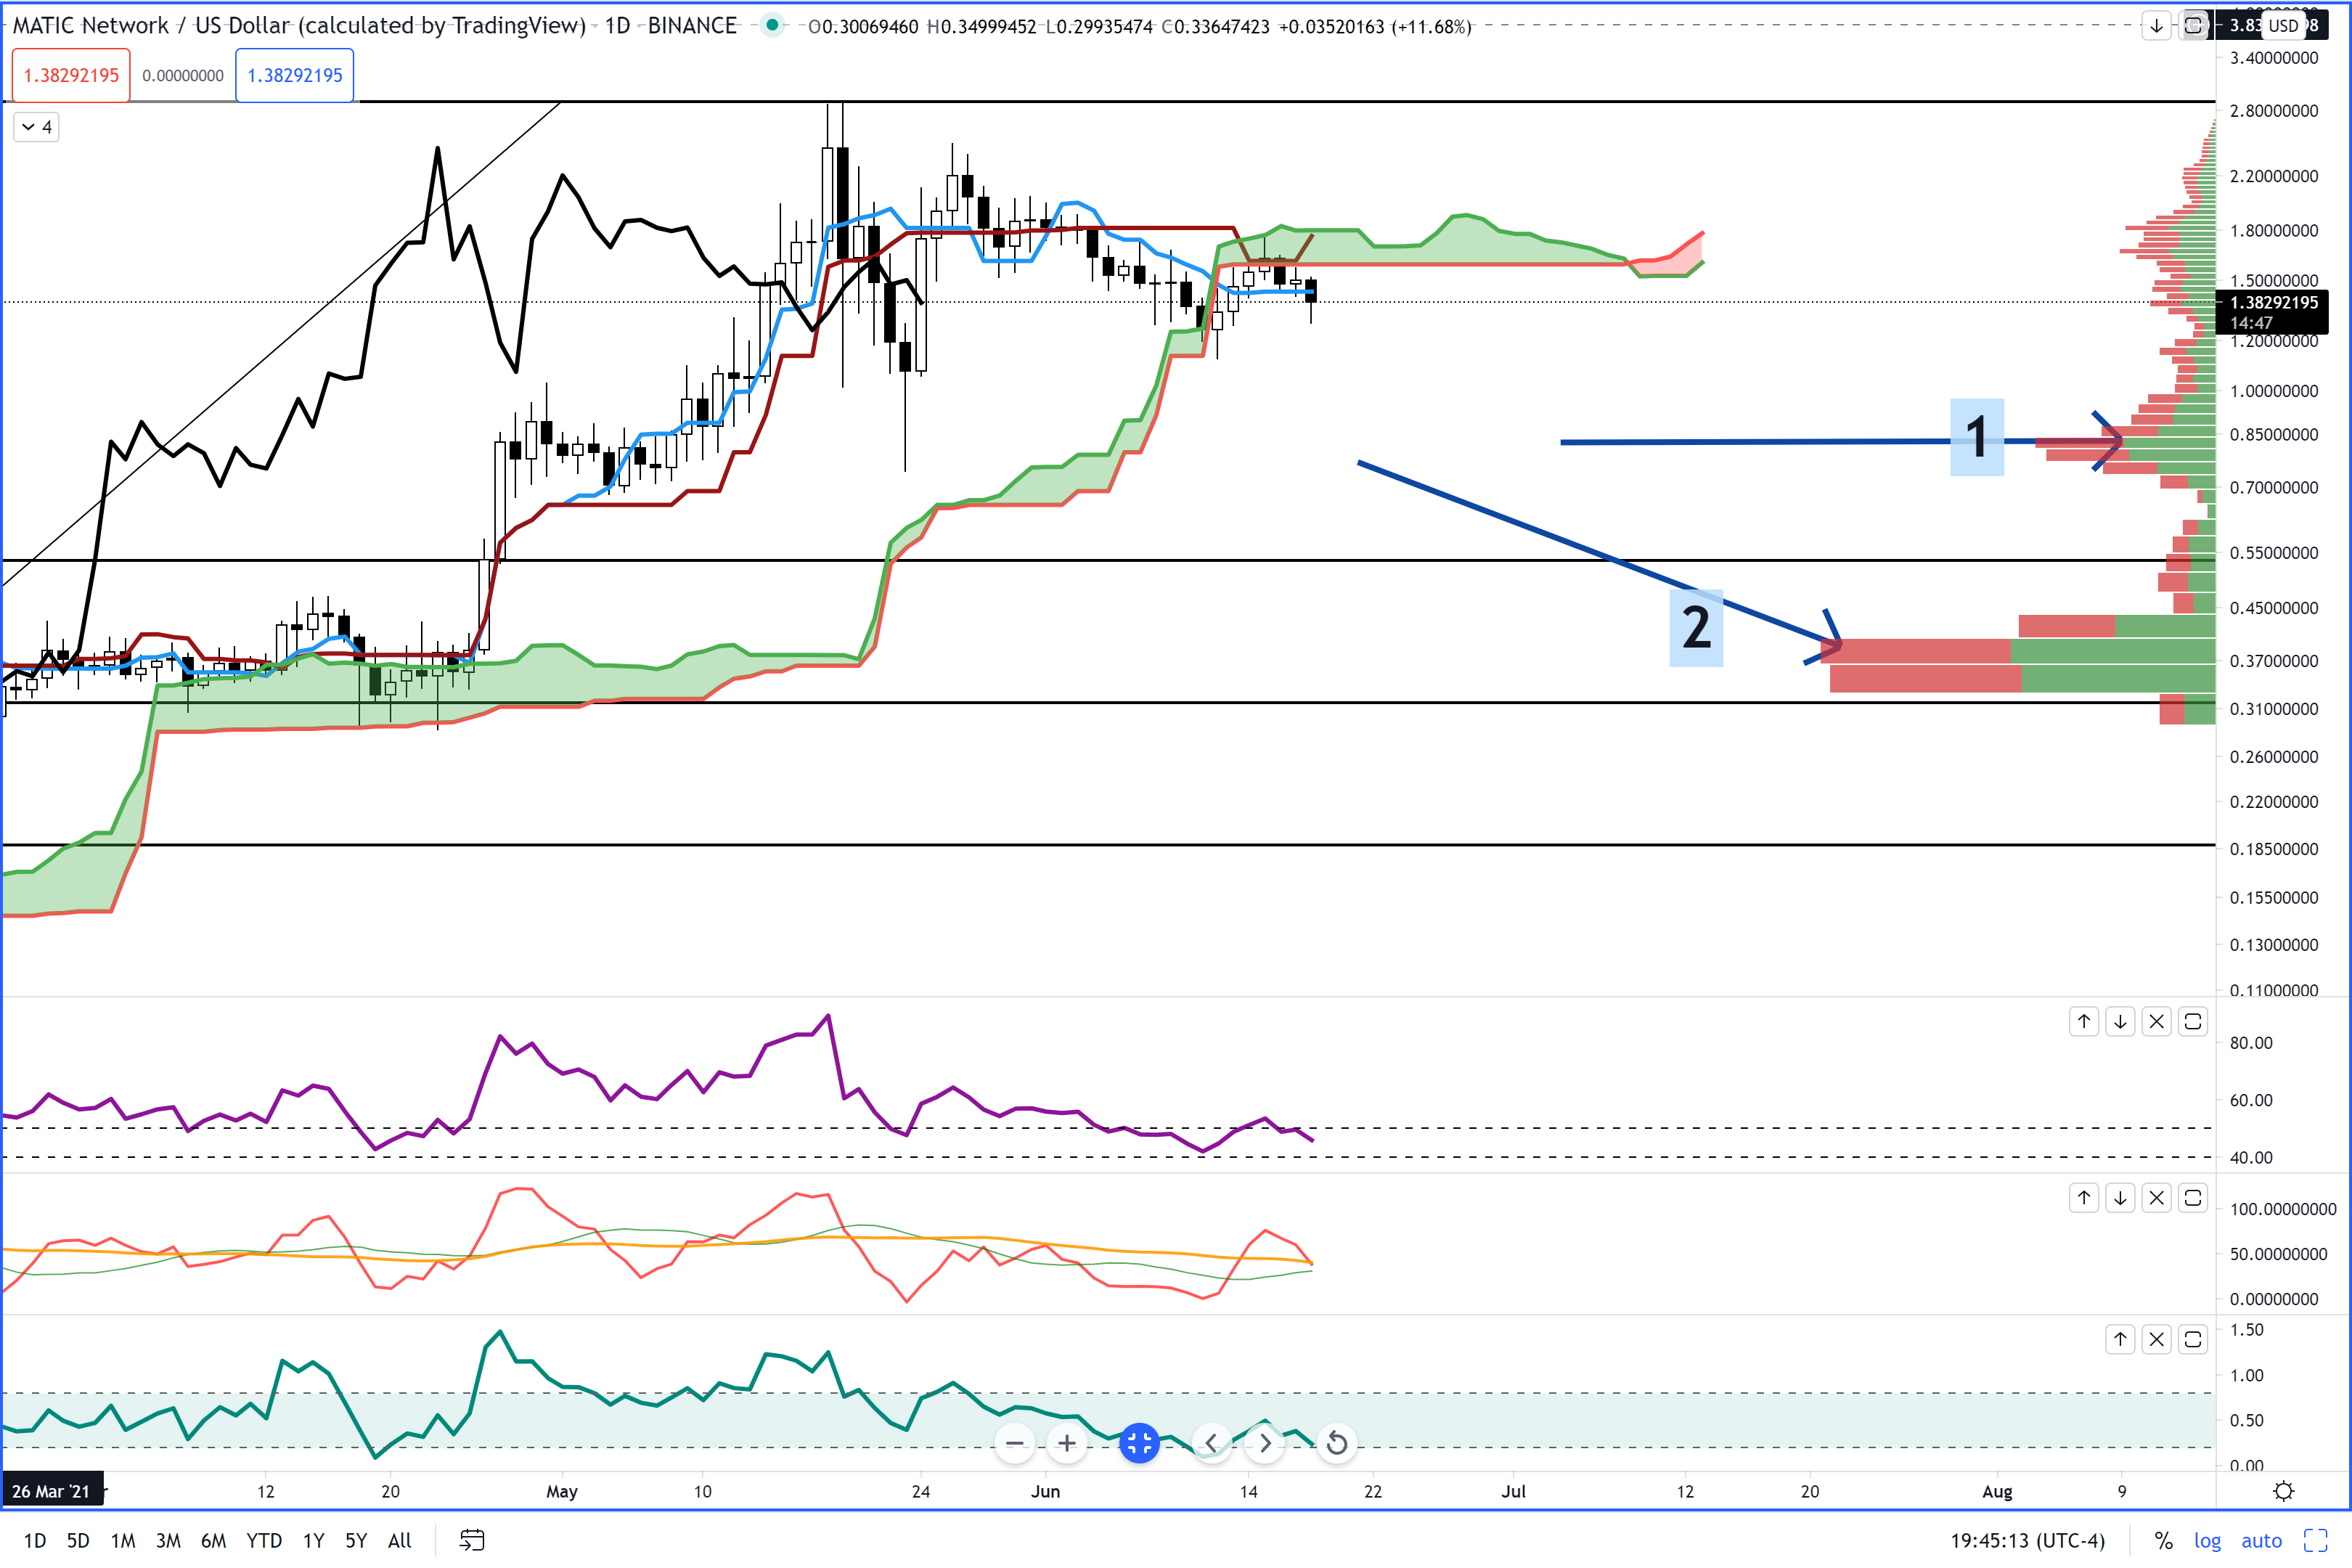
Polygon’s daily chart shows impending weakness and short pressure ahead. The Composite Index is about to cross below its slow moving average. The %B is about to cross below 0.2 and the RSI remains above 40 – meaning any breakdown on the price chart will be sustained. The levels I’ve identified as primary support zones have not changed much the last couple weeks. The first at #1 is the 0.80 zone. The high volume node is the primary reason I expect some support to be found there. At #2 is the 0.37 level. The 0.37 level is represented by the VPOC (Volume Point of Control) and the 50% Fibonacci Retracement.
Cardano (ADAUSD)
Above: Cardano (ADAUSD) Chart
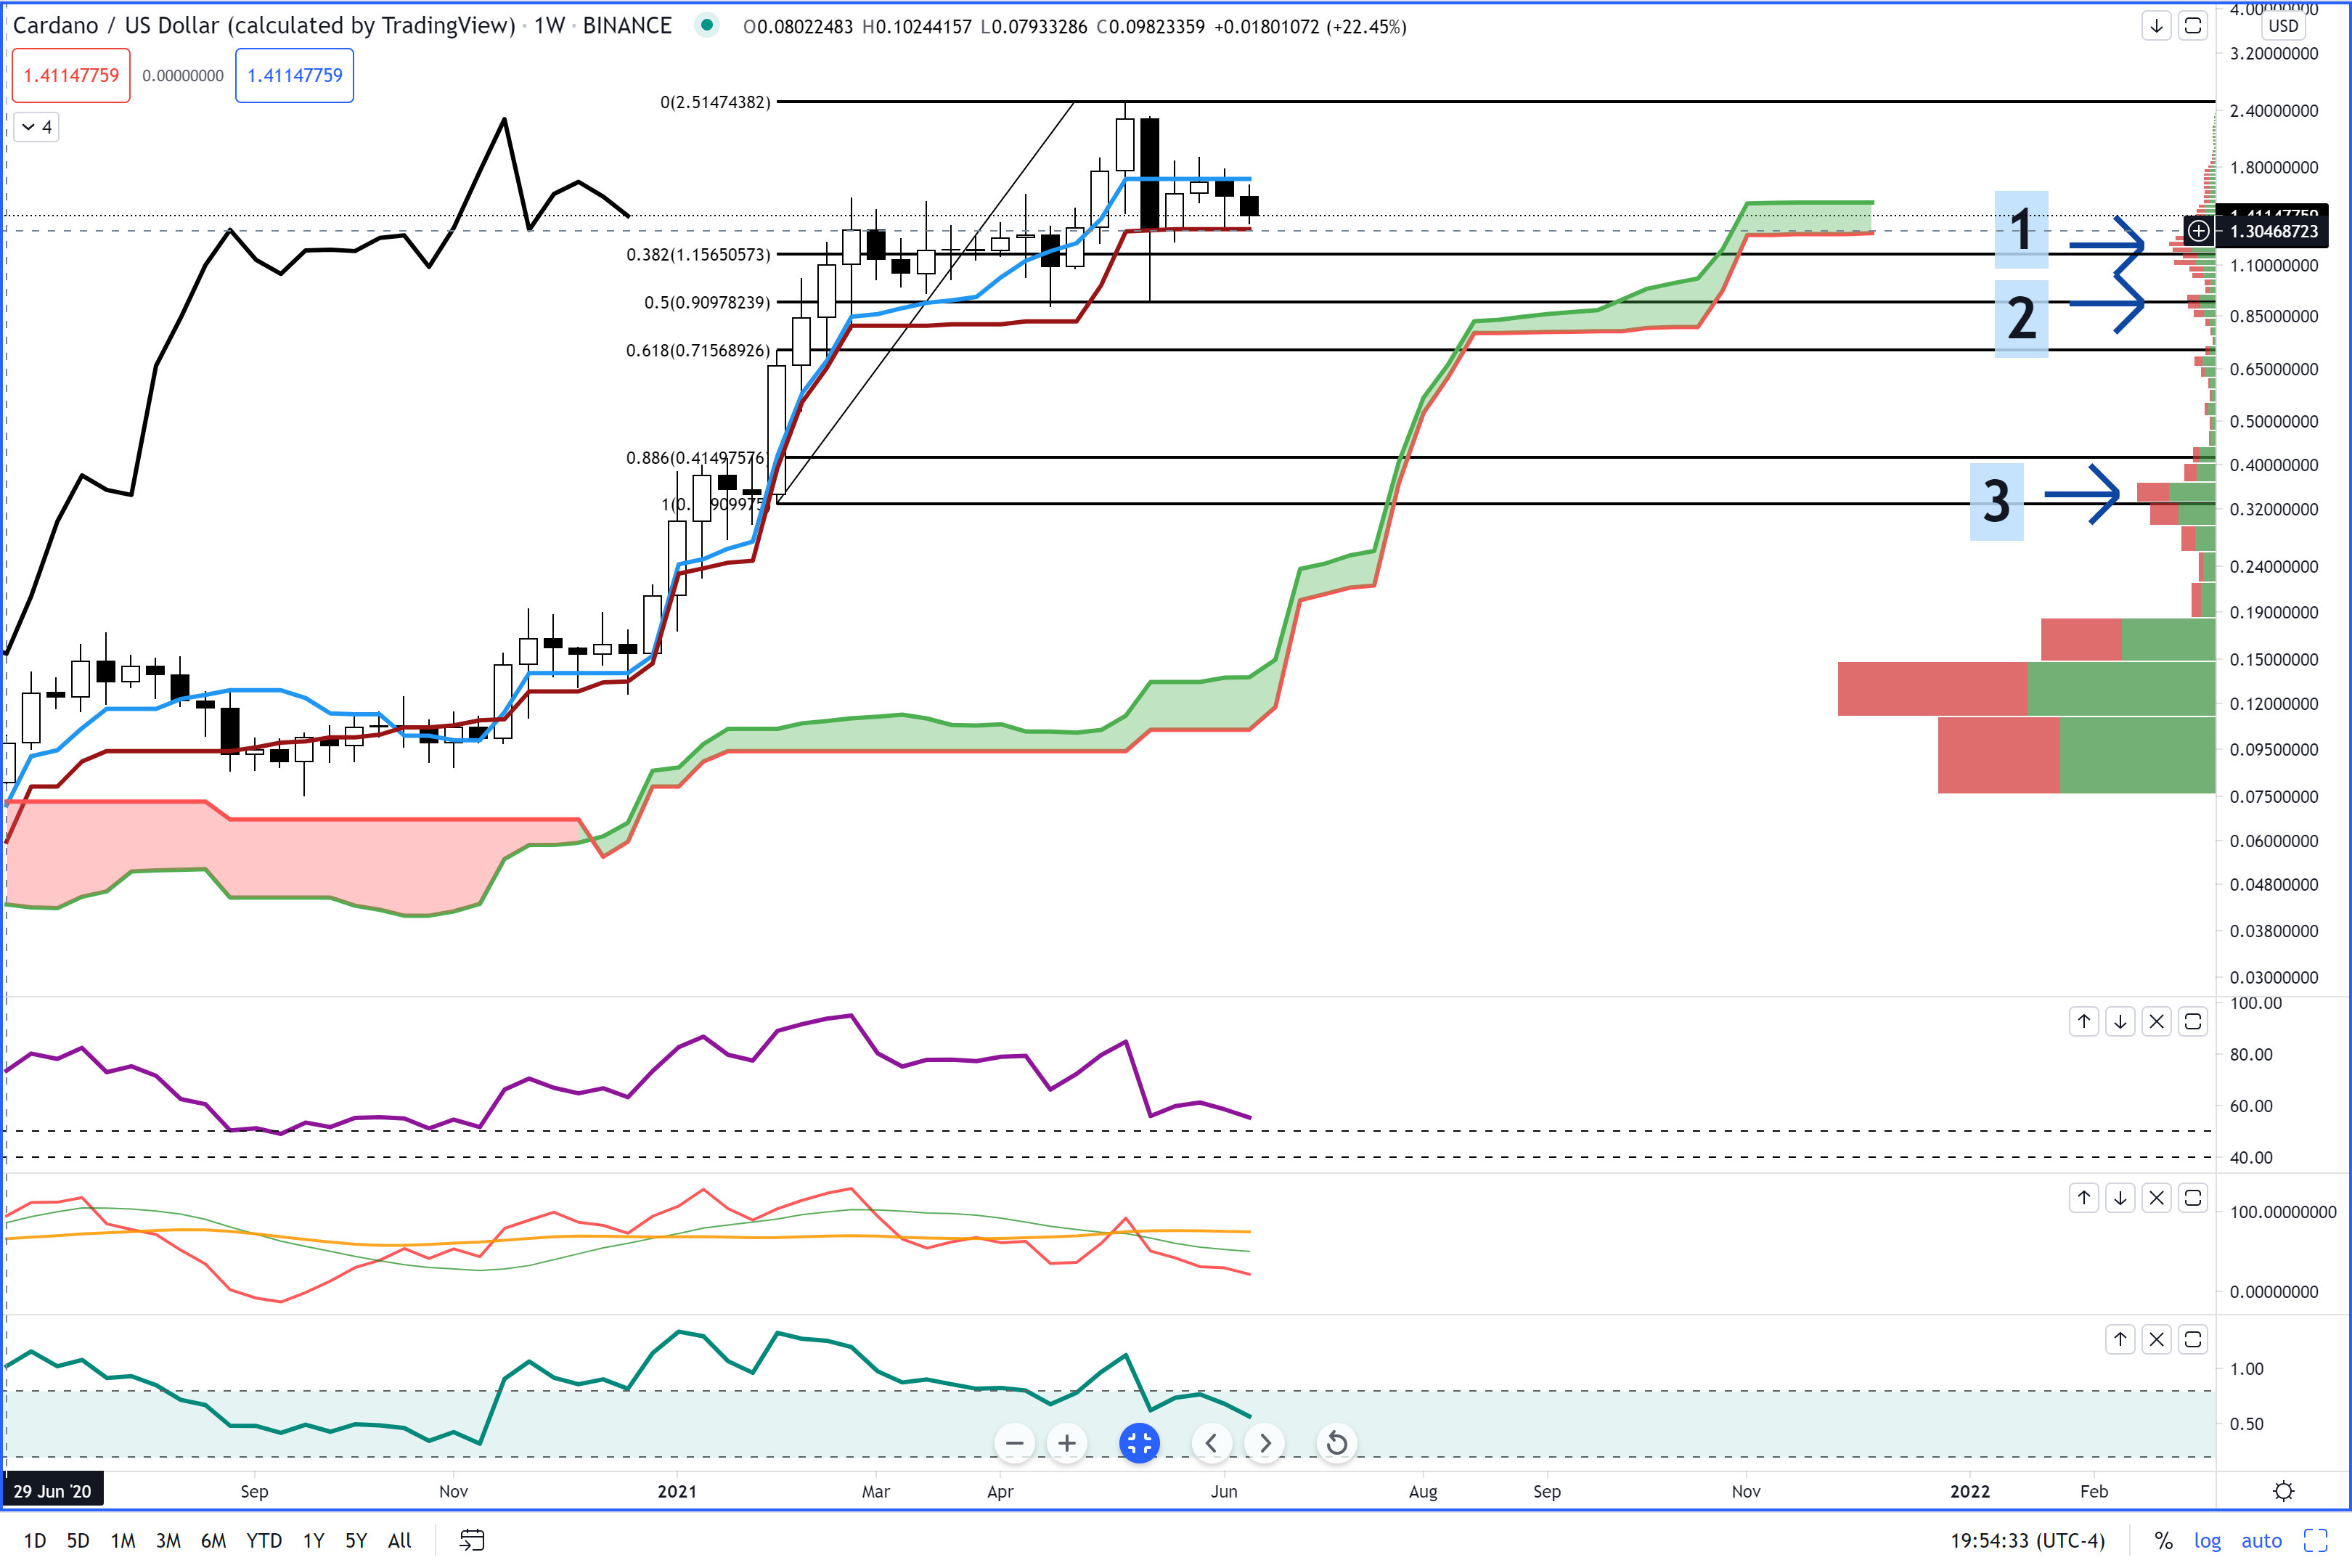
Cardano continues to consolidate between the weekly Tenkan-Sen and Kijun-Sen. All three of the primary support levels I’ve identified correspond with a high volume node and important Fibonnaci Retracement levels. The first near term support is at the 1.20 level (38.2% Fibonacci Retracement). The second support level is a kind of ‘sneaky’ support level between 0.84 and 0.94. I say sneaky because the amount of time that Cardano has spent in the #2 zone relative to the size of the high volume node is very small. The prior times 0.84 – 0.94 has been tested have been few, but the response has been heavy. Finally, at #3, the second highest high volume node at the 100% Retracement Level.
Advertisement
Save money on your currency transfers with TorFX, voted International Money Transfer Provider of the Year 2016 – 2020. Their goal is to connect clients with ultra competitive exchange rates and a uniquely dedicated service whether they choose to trade online or over the telephone.
Find out more here.