
XRP/USD – Bulls Battles With Bearish .5 Fib Resistance
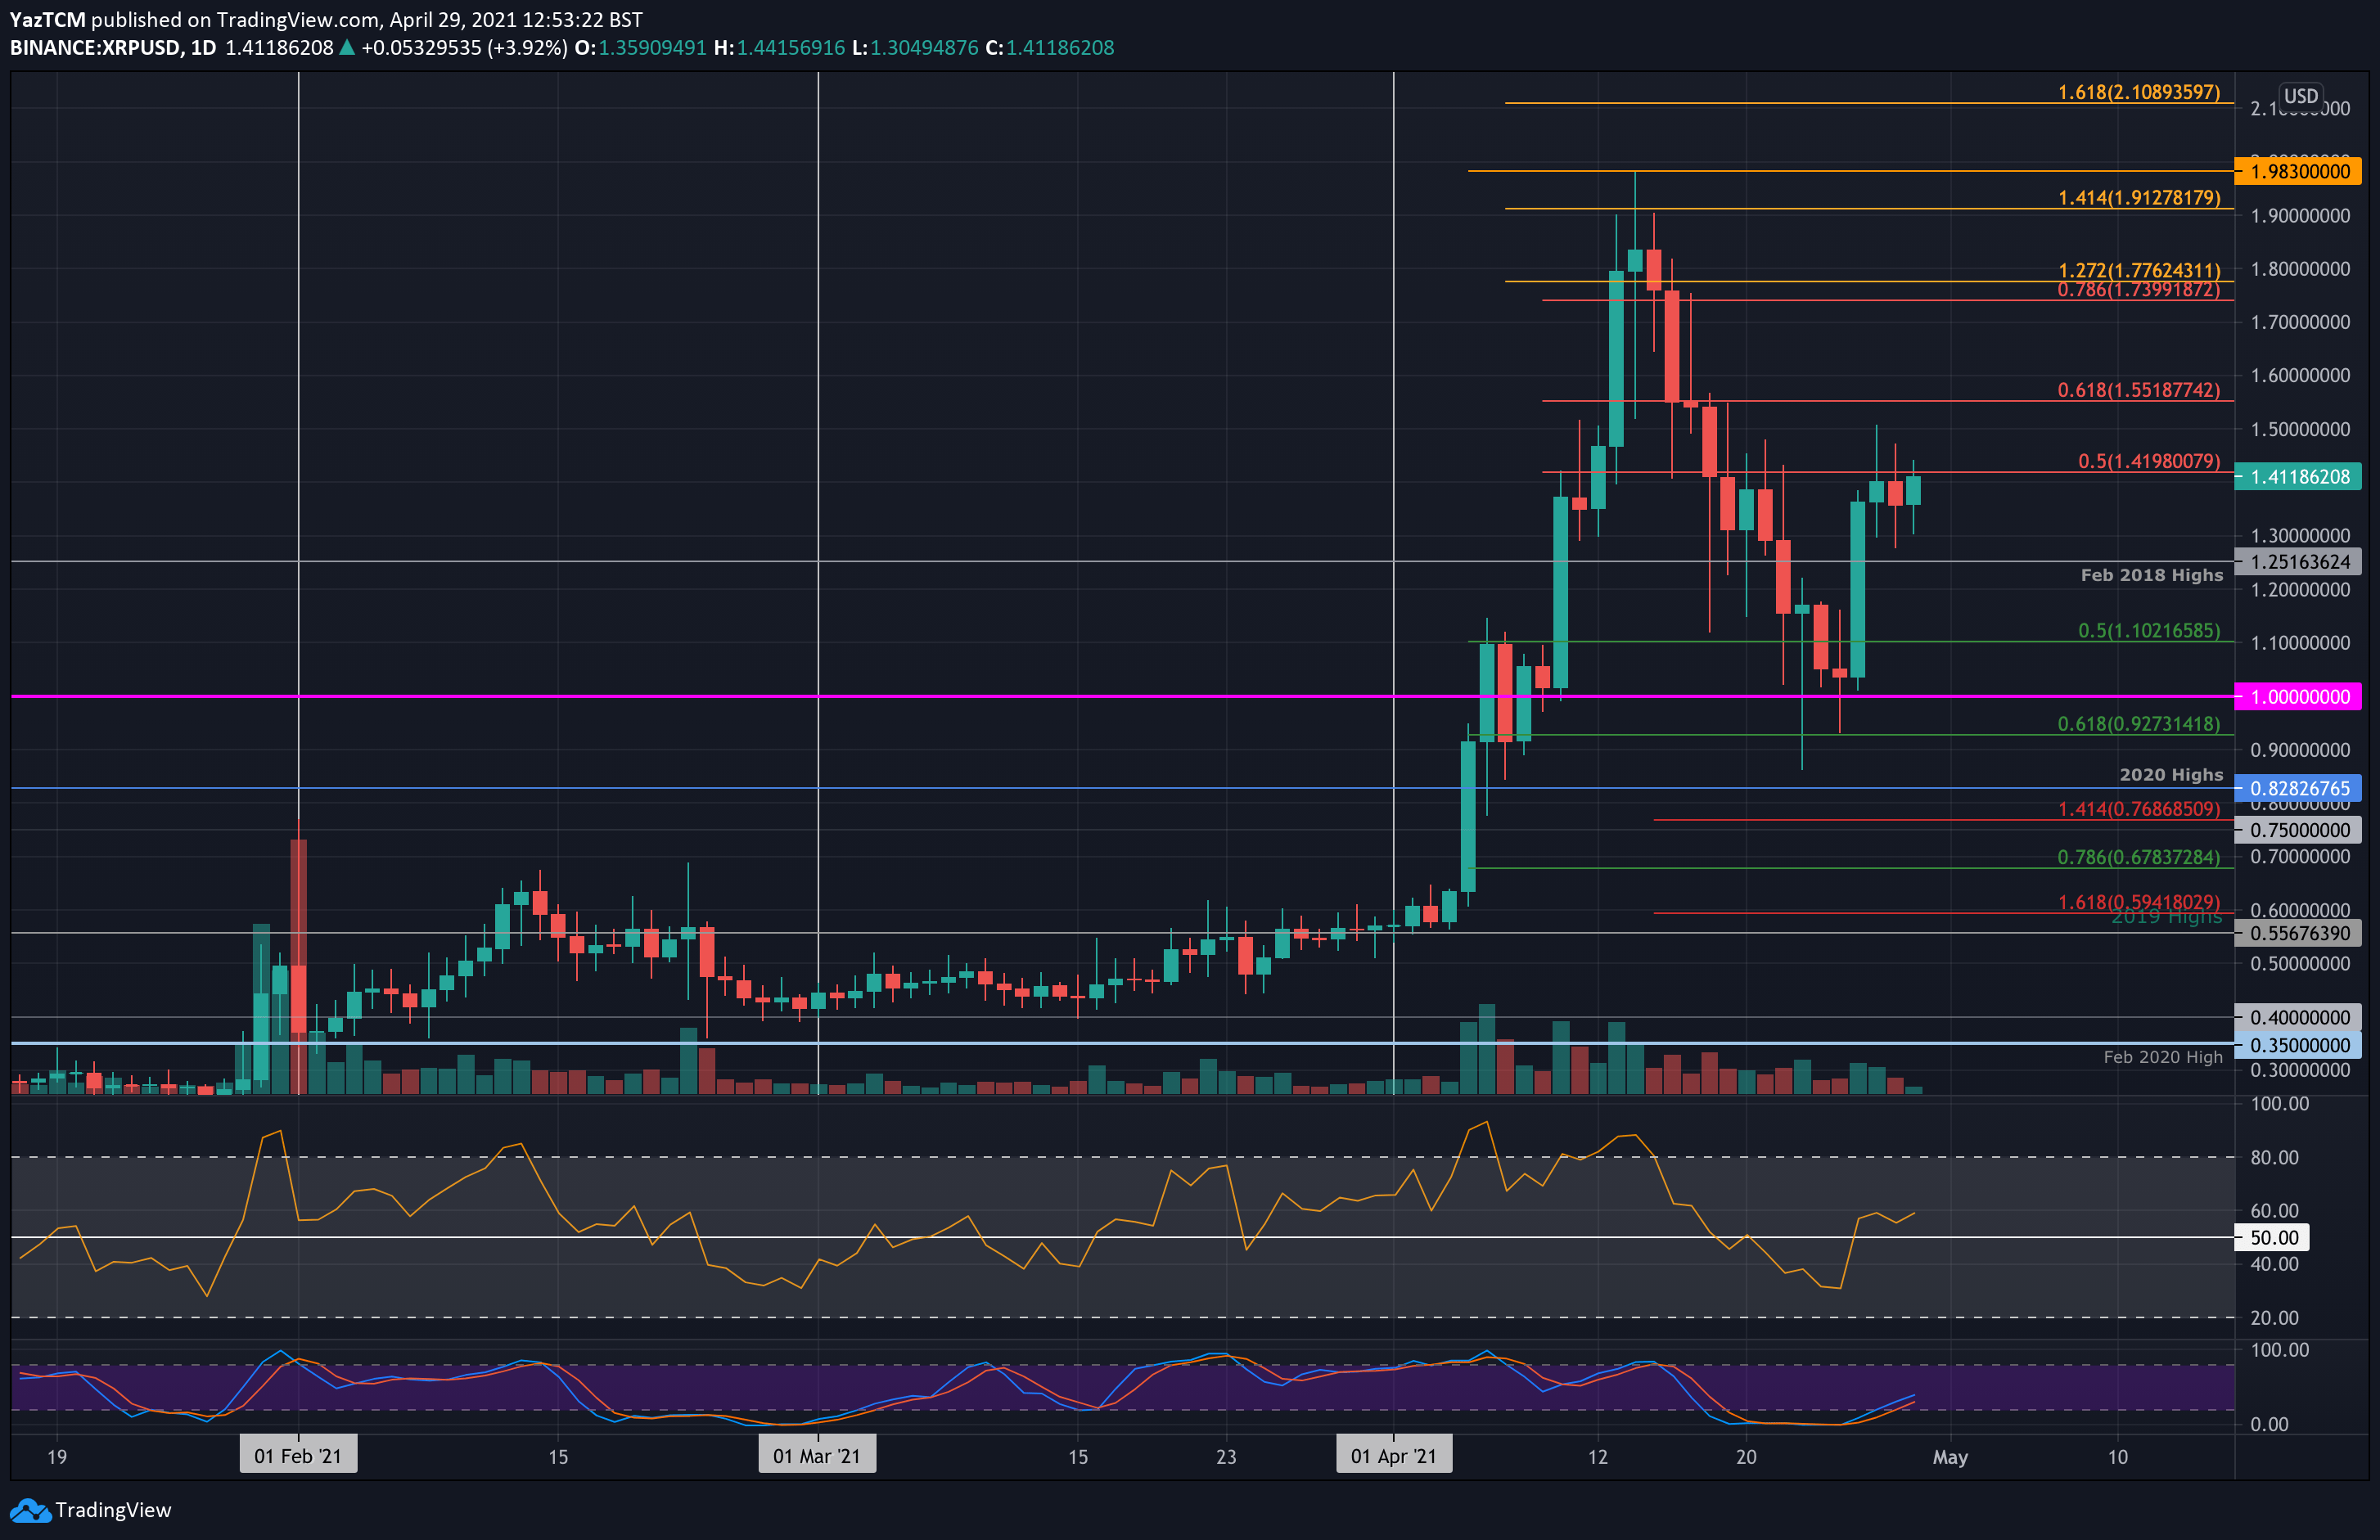
Key Support Levels: $1.30, $1.25, $1.10.
Key Resistance Levels: $1.42, $1.50, $1.55.
XRP is up by a solid 8% this week as it starts to recover from the downtrend seen over the previous fortnight. The cryptocurrency found support at $1.00 on Monday and started to surge higher from there, spiking to $1.50 on Tuesday.
Over the past couple of days, XRP struggled to close a daily candle above resistance at $1.42. This is provided by a bearish .5 Fib Retracement from the previous downtrend over the past fortnight. A breakout and daily closing candle above this resistance would be needed for XRP to continue back to the April highs again.
XRP-USD Short Term Price Prediction
Looking ahead, once the bulls break $1.42, the first resistance lies at $1.50. This is closely followed by $1.55 (bearish .618 Fib), $1.74 (bearish .786 Fib), and $1.82 (April High-day closing price).
On the other side, the first support lies at $1.30. This is followed by $1.25 (Feb 2018 highs), $1.20, $1.10 (.5 Fib), and $1.00.
The RSI has bounced back above the midline as the buyers take control of the market momentum again. It is currently battling to create a higher high above 60, which should allow XRP to break above the $1.42 resistance.
XRP/BTC – Bulls Heading back Toward 3000 SAT
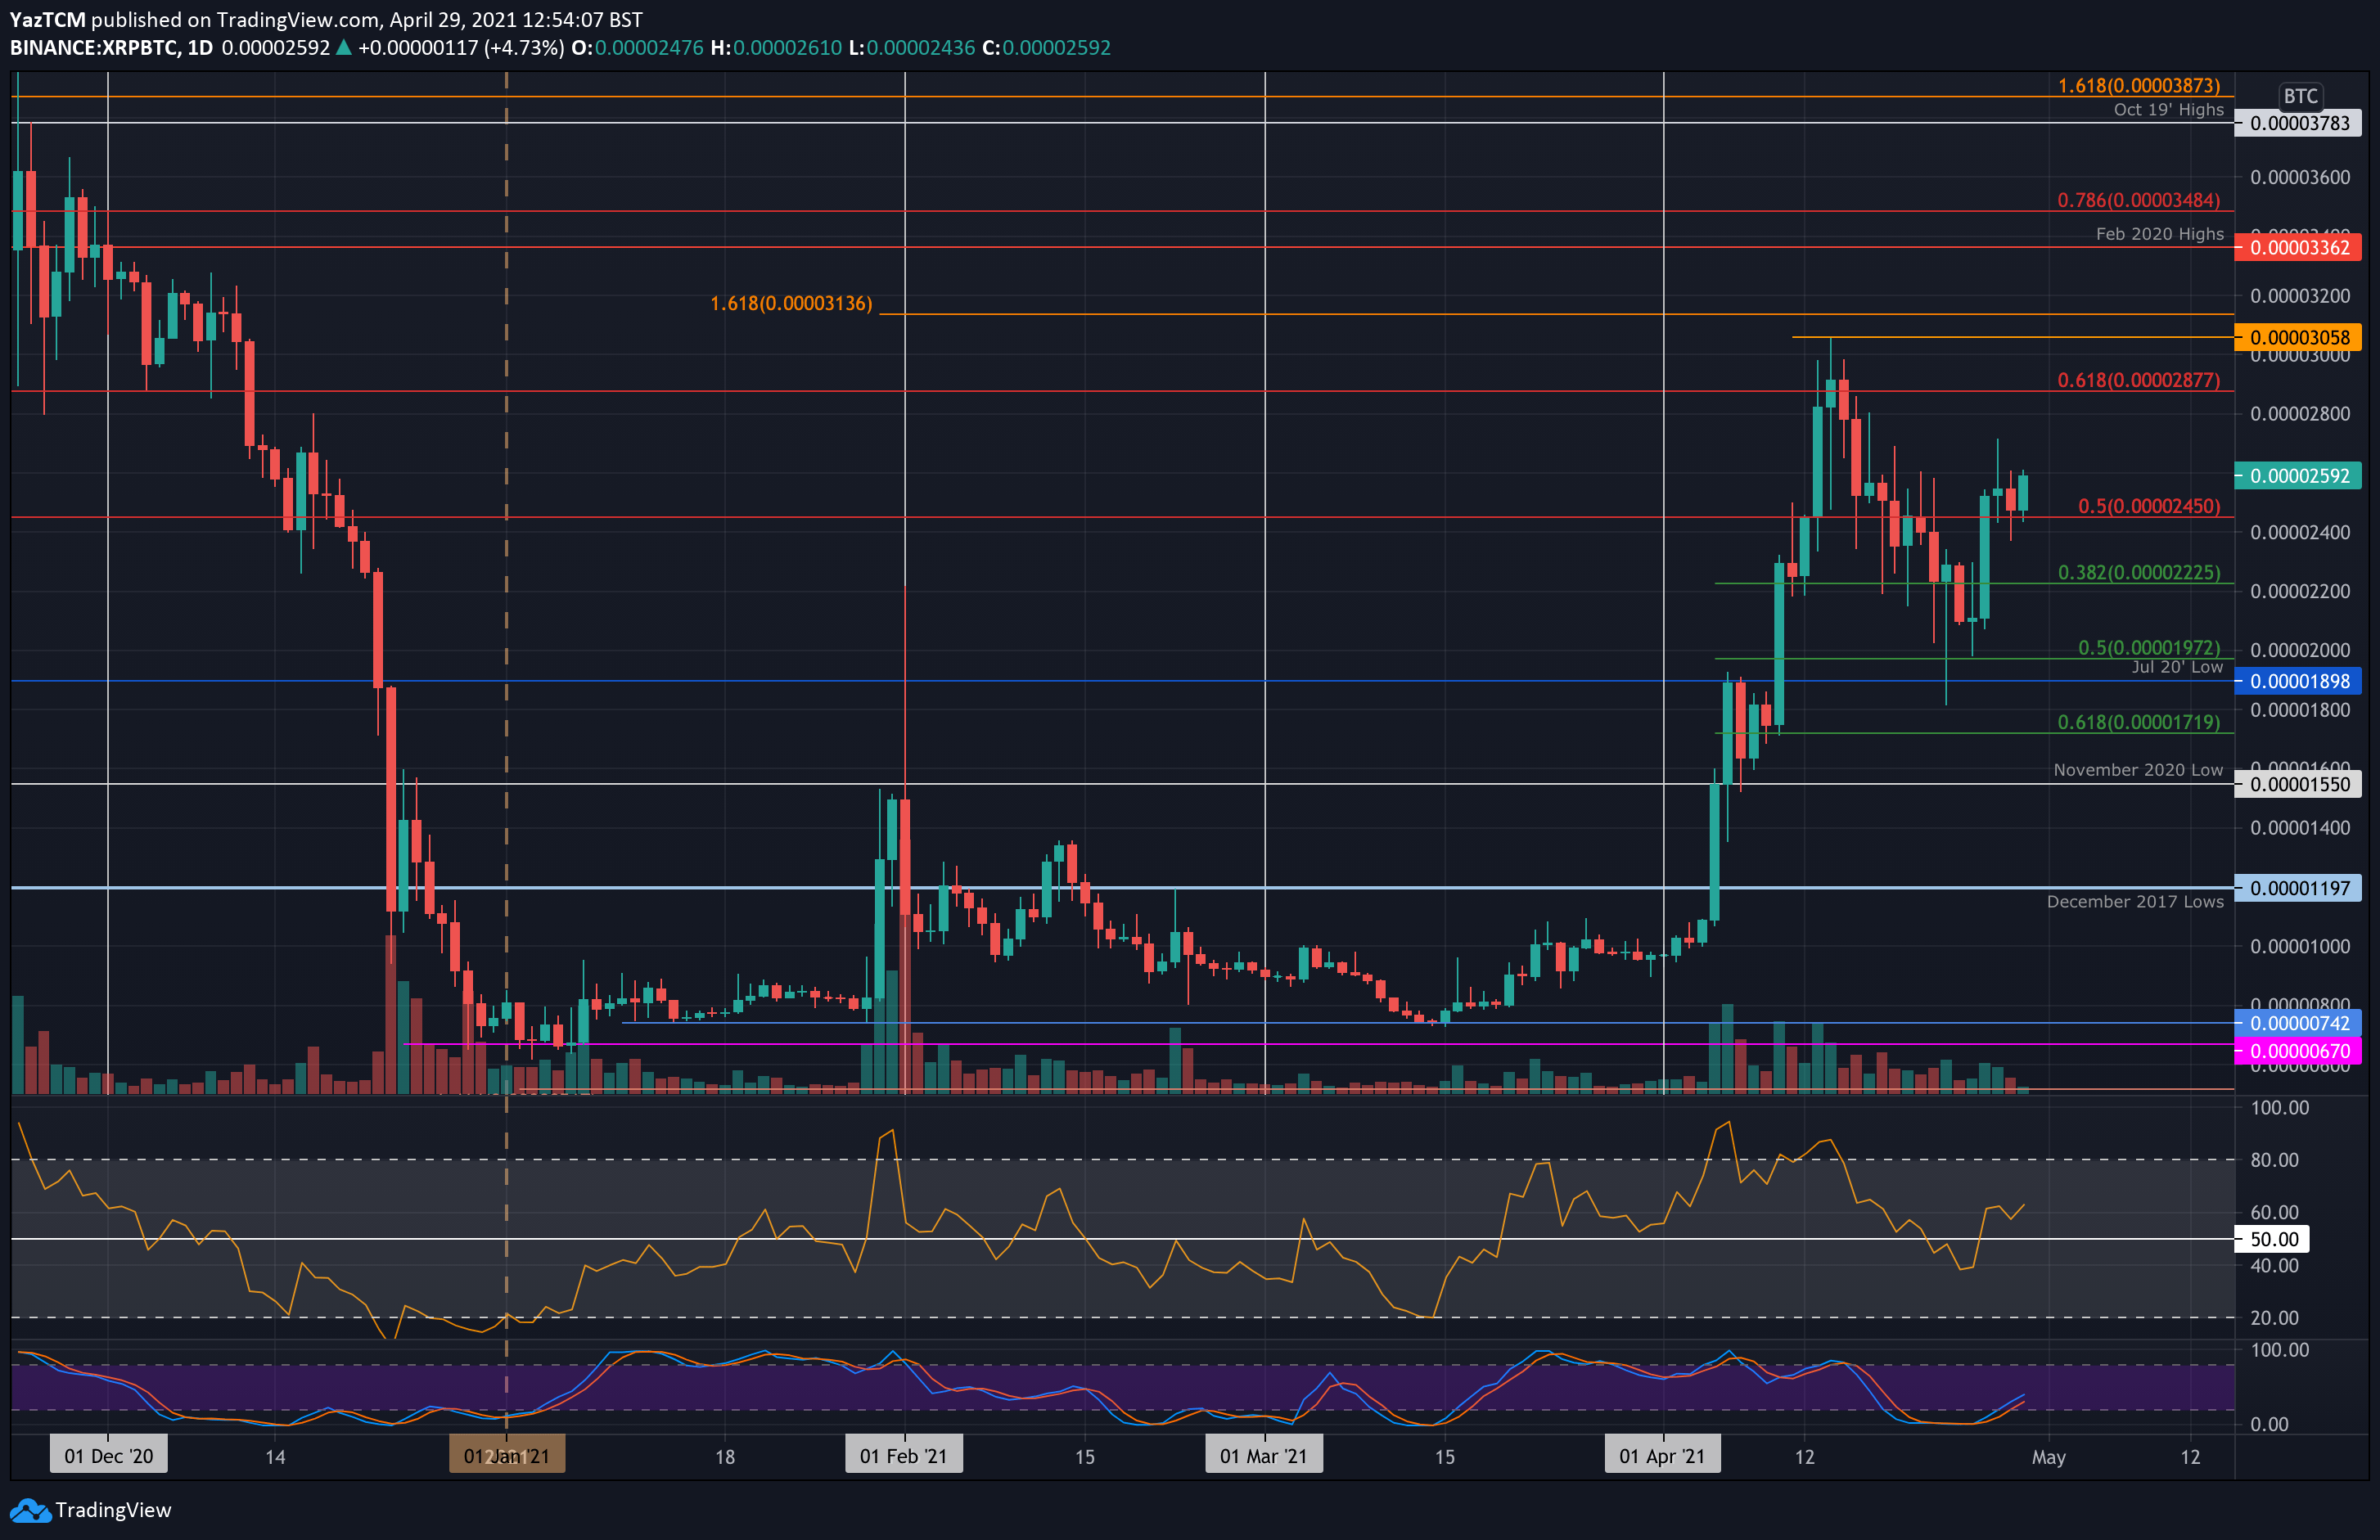
Key Support Levels: 2450 SAT, 2225 SAT, 2000 SAT.
Key Resistance Levels: 2600 SAT, 2877 SAT, 3058 SAT.
XRP also managed to rebound from 2000 SAT at the start of the week against bitcoin. The cryptocurrency had set a new 2021 high at 3058 SAT during mid-April but has been in an extended downtrend until finding the support at 1972 SAT (.5 Fib) on Sunday.
Since rebounding, XRP managed to break above the resistance at 2450 SAT (bearish .5 Fib) as it looks to break 2600 SAT next.
XRP-BTC Short Term Price Prediction
Looking ahead, the first resistance above 2600 SAT lies at 2877 SAT (bearish .618 Fib). This is followed by 3058 SAT (April highs), 3362 SAT (Feb 2020 highs), and 3485 SAT (bearish .786 Fib).
On the other side, the first support lies at 2450 SAT. This is followed by 2225 SAT (.382 Fib), 2000 SAT, and 1900 SAT (July 2020 low).
Likewise, the RSI managed to rebound above the midline to indicate the buyers are back in control of the market momentum. Additionally, the Stochastic RSI also produced a bullish crossover signal to indicate increased buying pressure.
Binance Futures 50 USDT FREE Voucher: Use this link to register & get 10% off fees and 50 USDT when trading 500 USDT (limited offer).
PrimeXBT Special Offer: Use this link to register & enter POTATO50 code to get 50% free bonus on any deposit up to 1 BTC.
Disclaimer: Information found on CryptoPotato is those of writers quoted. It does not represent the opinions of CryptoPotato on whether to buy, sell, or hold any investments. You are advised to conduct your own research before making any investment decisions. Use provided information at your own risk. See Disclaimer for more information.
Cryptocurrency charts by TradingView.