
- Monero price rally now heading near the final supply or resistance zone, which is the all-time highs of the year 2017
- The coin is under the control of bulls, and is it successfully trading above all moving averages (MA) of 20,50,100 and 200-Day
- The pair of XMP/BTC at the time of writing is trading positive with minor intraday gains of +0.17%, standing at 0.007283 BTC
Monero price over the yearly chart is now reaching the final supply or resistance band of $420-$500. Since the coin faced multiple rejections from this zone and break out of this band will create a massive rally. Moreover, XMR successfully trades above all exponential moving averages (EMA) of 20,50,100 and 200-Day. At the same time, good volume traction supports the massive rally of the year 202. Since the coin looks overbought, we can observe a short-term correction from current levels. So, short-term retracement or correction is required for suppressing the highs of 2017, which is also healthier for XMR. Likewise, support on the lower side is $300 and $210, whereas resistance is $440 and $500.
Daily Chart is At Critical levels
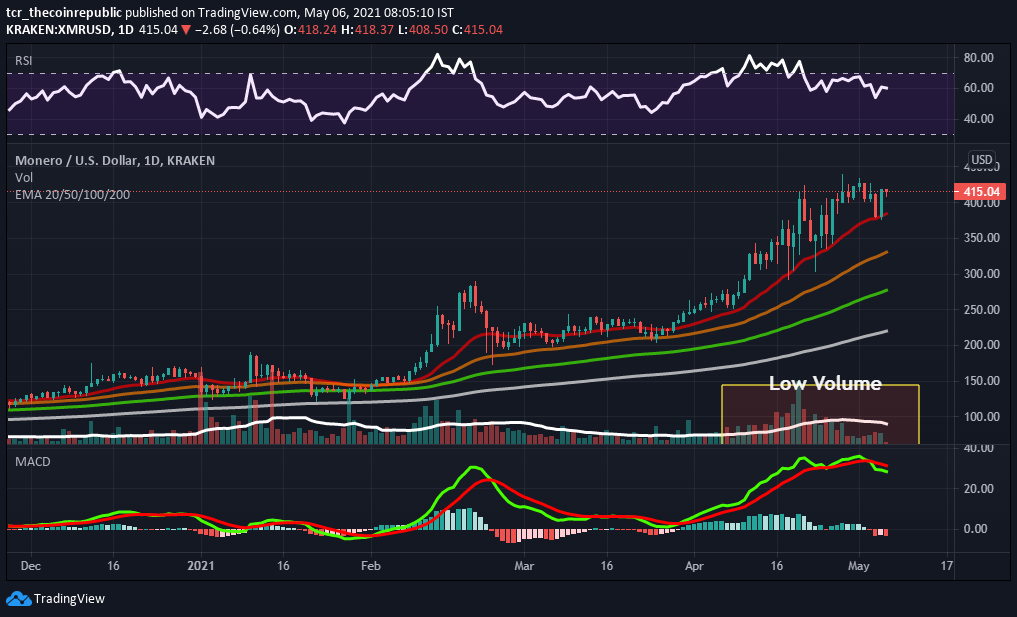
The daily chart of Monero price has projected some tiredness at the present level, and volume indicates some caution. Since on the daily chart, which needs to increase. While EMA of 20-Day is continuously acting like a trend line or support line for the coin, we can see a fall if it fails to hold. Whereas the EMA of 50 and 100-Day will give good support to the coin, likewise support for a short term is $370 and $325. In contrast, resistance is at $440 and $480.
Relative Strength Index (CAUTION) indicates bearish momentum while heading towards the oversold zone at 59.62. However, XMR can observe a correction in the upcoming trading session.
Moving Average Convergence Divergence (CAUTION) currently indicates a bearish trend on the daily chart. It is trading with the significance of the seller’s line (red) over the buyer’s signal line (green).
Support levels: $300 and $210
Resistance levels: $440 and $500.