
- XRP is down by 0.32% and faces difficulty to remain above 1.00 $
- Forms an Ascending Trend Line on 2 hour Time Frame
- The pair of XRP/BTC is trading negative with a loss of -0.31%, standing at 0.00002569 BTC
Price getting holds off, taking Resistance from the 100 Exponential Moving Average. However, the price is making higher lows at the moment, gaining a Bullish momentum. The price has to break Level 1.0754 $ to have a good Bullish
rally till a target of about 1.15 $ to 1.20 $. If it doesn’t break, it is most likely to move in range.
Forming an Ascending Triangle pattern, with a small Bullish Trend
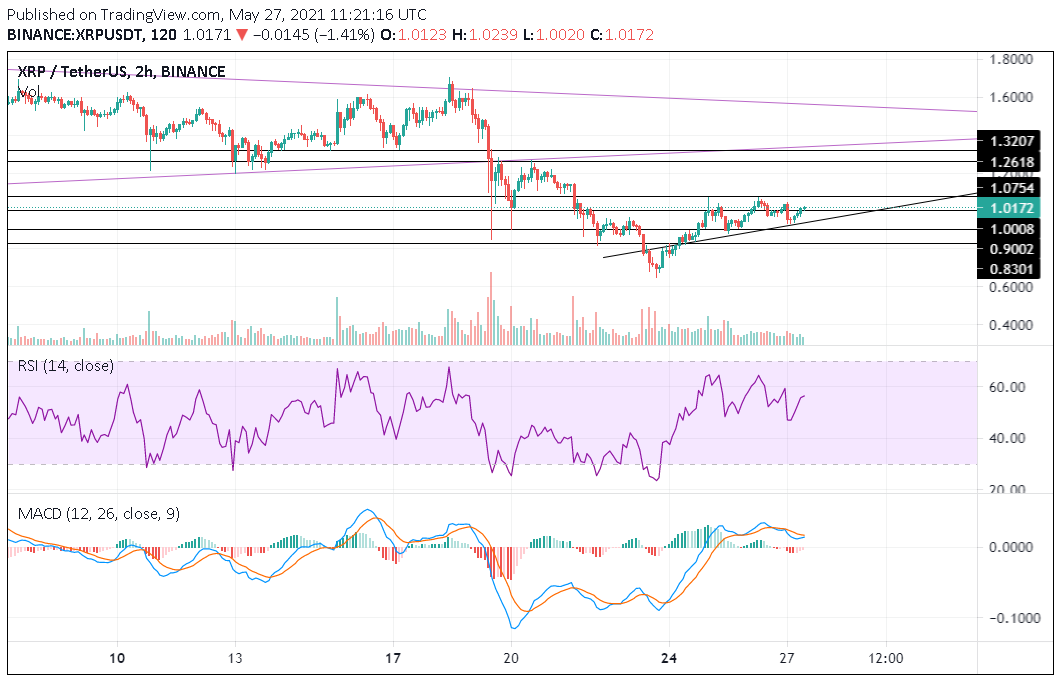
RSI, Relative Strength Index is at around 56.80, which is above the midline by a good extent. The coin is still not overbought, but if in case the value goes above 60 / 62 then there can be chances of a downtrend because of overbuying of the coin.
MACD, Moving Average Convergence Divergence, is showing positive indications at a value of 0.003.
The Blue Line (Buyer’s Line) is about to cross over the Orange Line (Seller’s Line), giving a positive crossover and signs of Bullish Trend.
Support Levels – $ 0.83, $ 0.90 and $ 1.00
Resistance Levels – $ 1.00, $ 1.07, $ 1.26, $ 1.32