
- Litecoin price from a new 52-week high of $335 witness a sharp selloff and now heding towards the important trend line
- Currently, LTC is trading below short term moving averages of 20 and 50, while holding 100 and 200-DMA
- The pair of LTC/BTC is trading at the level of 0.004583 BTC with an intraday loss of -3.50%
Litecoin price witness a massive sell-off or profit-taking from the past few days, as the price is in continuous in a downtrend after creating a new 52-week high ($335). Meanwhile, the overall trend is still bullish, and every dip is to be utilized as a buying opportunity; volume over the monthly chart is also good. However, now LTC reached a significant trend line, which must behold, and a positive bounce back is expected. After a sharp selloff, a new support zone is observed between $195-$205; likewise, the strong support can be considered $170. Similarly, on the higher side, resistance is situated at $255 and $335. A short-term pullback is expected after testing an important trend line on the higher side till $260 and $300.
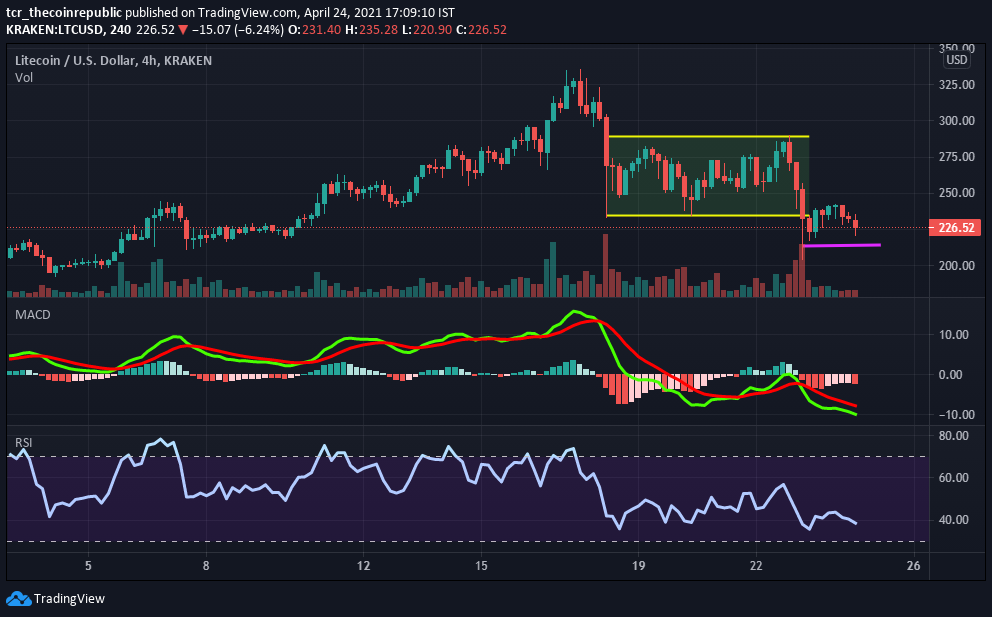
Litecoin price over the 4-hour time frame has given a breakdown from the channel pattern after a sharp fall from higher levels. In the current scenario, LTC seems to be in a strong grip on bears as it witnesses huge selling pressure at higher levels. simultaneously, a short-term pullback is expected from lower levels. Presently LTC is trading at the price levels of $225 with an intraday loss of -4.46%, and volume dropped nearly -53.30%, standing at $5,416,469,874. Likewise, the total market capitalization cuts over -4.78% standing at $14,987,063,966 on the 10th rank.
Relative Strength Index (BEARISH) indicates bearish momentum while trading at 38.62. However, LTC, after a sharp selloff is now trading flat over the indicators with no sign of major recovery.
Moving Average Convergence Divergence (BEARISH) currently indicates a bullish trend on the daily chart, as it is trading with the significance of the seller’s line (red) over the buyer’s signal line (green).
Support levels: $195-$205 and $170
Resistance levels: $255 and $335.