
- Litecoin price rally finally clears the resistance band of $355-$375, and now bulls are looking at the $500 mark
- After a most awaited breakout, LTC price trading above all major moving averages of 20, 50, 100 and 200-day
- The pair of BTC/LTC is trading with intraday gains of +17.53%, standing at 0.006971 BTC
Litecoin price over the yearly chart is trading on strong bullish momentum, as the coin has broken the previous all-time high of $375. While good volume traction is experiencing in this bull run, similarly, the coin is now looking for aggressive targets of $470 to $550 in a very shorter time frame. Similarly, all the technical parameters give confidence to bulls, and a massive rally is expected. At the same time, LTC is trading above all major moving averages of 20, 50, 100, and 200-day. Support on the yearly chart is at $310 and $250, whereas levels of $490 and $540 can act as resistance. Whereas the pair of BTC/LTC also projects a strong rally, the pair broke out from the corrective pattern.
Bullish Chart Pattern at Monthly Time Frame
Litecoin over the monthly chart is trading on extremely bullish momentum while forming higher highs and lower lows sequence. Similarly, LTC is trading with the formation of a rising trend line which is also acting as a support line. Moreover, all the technical parameters favor bulls, and volume activity is also favorable to bulls. Presently, the coin is trading above all moving averages of 20, 50, 100, and 200-day, while 20 and 50-SMA are acting as shorter-term support. Support on the monthly chart is at $330 and $270. Similarly, resistance on the higher side is at $448 and $498 since LTC looks quite overbought, so some intraday or short-term correction is required, which is healthier for another positive momentum. while overall long term trend is strongly bullish and every dip is used as buying opportunity.
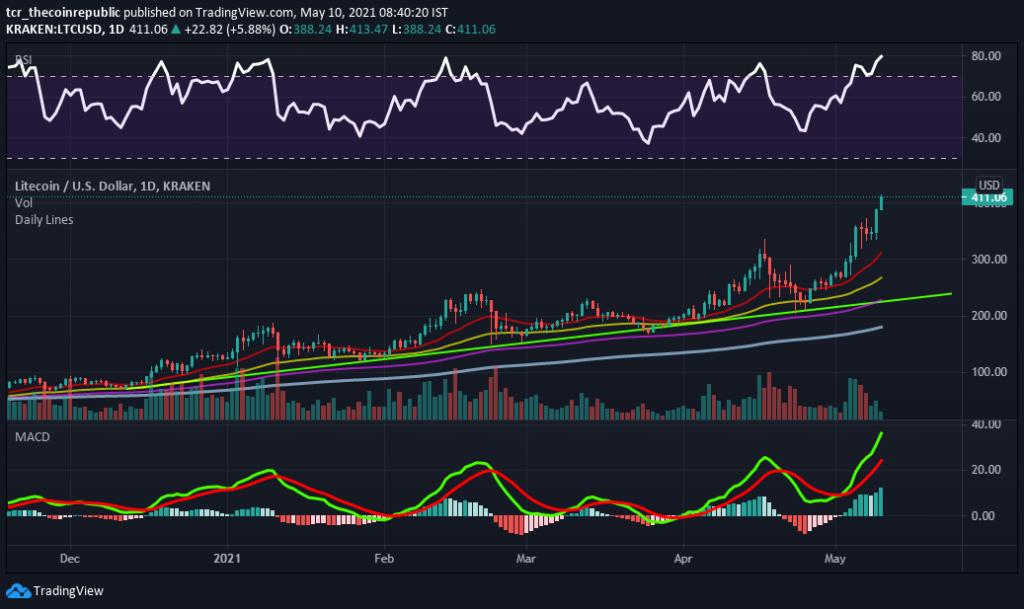
Relative Strength Index (BULLISH) indicates strong bullish momentum while trading at 78.62. However, after a sharp rally, LTC is now trading under the overbought region, and LTC can see a short-term retracement.
Moving Average Convergence Divergence (BULLISH) currently indicates a bullish trend on the daily chart, as it is trading with the significance of the buyer’s signal line (green) over the seller’s line (red).
Support levels: $310 and $250
Resistance levels: $490 and $540