
- Litecoin price is on the rise after breaching a temporary swing high at $243.
- A successful move out of the 3-day demand zone suggests a spike to $284.
- On-chain metrics add a tailwind to this scenario, extending buyers’ target to $335.
Litecoin price is showing signs of life after taking a massive blow during the recent market crashes.
Litecoin price on precipice of upswing
On the 4-hour chart, Litecoin price shows a swift move above a recent swing high at $243. This climb is bullish since it coincides with the 3-day demand zone that ranges from $211 to $243
Hence, investors can expect LTC to ascend 12% to the 50% Fibonacci retracement level at $284. A decisive close above this barrier will confirm the buying pressure and might propel Litecoin price by an additional 17% to $335.
The Momentum Reversal Indicator’s (MRI) recently flashed ‘cycle top’ signal in the form of a red ‘one’ candlestick suggests that a retracement is near. Investors can expect a reentry of LTC into the aforementioned support zone since this setup forecasts a one-to-four candlestick correction.
However, this pullback will be a short-term play and should not affect the bullish momentum.
LTC/USD 4-hour chart
Agreeing with the technical perspective is the supply distribution of Litecoin, which shows that investors holding between 10,000 to 100,000 LTC have increased from 421 to 435. This 3.3% increase indicates that these market participants are optimistic about the bullish outlook on Litecoin price.
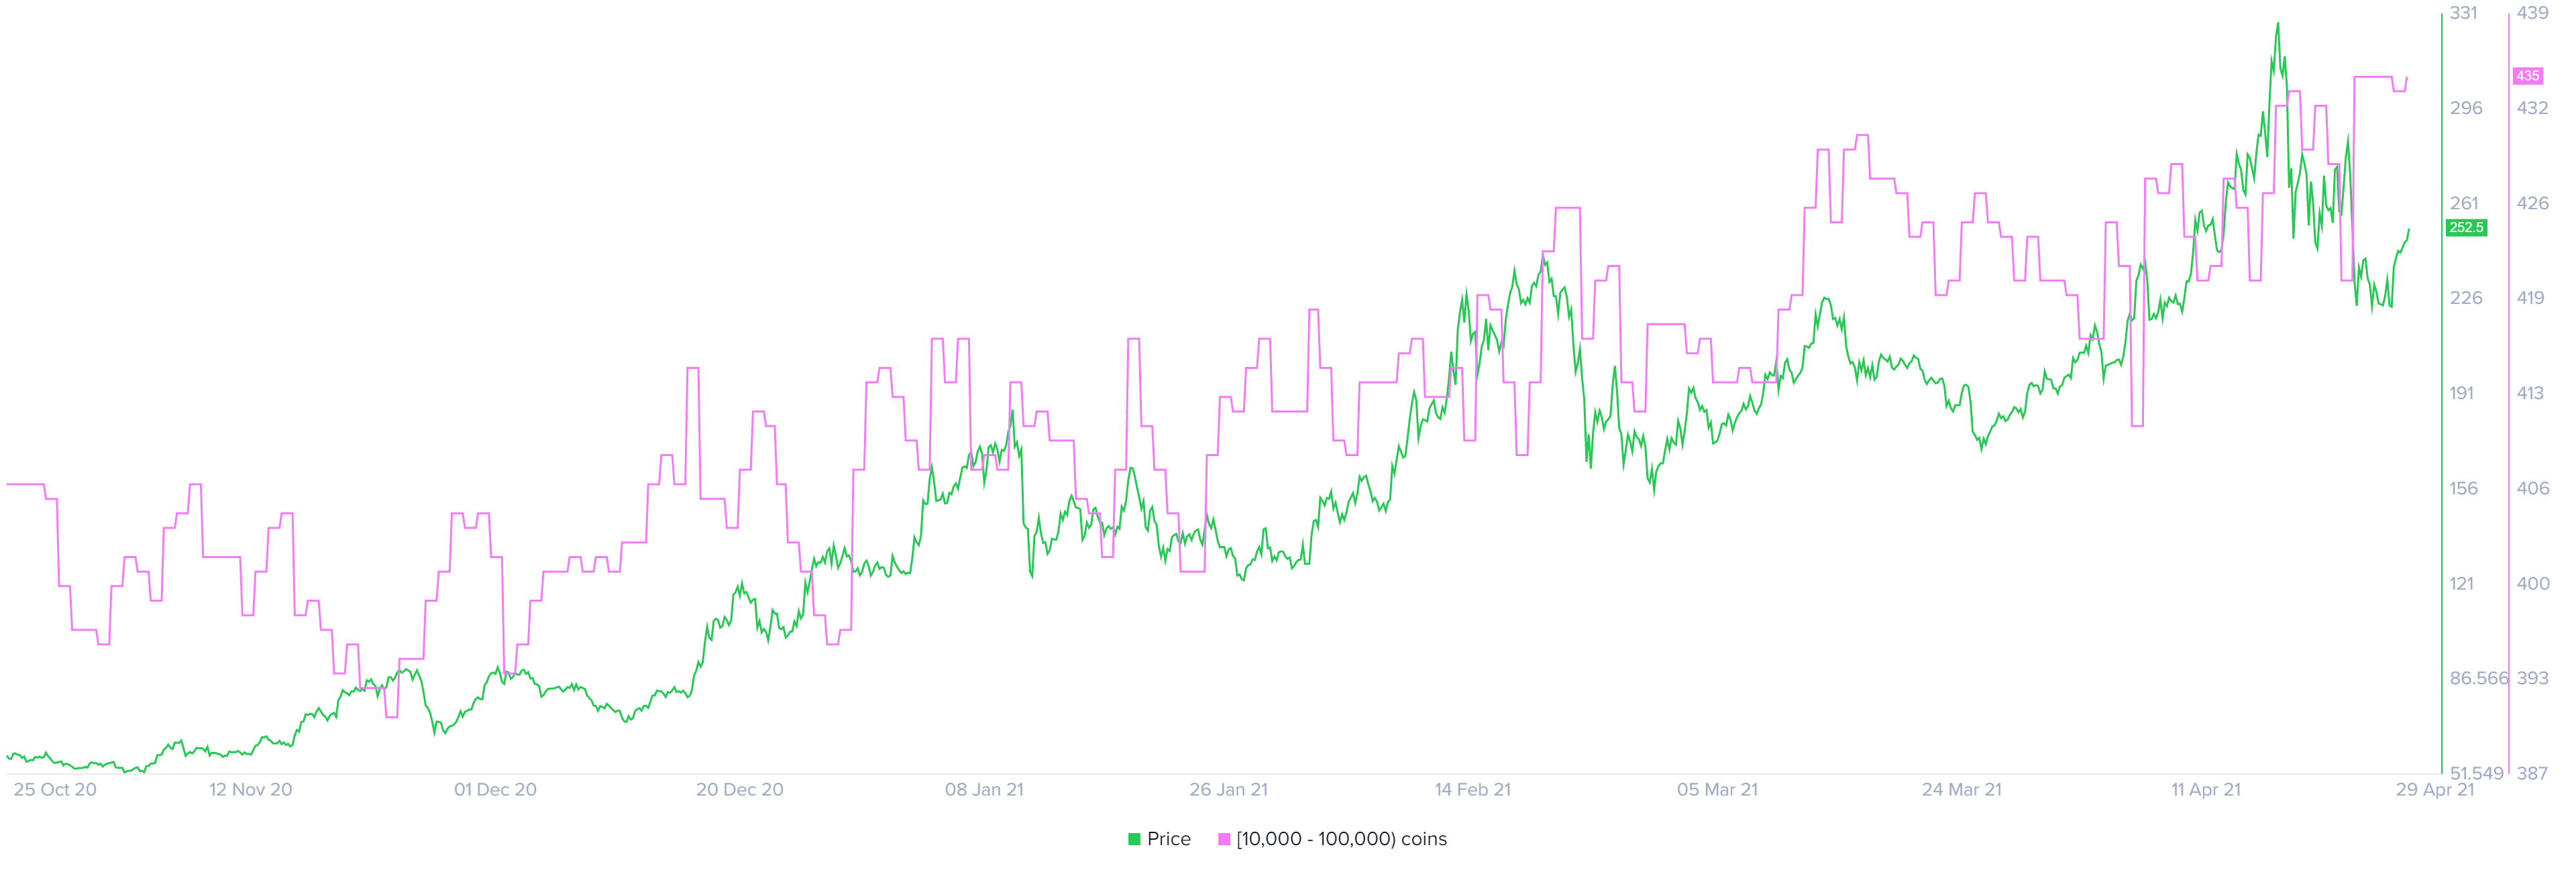
LTC supply distribution chart
The 30-day MVRV model by Santiment is another on-chain metric that confirms the optimism around this cryptocurrency. This fundamental index, used to measure the average profit/loss of the investors who purchased LTC in the past month, shows that it is still undervalued.
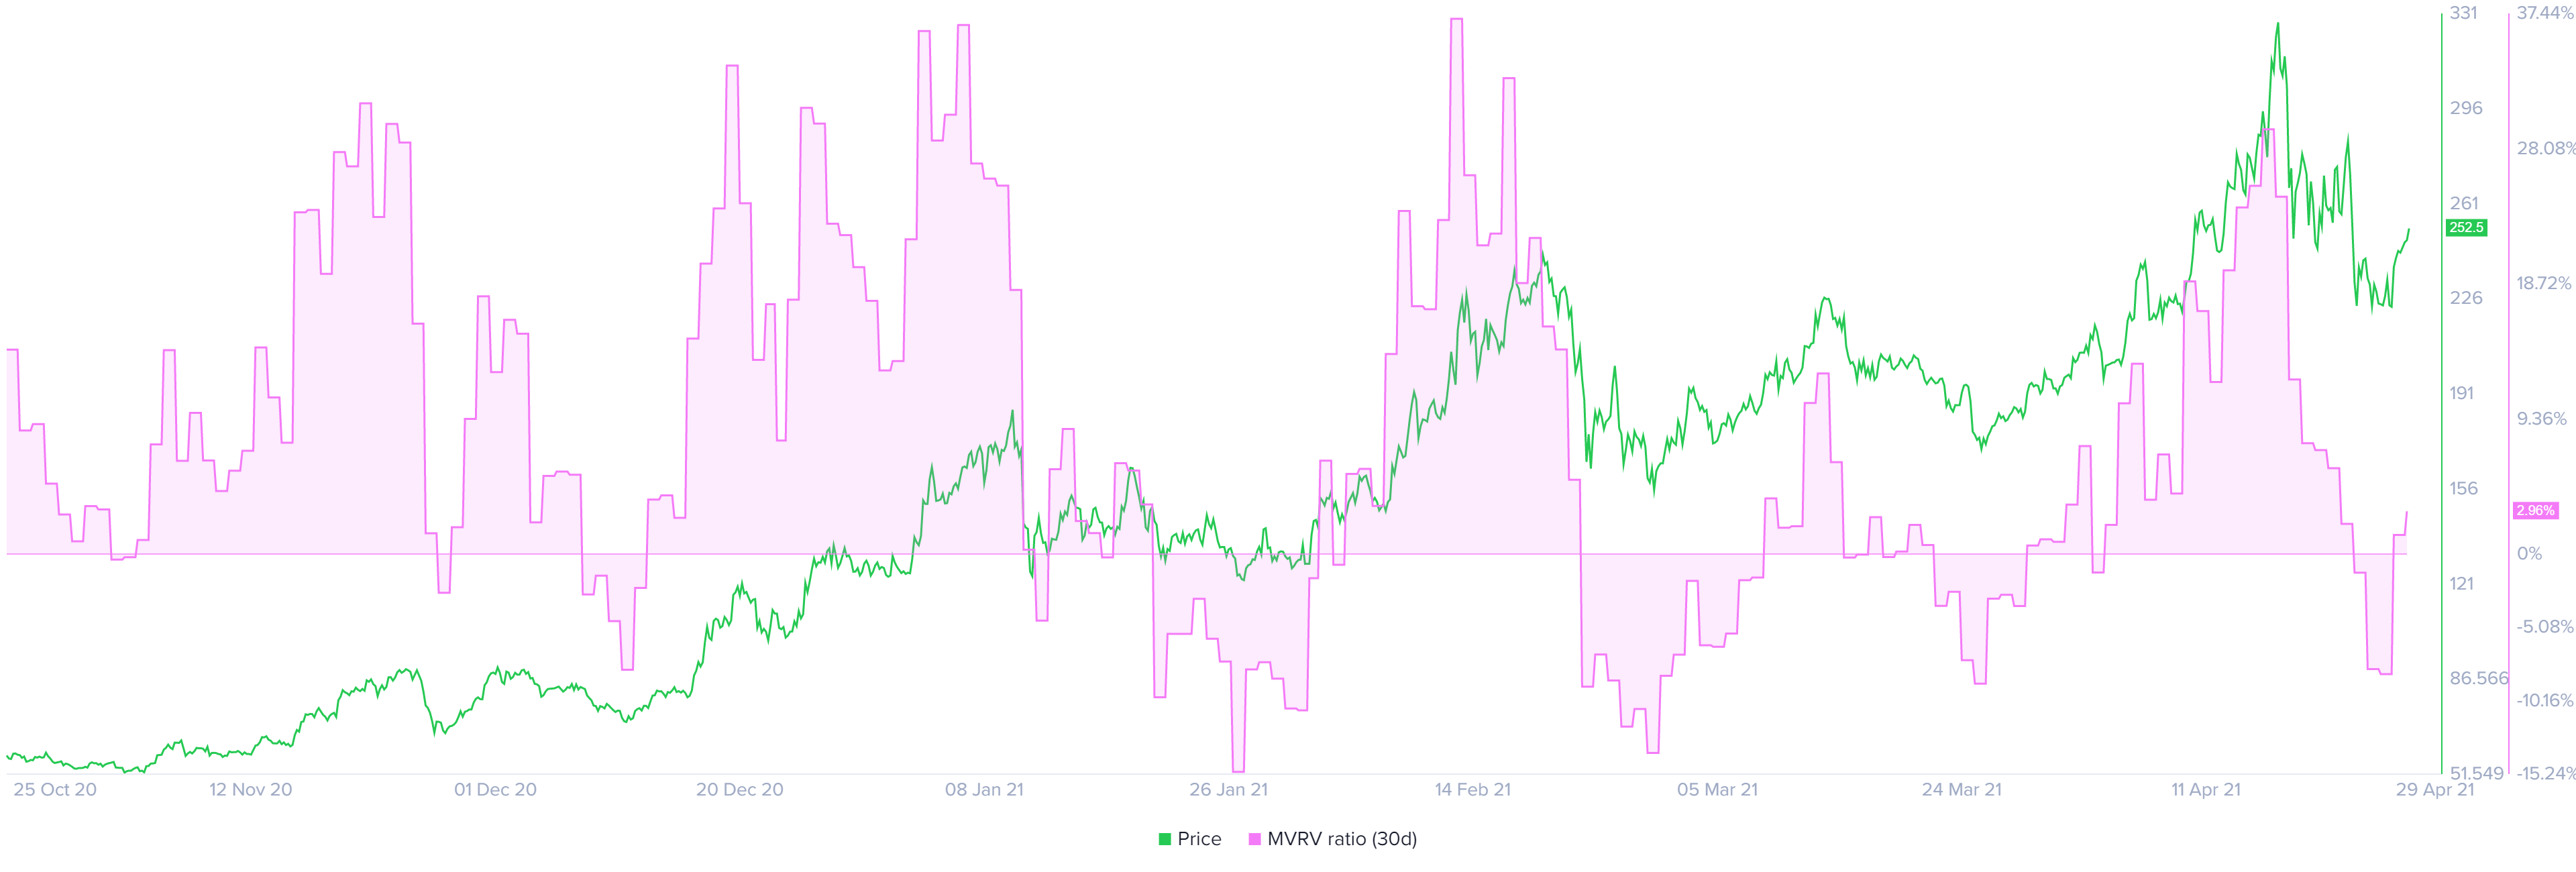
LTC 30-day MVRV chart
Regardless of the bullish outlook from multiple perspectives, if Litecoin price fails to stay above $218, it will invalidate the upward trajectory portrayed so far. Under these circumstances, LTC could slide to the demand zone’s lower trend line at $211 or $204, the swing low of the crash witnessed on April 23,