
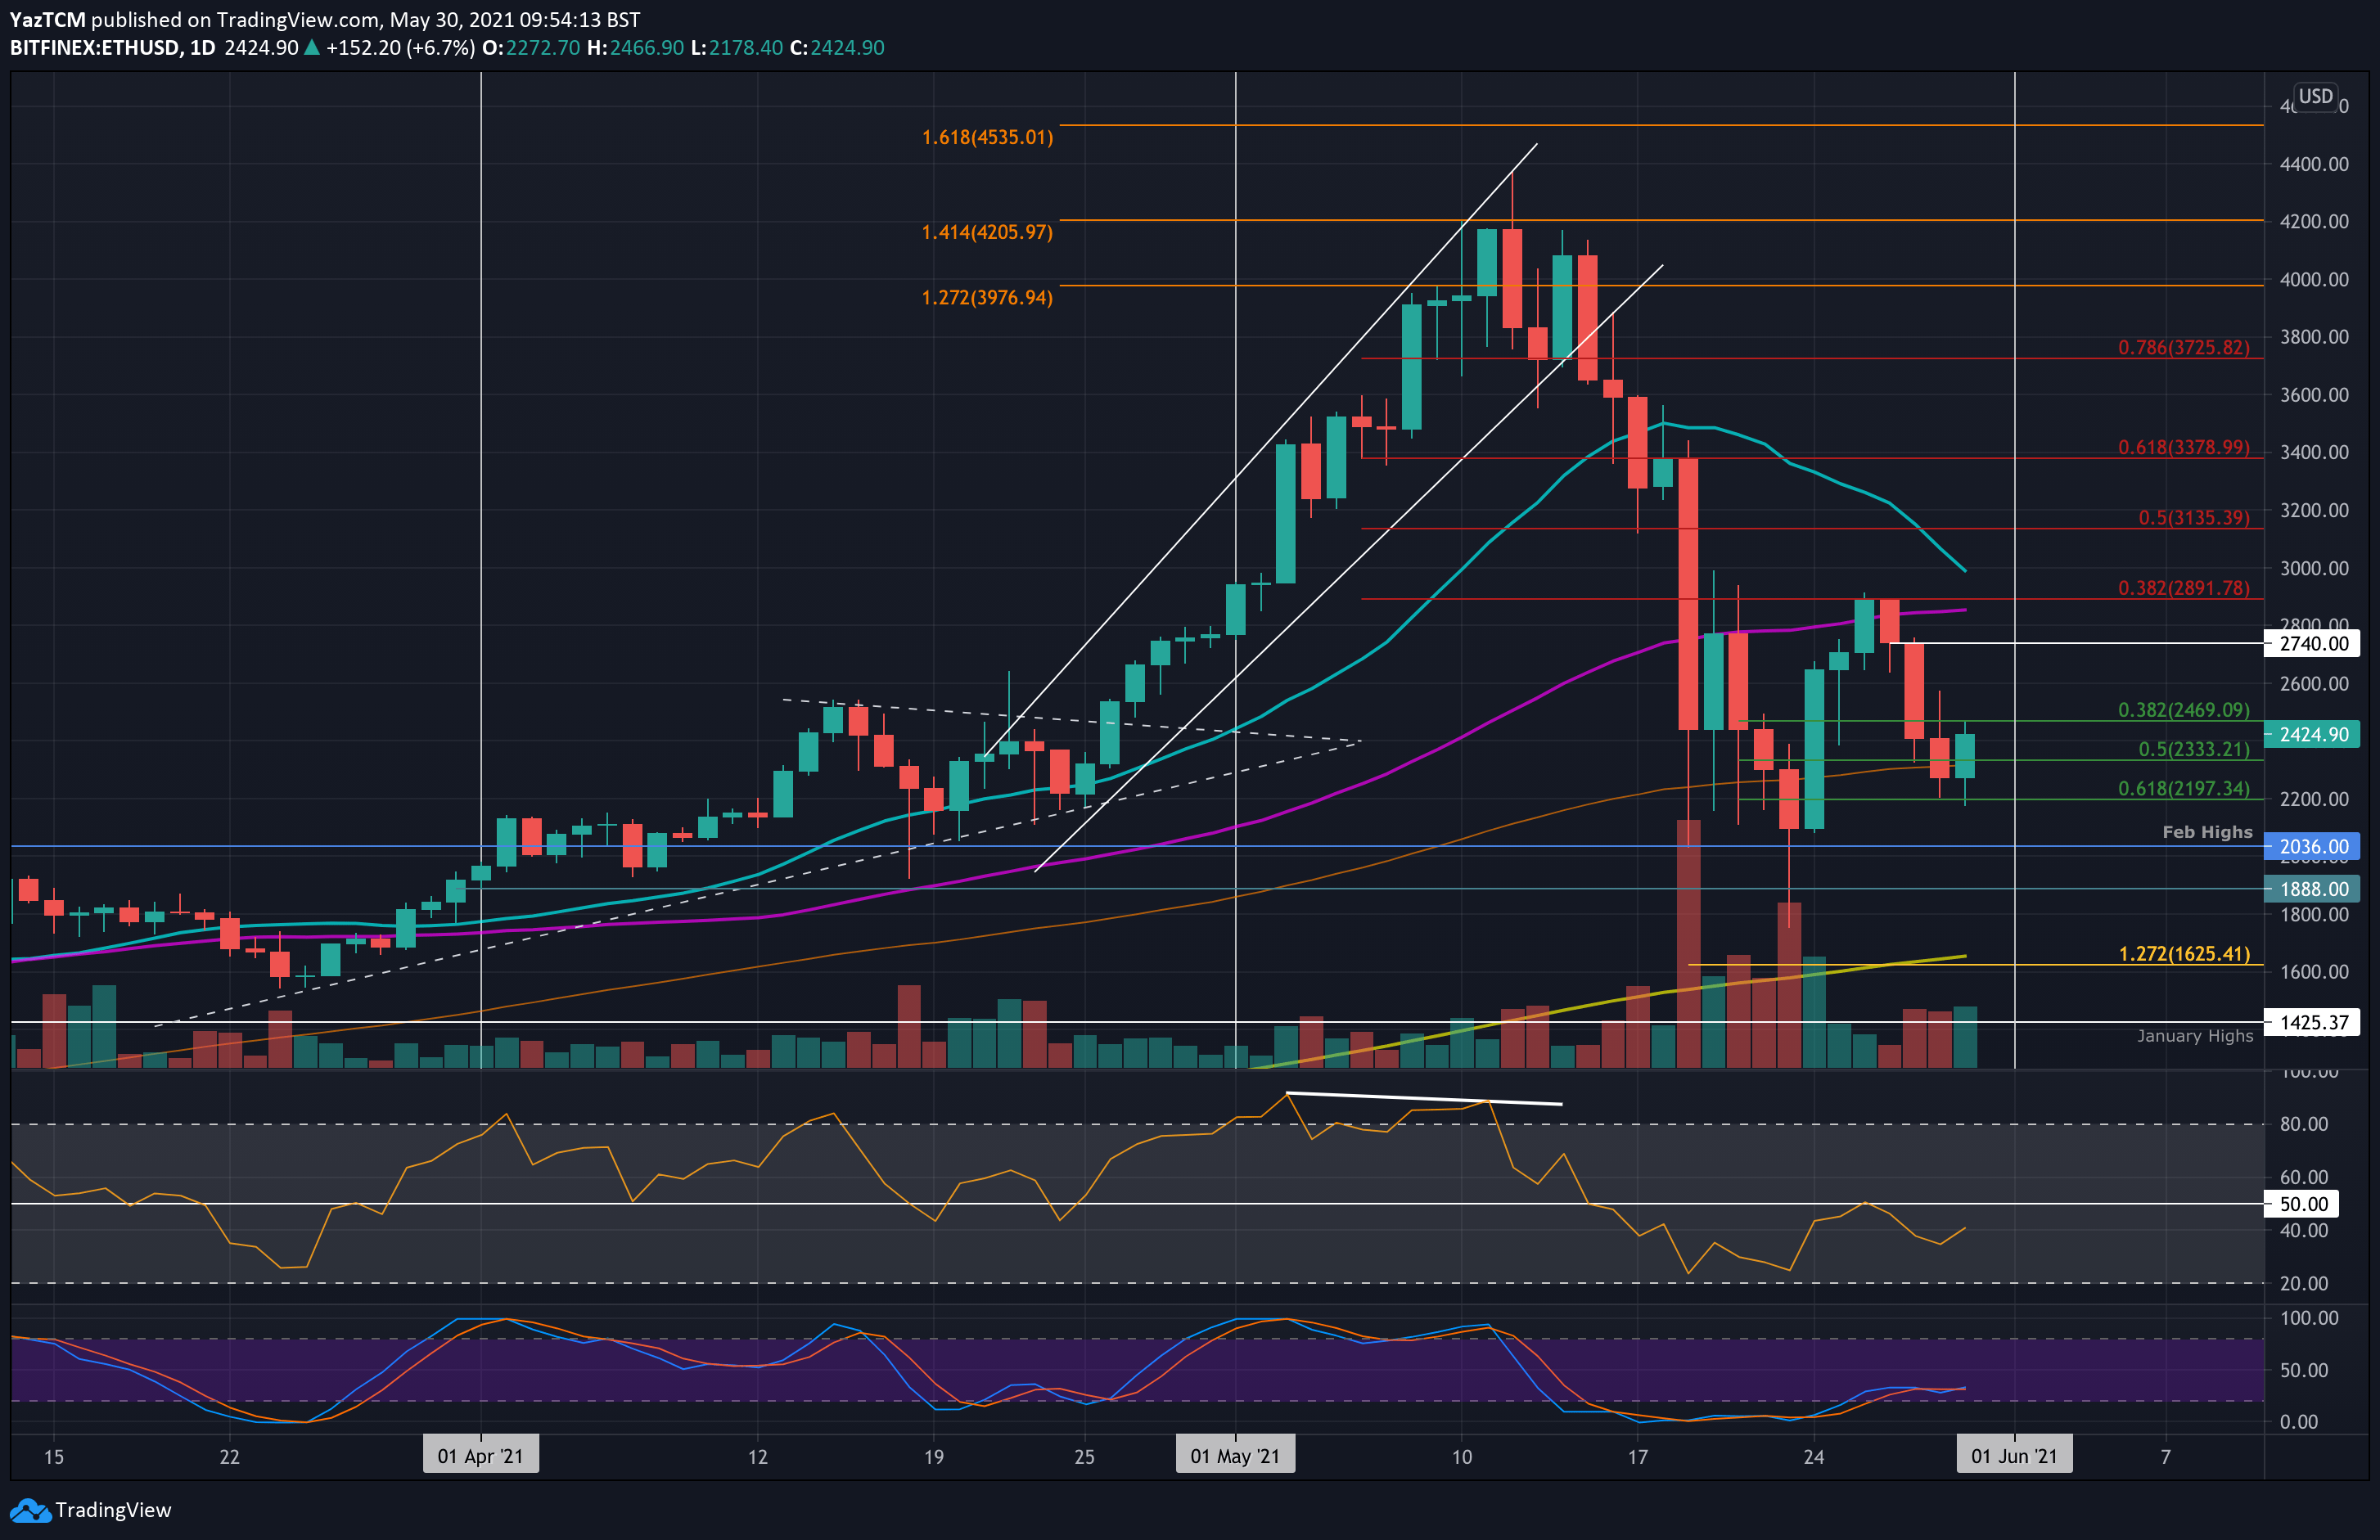
ETH/USD – Ether Trades In Short Term Symmetrical Triangle
Key Support Levels: $2330, $2200, $2035.
Key Resistance Levels: $2470, $2650, $2740.
While Bitcoin rebounded to $40K and got rejected earlier this week, ETH topped reaching nearly $2900, where it hit resistance at a bearish .382 Fib. From there, the coin started to head lower over the past few days until finding support at around $2200 (.618 Fib) just a few hours ago.
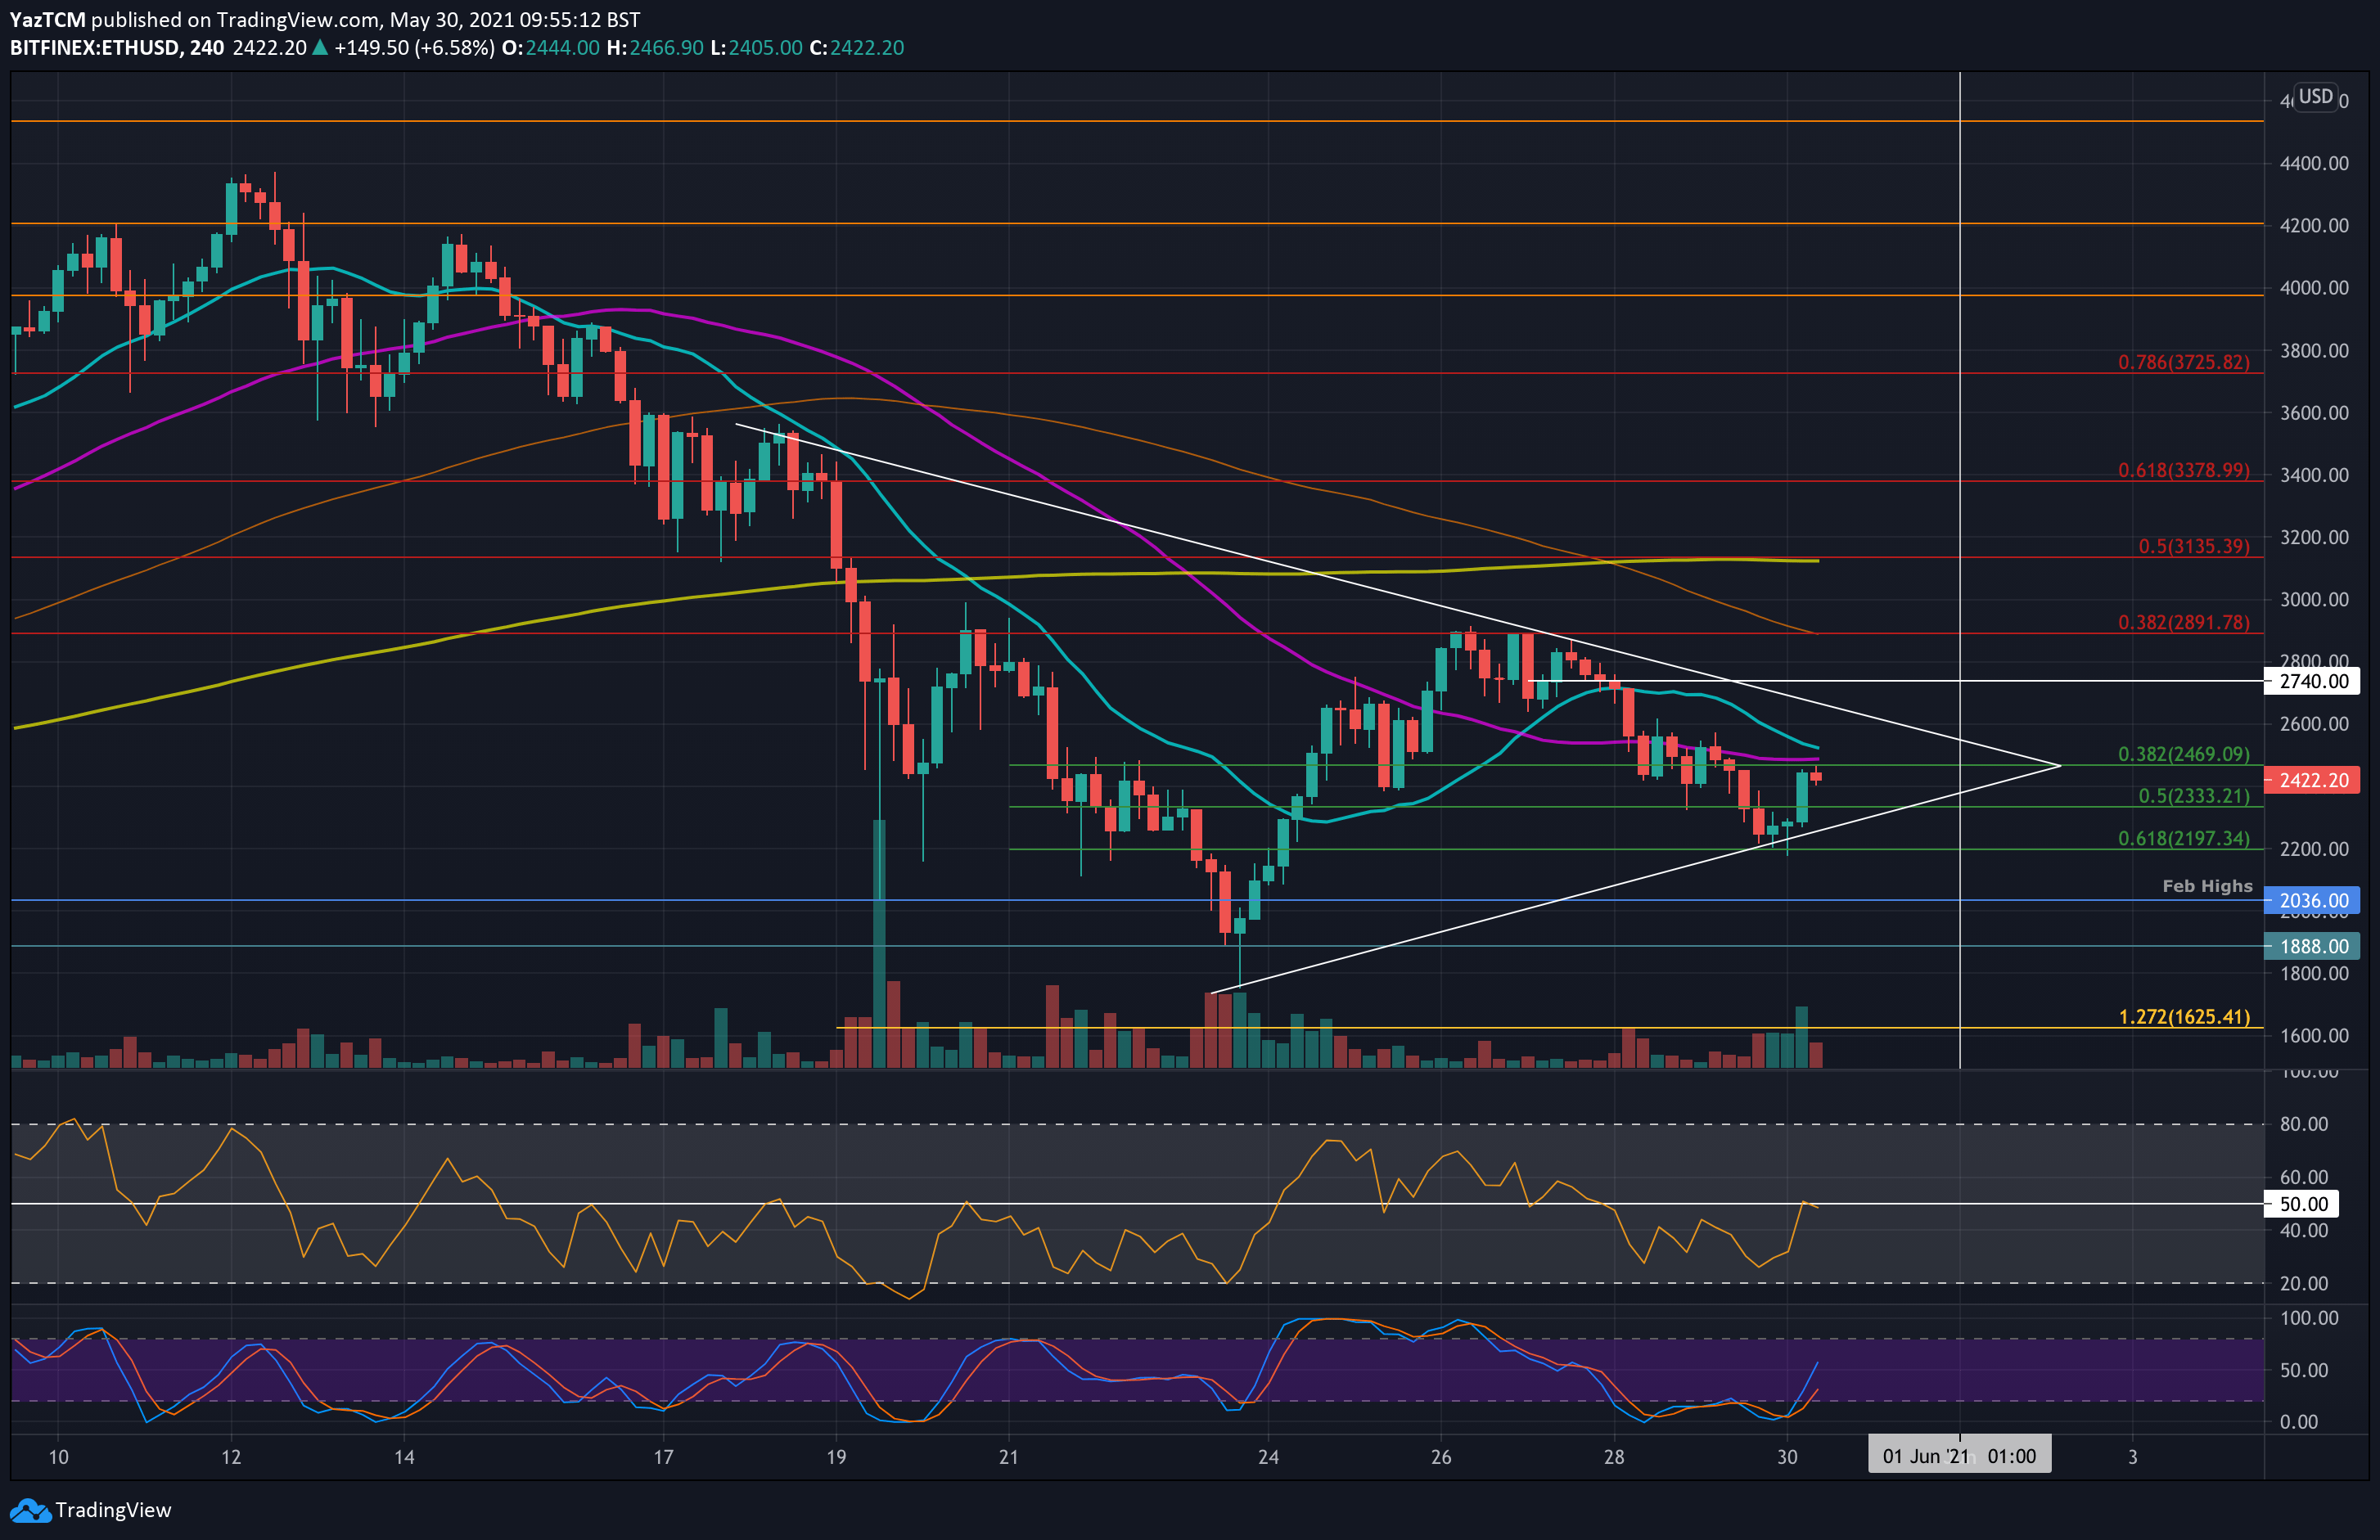
Looking at the following lower time frame chart, ETH is trading inside a symmetrical triangle pattern over the week, as it rebounded from the lower boundary earlier today while reaching $2200 support. The apex of this triangle extends into early June, when a breakout in either direction can still be expected at any moment.
ETH-USD Short Term Price Prediction
Looking ahead, the first resistance lies at $2470. This is followed by $2650 (upper angle of the triangle), $2740, and $2980 – $3K (50-day MA & bearish .382 Fib).
On the other side, the first support lies at $2330 (.5 Fib & 100-day MA). This is followed by $2200 (.618 Fib and today’s low), $2035 (Feb 2021 highs), $2000, and $1888.
The daily RSI is now pointing upward again as it looks to head back toward the midline. For a bullish breakout of the short-term triangle, the RSI must push above the 50 mark to increase the bullish momentum.
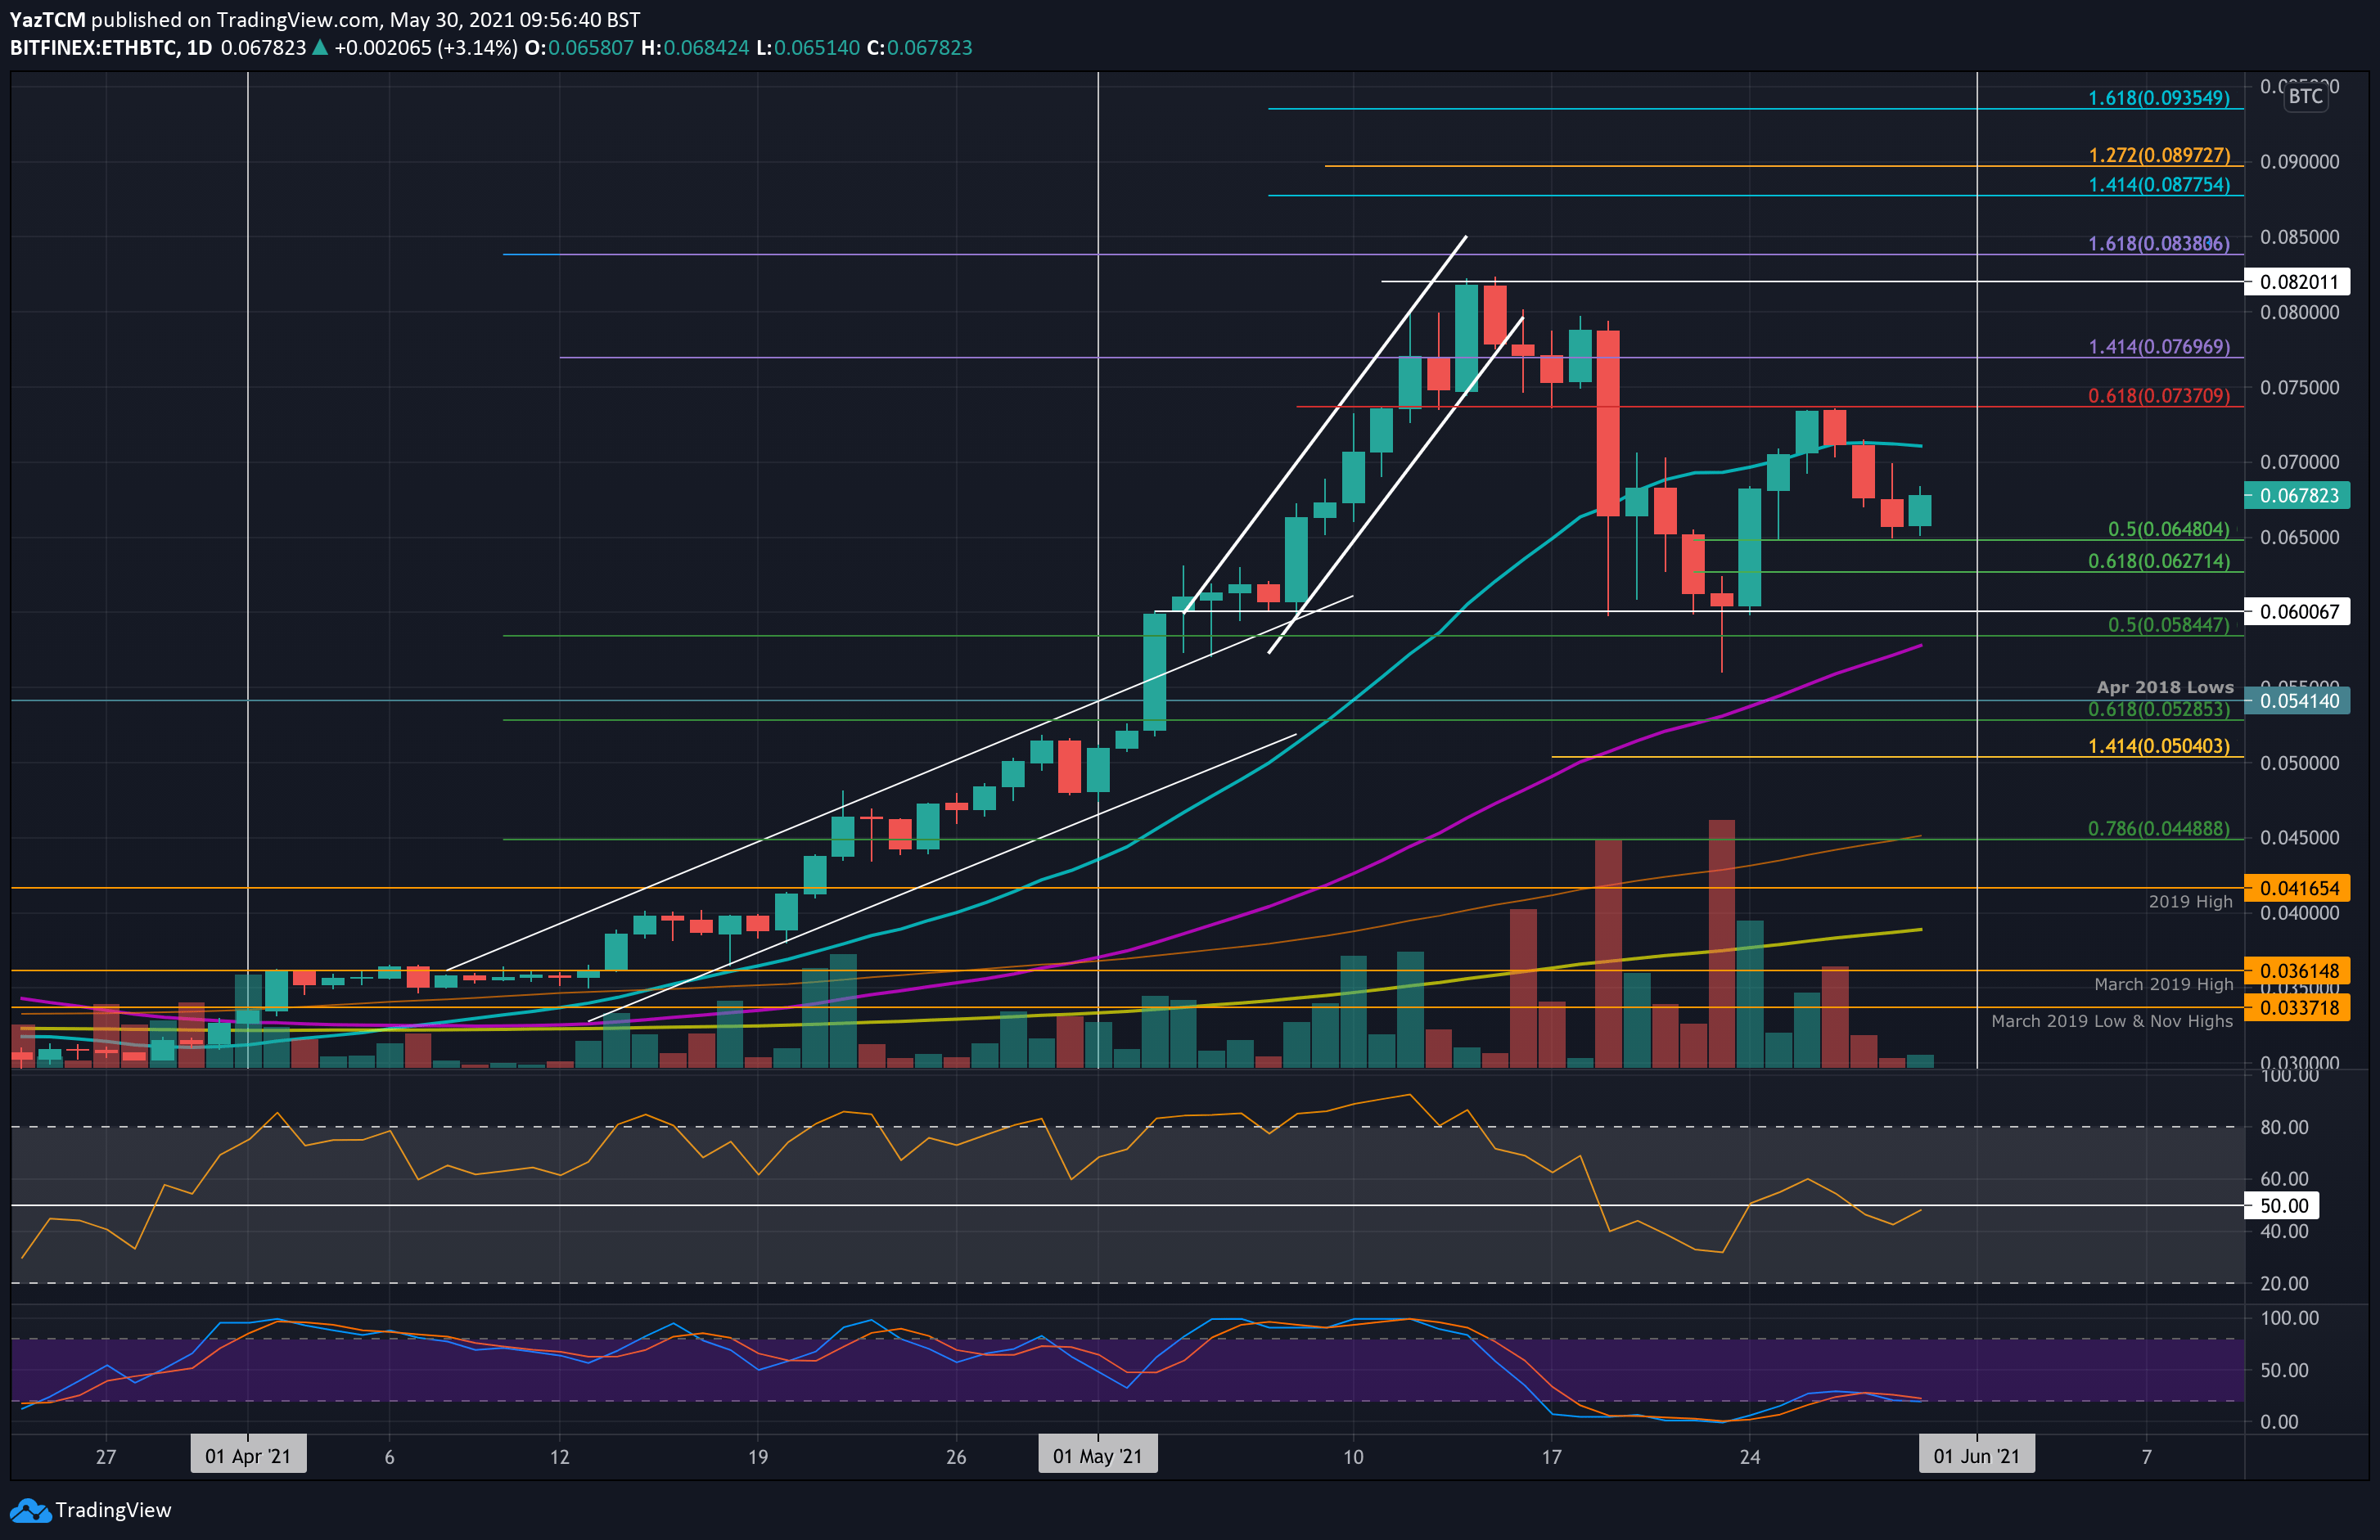
ETH/BTC – Bulls Find Support At .5 Fib Level
Key Support Levels: 0.067 BTC, 0.0648 BTC, 0.0627 BTC.
Key Resistance Levels: 0.07 BTC, 0.0737 BTC, 0.075 BTC.
Ethereum rebounded from 0.06 BTC at the start of last week and pushed as high as 0.0737 BTC earlier this week. There, it met resistance at a bearish .618 Fib and could not overcome the level.
As a result, ETH/BTC headed lower over the past few days until support was found at 0.0648 BTC (.5 Fib) yesterday. It has since bounced from this level as it trades at 0.0678 BTC.
ETH-BTC Short Term Price Prediction
Looking ahead, if the first resistance lies at 0.07 BTC (20-day MA). This is followed by 0.0737 BTC (bearish .618 Fib), 0.075 BTC, and 0.077 BTC (1.414 Fib Extension).
On the other side, the first strong support lies at 0.067 BTC. This is followed by 0.0648 BTC (.5 Fib), 0.0627 BTC (.618 Fib), and 0.06 BTC.
Likewise, the RSI is trading slightly beneath the midline as the bulls attempt to re-gain control of the market momentum. Additionally, the Stochastic RSI looks primed for a bullish crossover signal that should help the bullish scenario.
Binance Futures 50 USDT FREE Voucher: Use this link to register & get 10% off fees and 50 USDT when trading 500 USDT (limited offer).
PrimeXBT Special Offer: Use this link to register & enter POTATO50 code to get 50% free bonus on any deposit up to 1 BTC.
Disclaimer: Information found on CryptoPotato is those of writers quoted. It does not represent the opinions of CryptoPotato on whether to buy, sell, or hold any investments. You are advised to conduct your own research before making any investment decisions. Use provided information at your own risk. See Disclaimer for more information.
Cryptocurrency charts by TradingView.