
Bitcoin (BTC/USD), Litecoin (LTC/USD), Ethereum (ETH/USD), Technical Analysis – Talking Points
- Bitcoin looking vulnerable as push into new highs struggles
- Litecoin extended gains above triangle, momentum is fading
- Ethereum’s push into record highs appears more solidified
Bitcoin Technical Outlook
Bitcoin struggled to maintain a push into new all-time highs over the past 24 hours as Coinbase fell 23% from its intraday peak after a volatile initial public offering. BTC/USD left behind a neutral Doji candlestick. When a Doji occurs at or around a new high, it signals indecision and can at times precede a turn lower. A further downside close could open the door to further losses.
Negative RSI divergence does highlight that upside momentum is fading, which may hint at a turning point. Still, that would place the focus on rising support from January, which could reinstate the dominant upside focus. If it doesn’t, then the 100-day Simple Moving Average could down the road. Otherwise, taking out the midpoint of the Fibonacci extension at 66833 exposes the 61.8% level at 70733.
BTC/USD – Daily Chart
Litecoin Technical Outlook
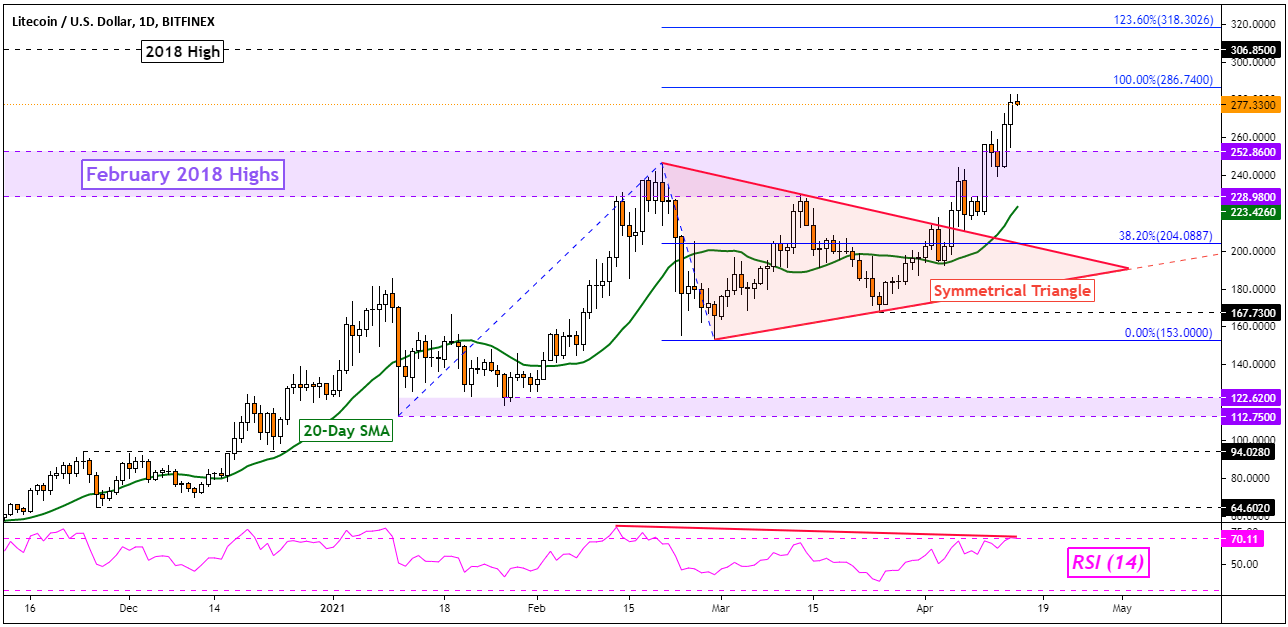
Litecoin extended gains to new highs after breaking above a Symmetrical Triangle, which I noted the formation of earlier this month. LTC/USD also took out highs from February 2018, opening the door to revisiting the peak from the same year at 306.85. However, getting there entails a push above the 100% Fibonacci extension at 286.74.
Negative RSI divergence does show that upside momentum is fading however, which can at times precede a turn lower. That could place the focus on the 20-day SMA which can maintain the dominant upside focus. The 228 – 252 inflection zone could also come into play in the event of a turn lower. Otherwise, extending beyond peaks from 2018 exposes the 123.6% extension at 318.3026.
LTC/USD- Daily Chart
Ethereum Technical Outlook
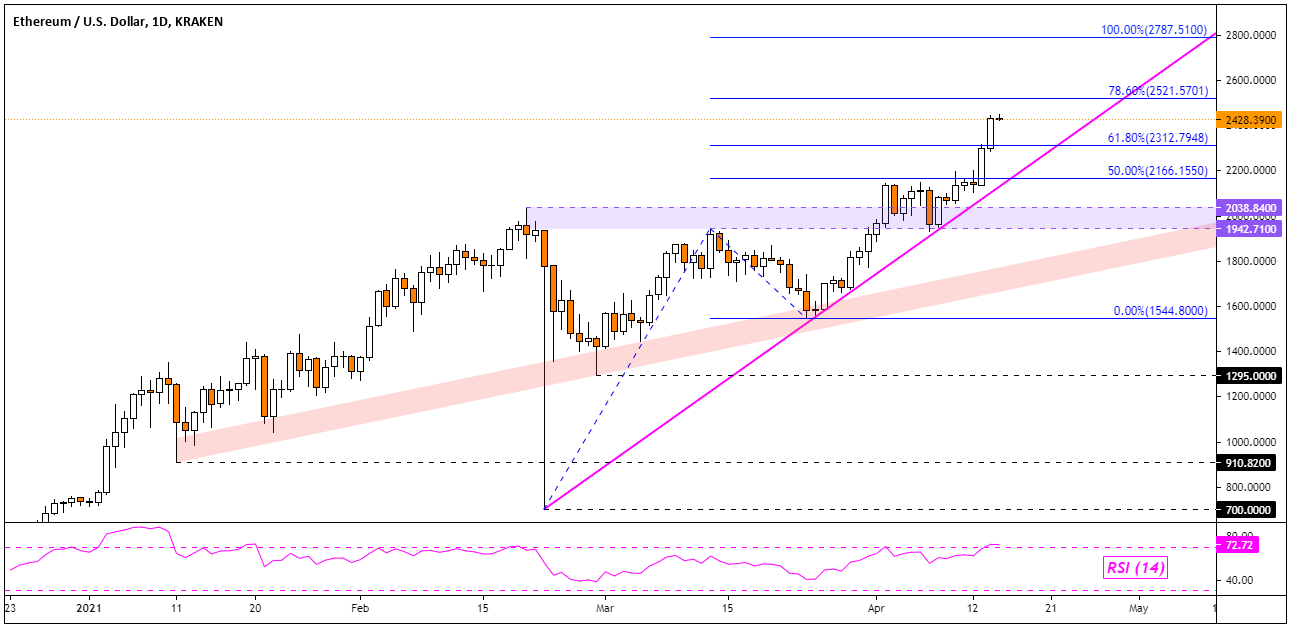
Ethereum also extended gains into fresh all-time highs over the past 24 hours. This followed a push above the former 1942 – 2038 resistance zone. ETH/USD closed above the 61.8% Fibonacci extension at 2312.7948, exposing the 78.6% level at 252.5701. Maintaining the focus to the upside in the near term appears to be rising support from the February low – pink line on the daily chart below.
If the 78.6% level holds, a turn lower towards rising support may occur. Closing under the trendline would then expose a zone of rising support from January that has a more gradual slope. The outlook could shift further bearish if Ethereum manages to get under this trendline. Otherwise, extending gains places the focus on the 100% level at 2787.51.
ETH/USD – Daily Chart
— Written by Daniel Dubrovsky, Strategist for DailyFX.com
To contact Daniel, use the comments section below or @ddubrovskyFX on Twitter