
Cardano (ADAUSD)
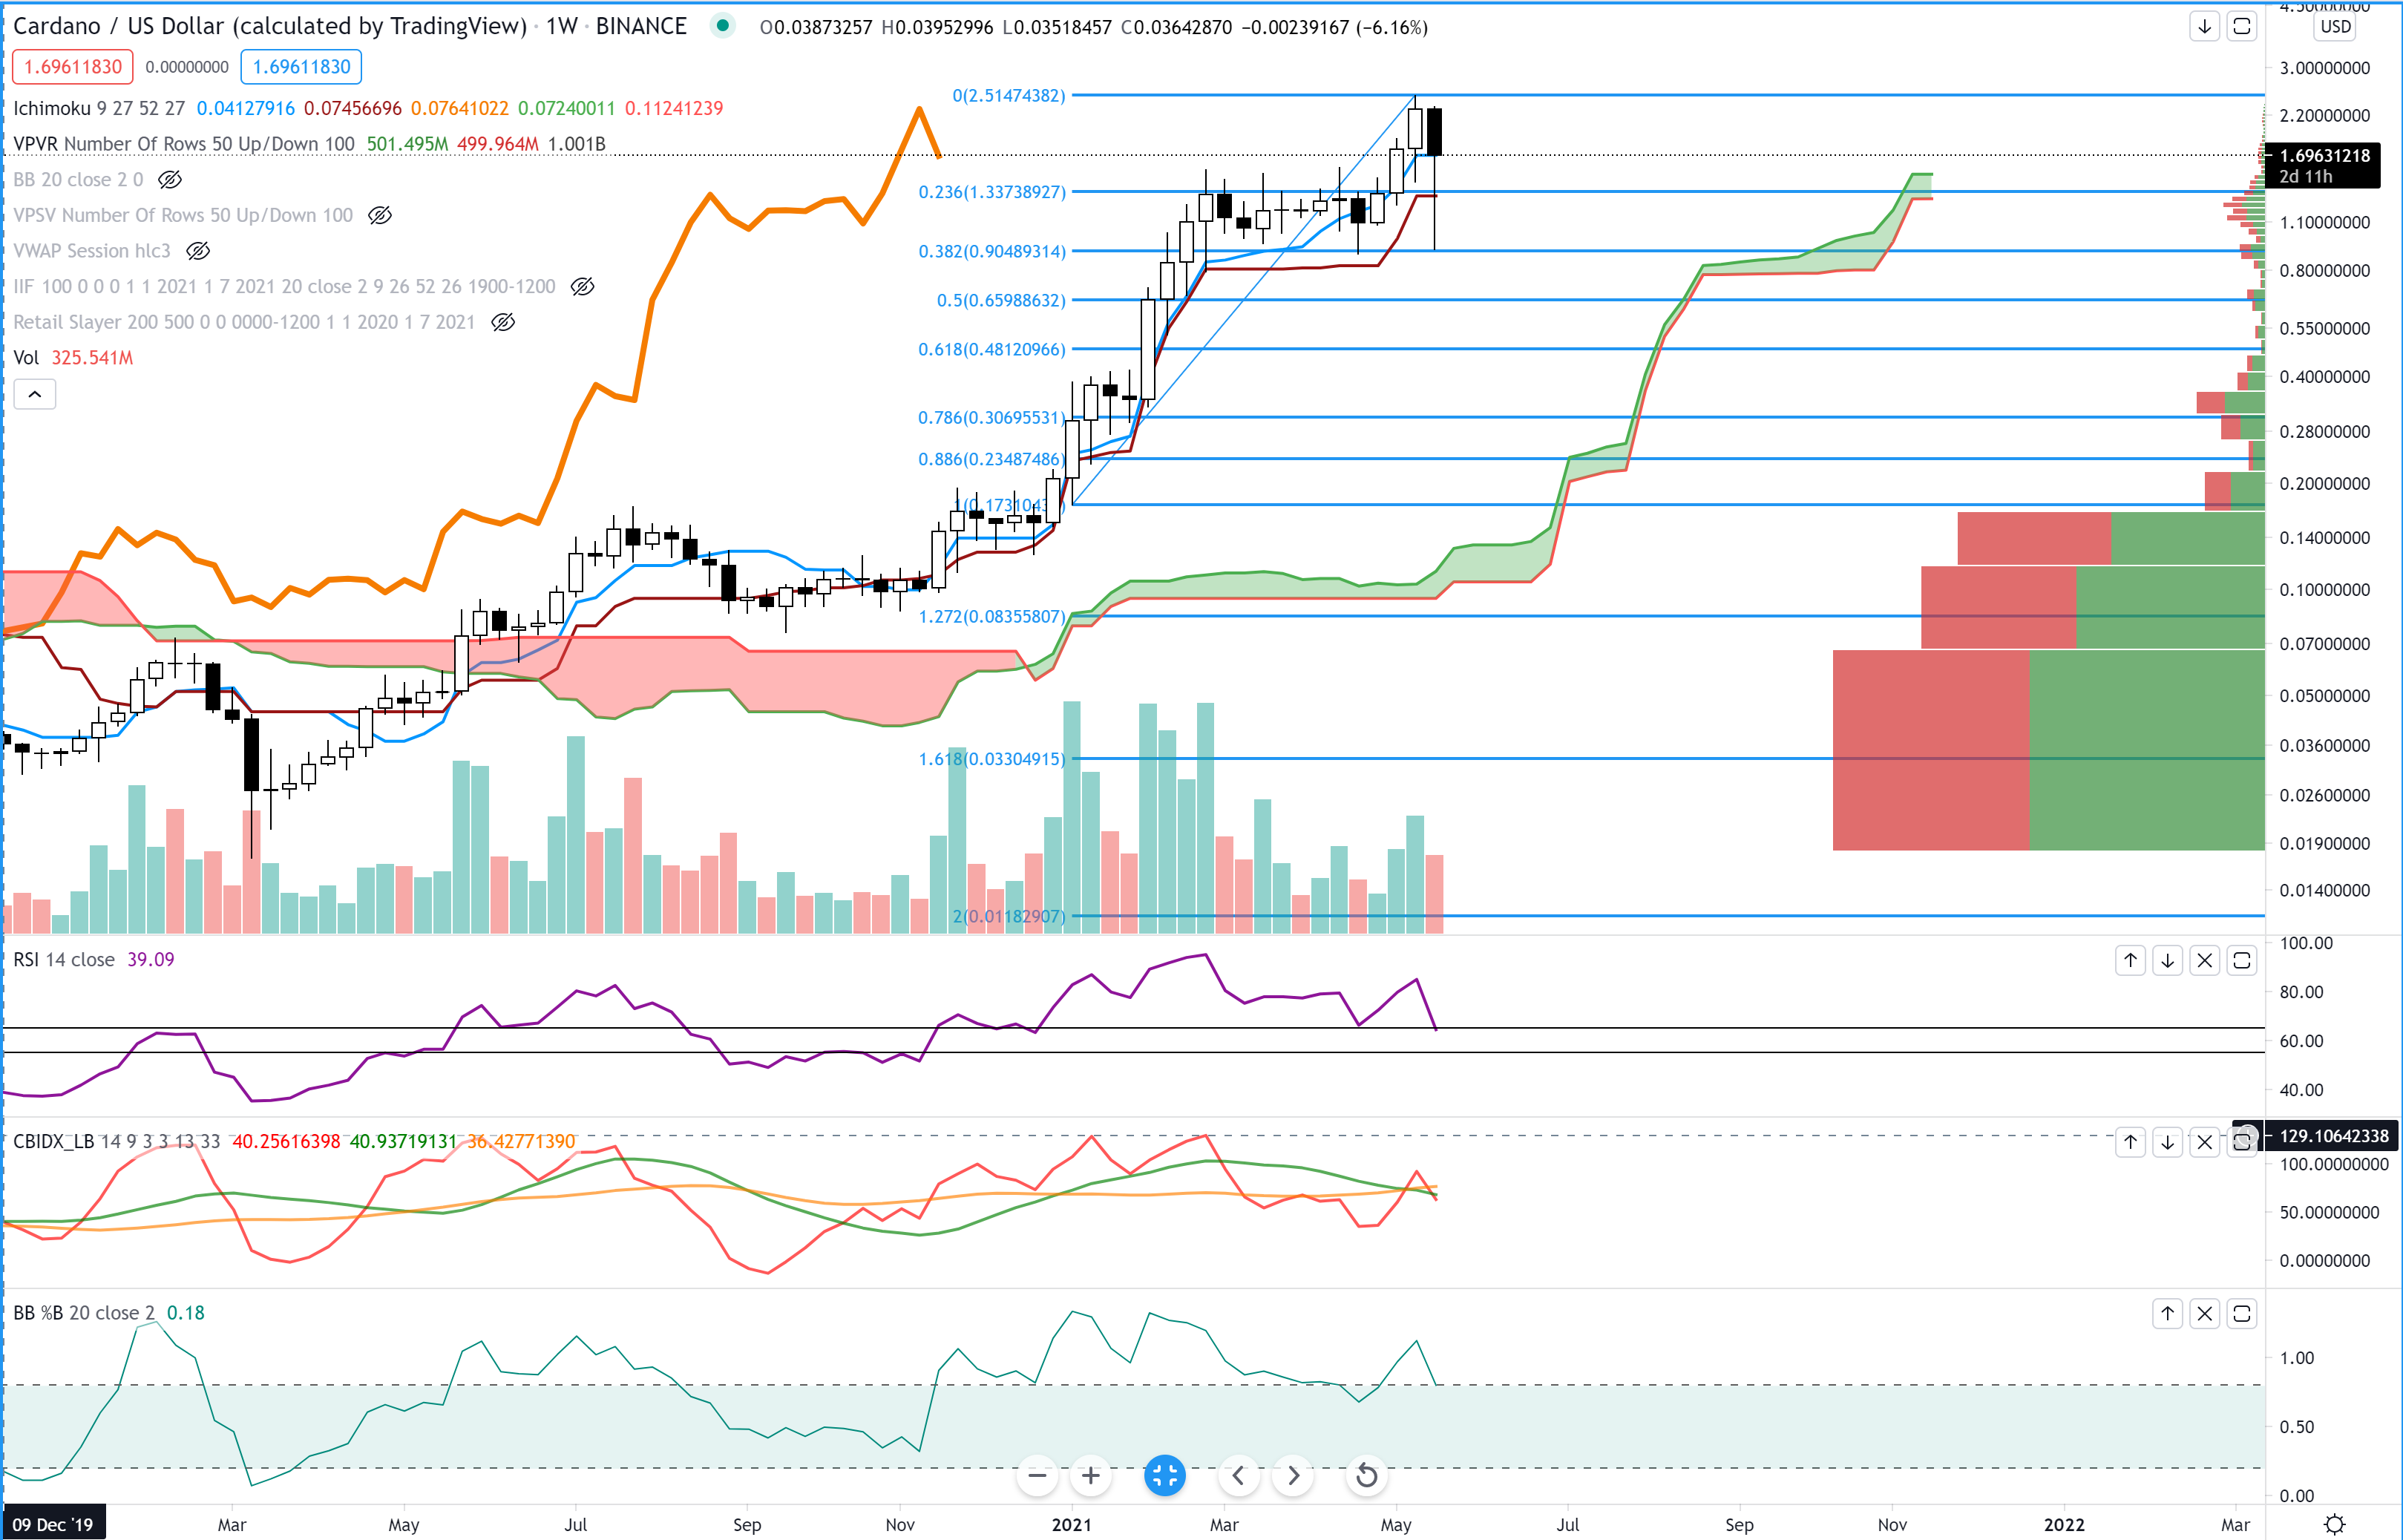
Above: Cardano (ADAUSD) Weekly Chart
Depending on how Cardano closes out this weekly candlestick, we could see a pause and consolidation phase in Cardano’s price action or a strong corrective move. At the present, the weekly Tenkan-Sen is at 1.7024 – right were Cardano is currently trading. Below that, the support of next importance is the Kijun-Sen at 1.3062. My primary support level that I am looking at remains between 0.84 and 0.94. The RSI, Composite Index, and %B continue to point to lower price action.
Bitcoin (BTCUSD)
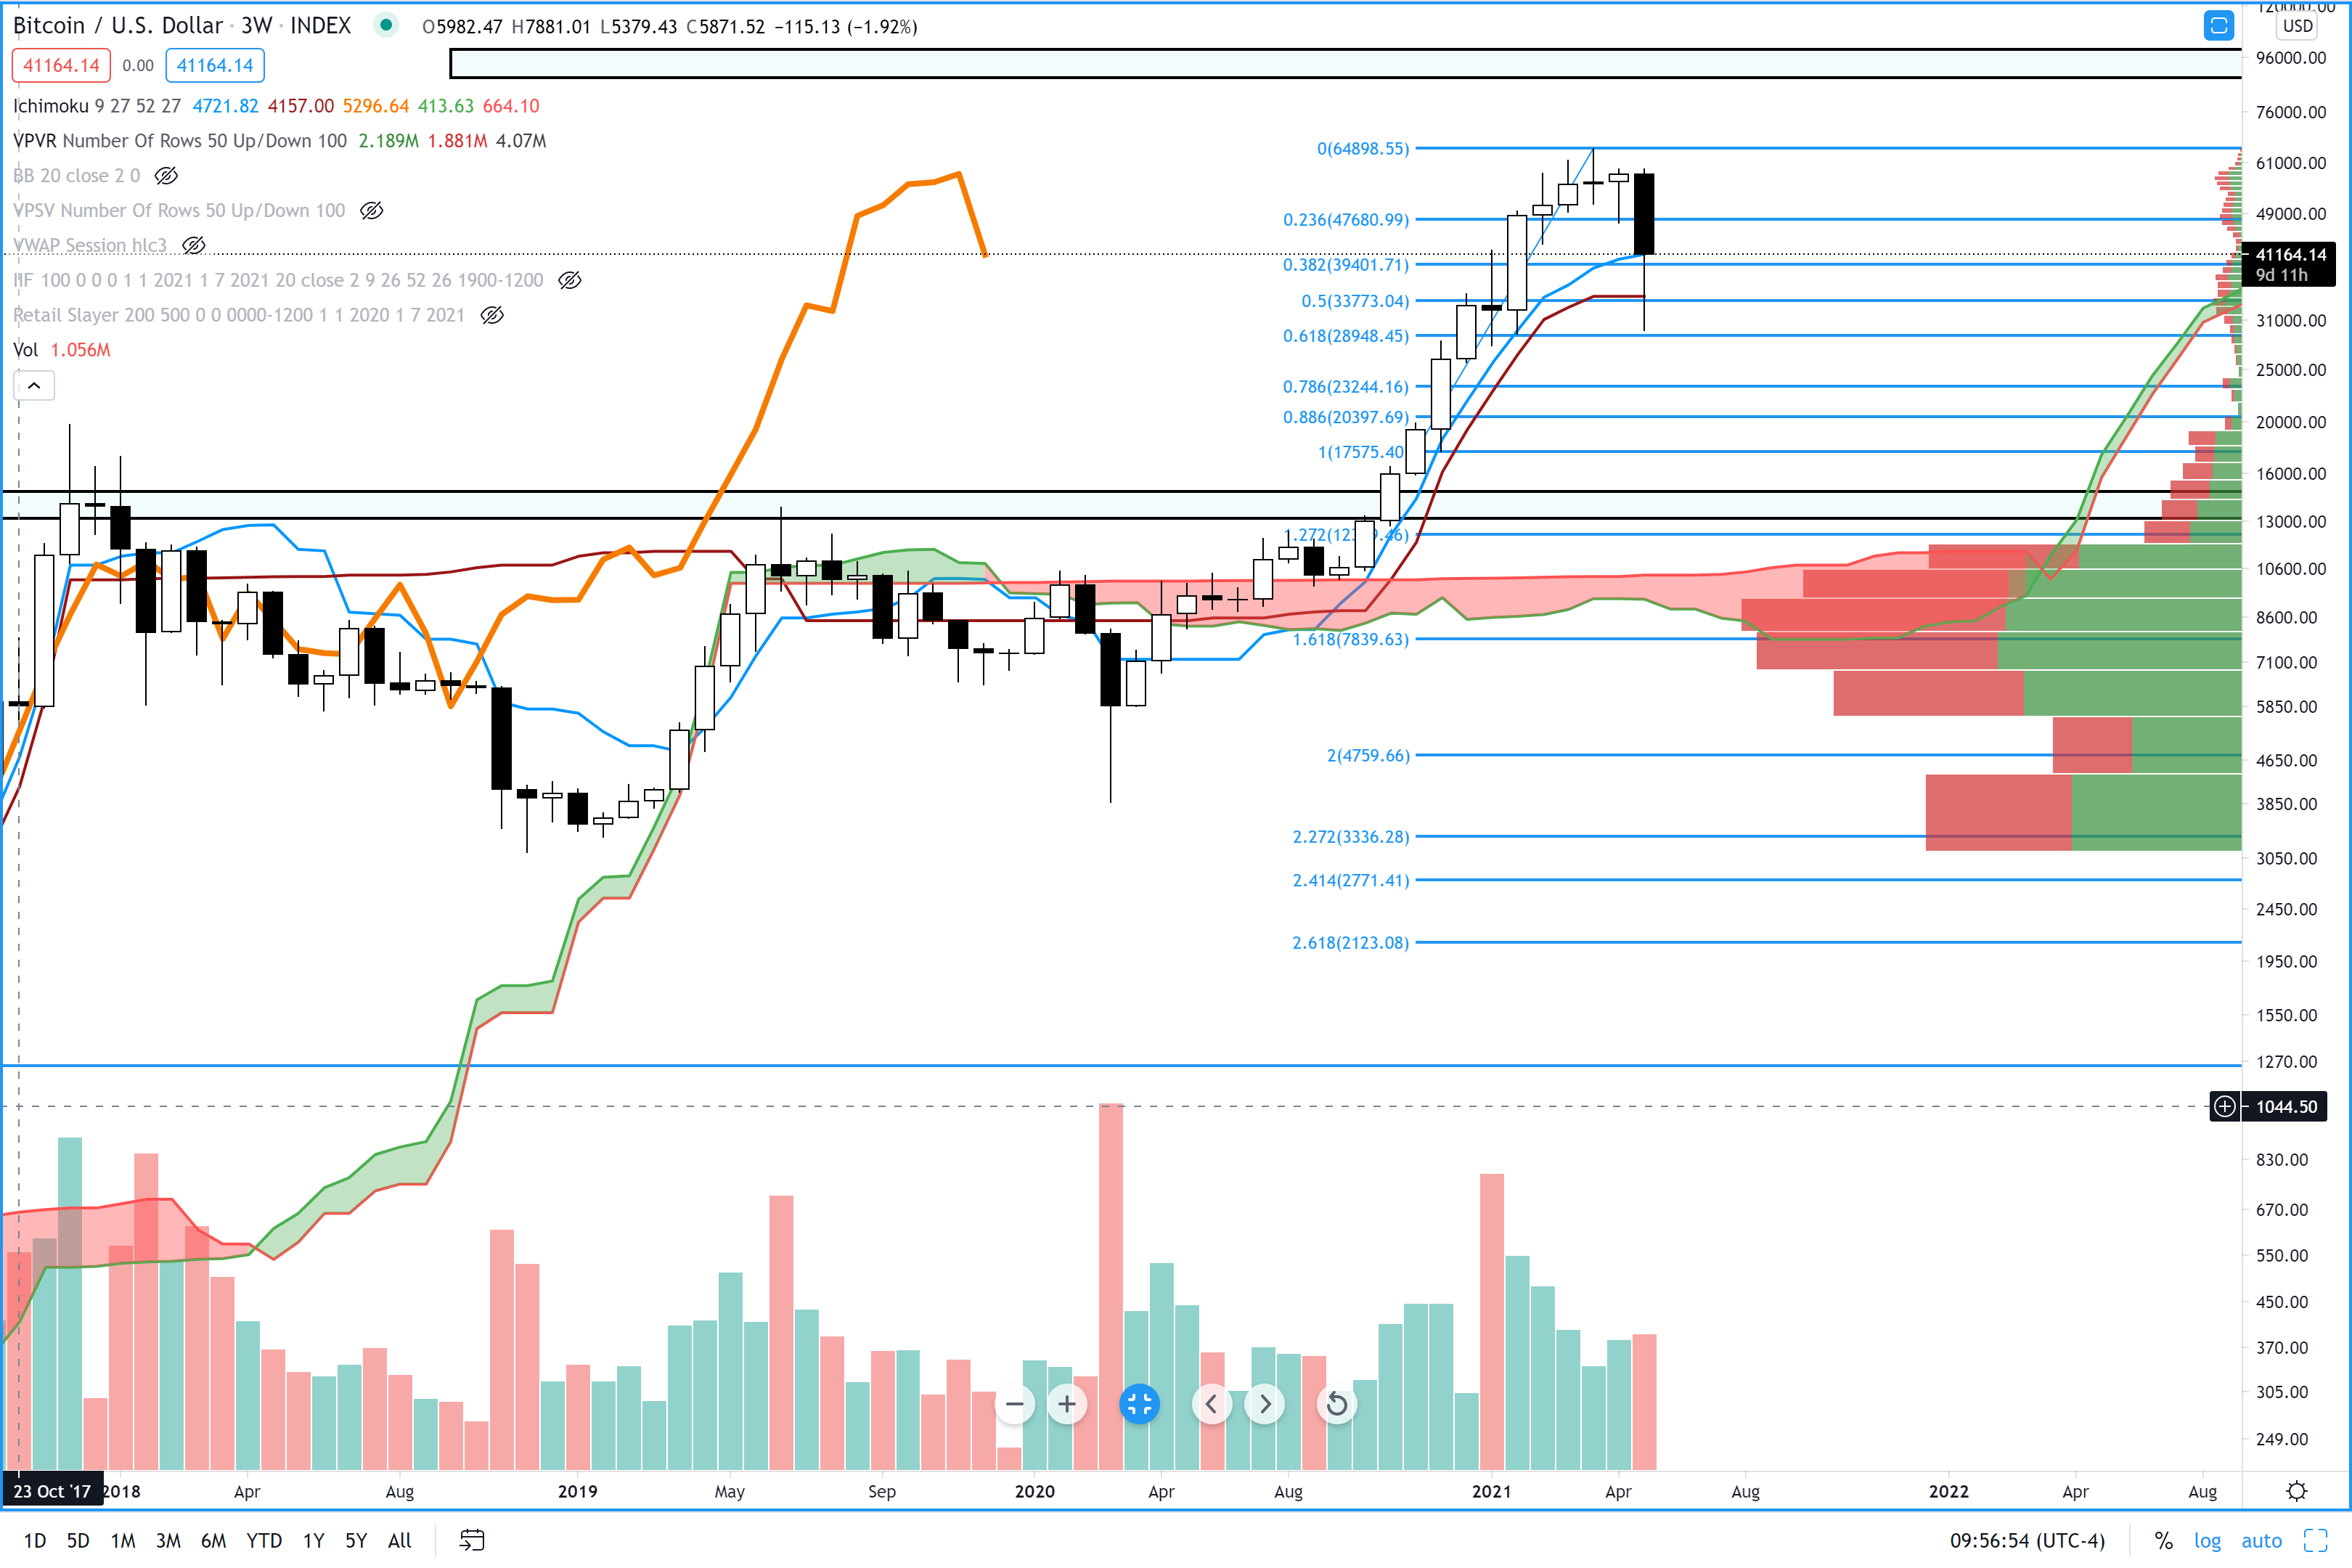
Above: Bitcoin (BTCUSD) 3-Week Chart
The chart above is one that I don’t share that often, but its one I use in my own trading and investing: the 3-week chart. I was tipped off to this chart from the greatest living analyst and trader alive today, Connie Brown. She will frequently show this chart timeframe in her work. One of the things to notice on this chart is the particular type of divergence that exists on the chart: hidden bullish divergence. Hidden divergences are usually the only types of divergence I like to trade. This is because hidden divergences are traded in the direction of the trend as opposed to regular divergences which signal an end to a trend or a temporary corrective move. It has been my experience that hidden divergences play out better and have a higher positive expectancy rate than regular divergences. Both the RSI and the Composite Index have printed lower lows but the candlestick chart is showing higher lows.
Pay special attention to 33,773 and 28,948 as near term primary support levels. If you want to go crazy, if we experience a flash crash over the weekend, I’m looking at the powerful 88.6% Fibonacci Retracement level at 20,397 as an excellent buying opportunity.

Ethereum (ETHUSD)
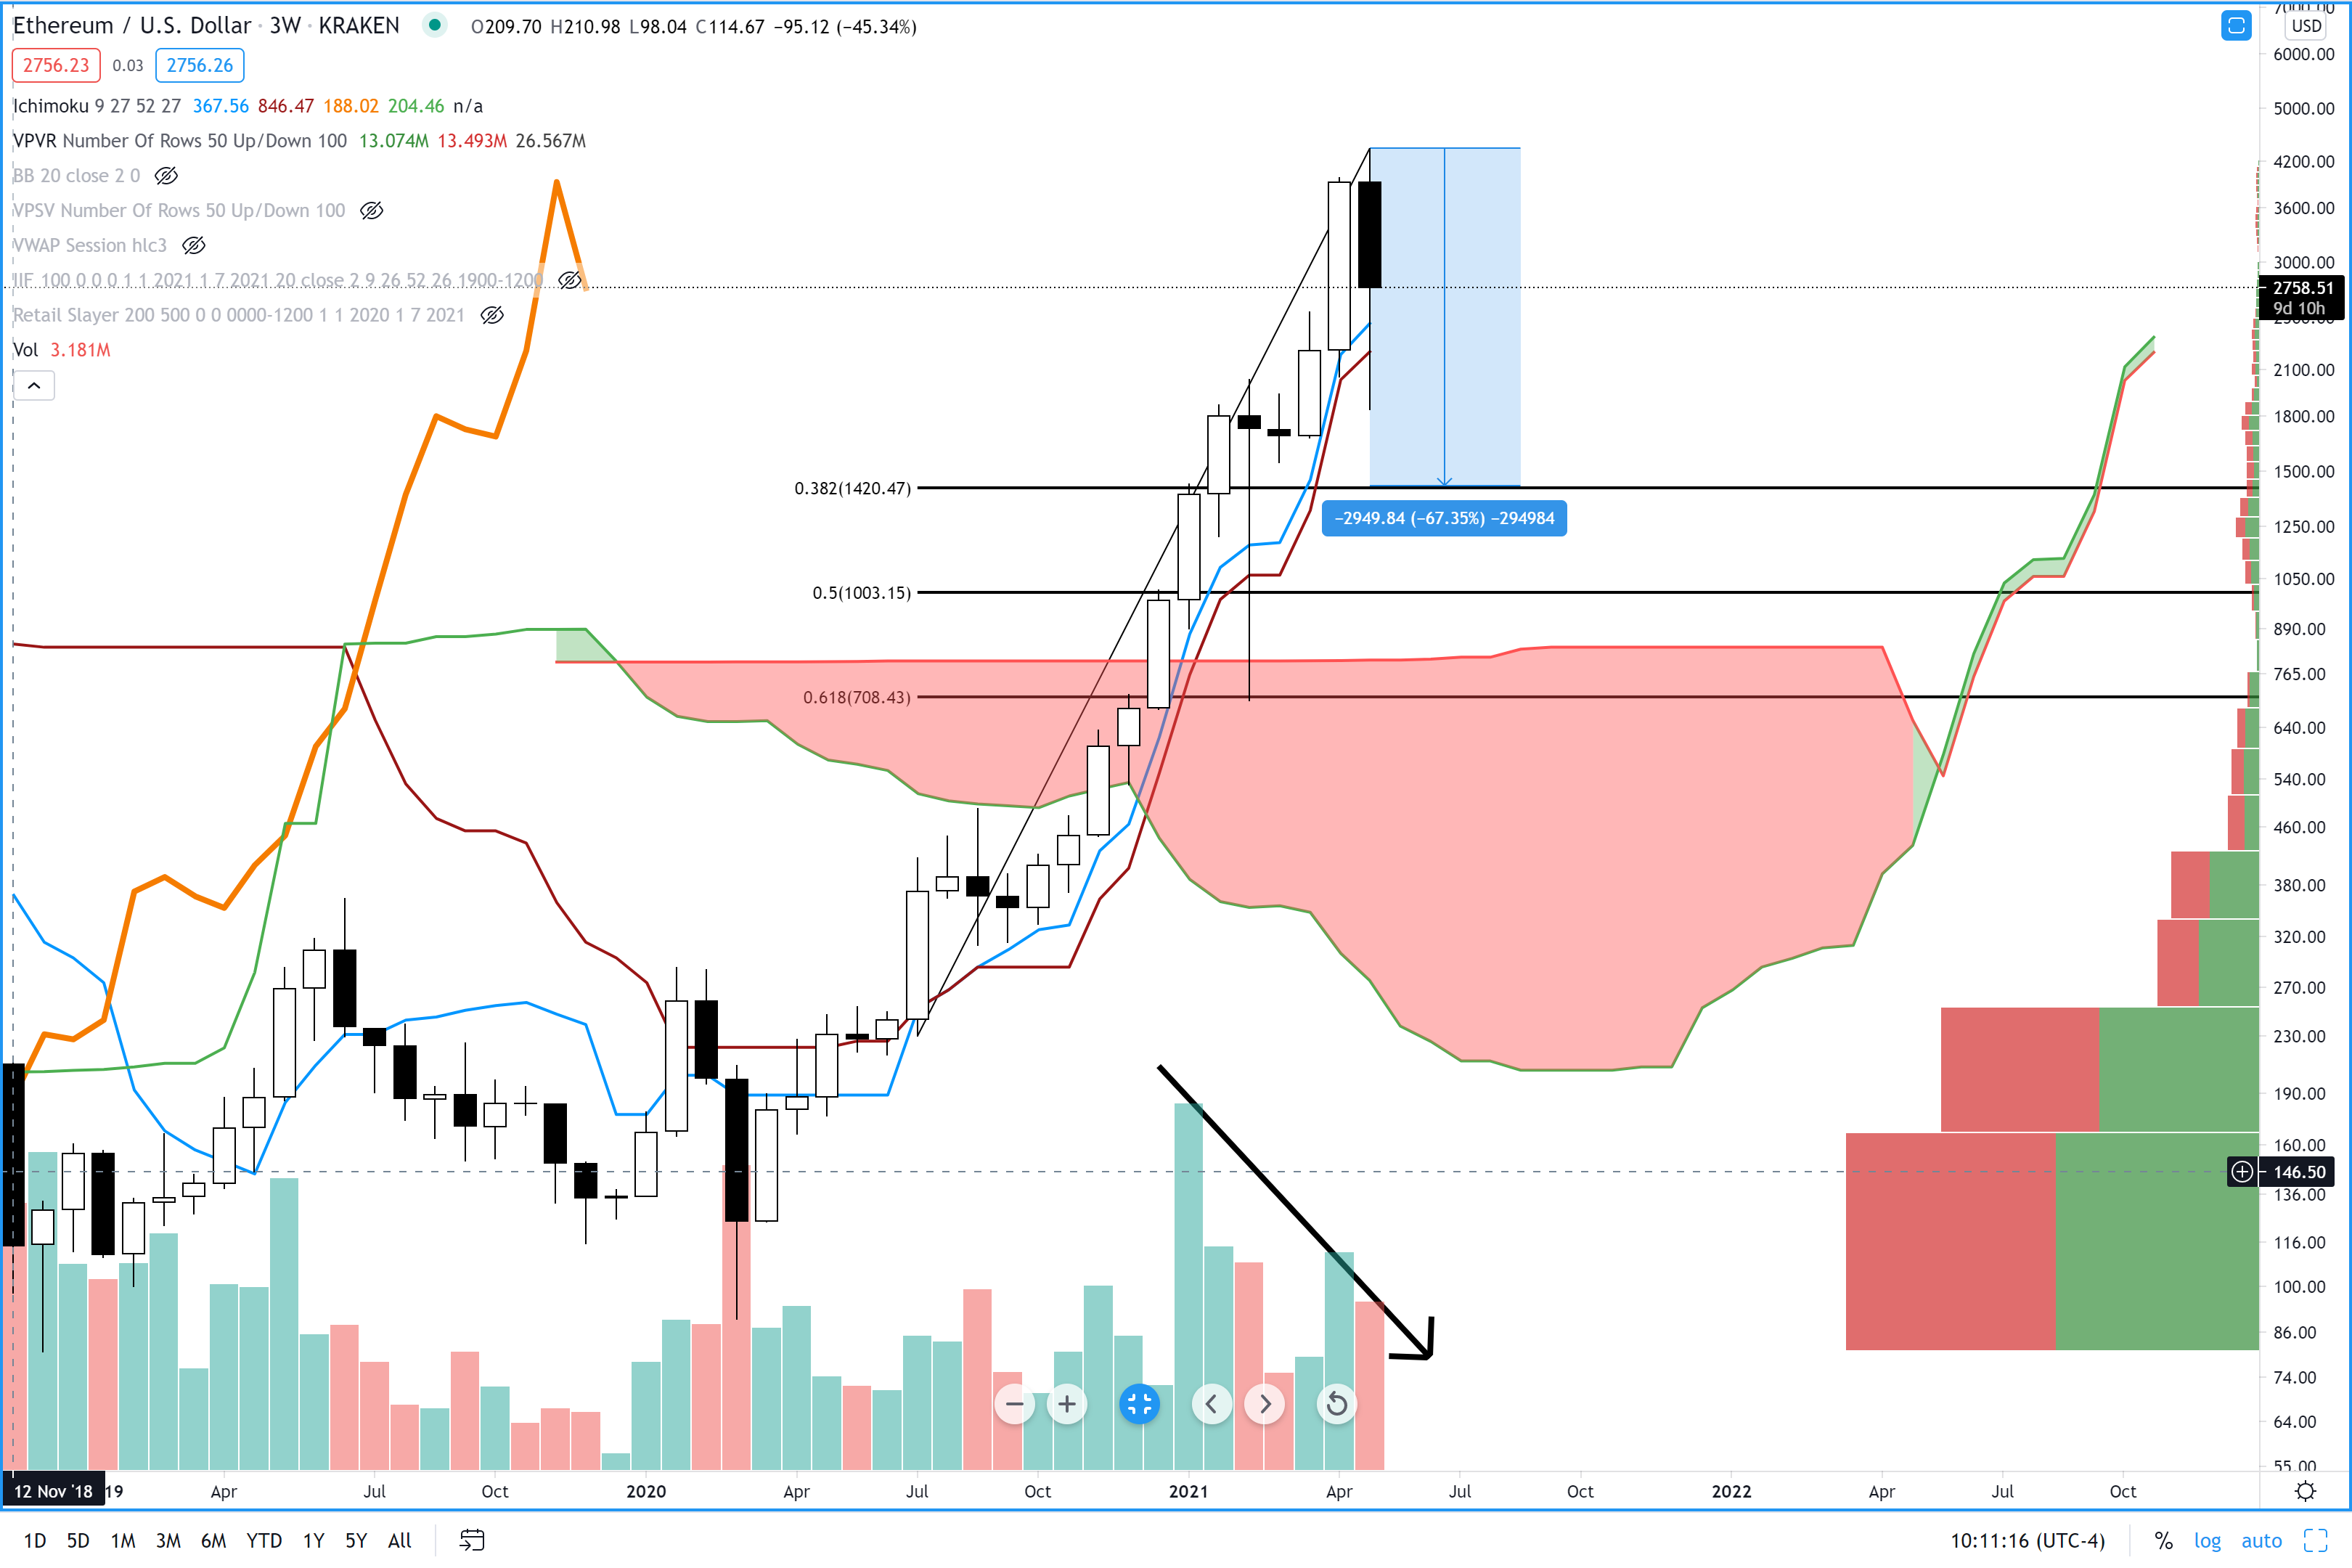
Above: Ethereum (ETHUSD) 3-Week Chart
Utilizing the 3-week chart again, Ethereum’s present setup shows us some important information. First, out of almost all the top 25 market cap cryptocurrencies (excluding stablecoins), Ethereum is singular in the fact that it hasn’t touched a primary Fibonacci Retracement level during this weeks selloff. While some of the numbers may sound a little outlandish, remember that we look at instruments like Ethereum from a logarithmic point of view – or as a measure of proportion rather than linear dollar moves. The 38.2 Fibonacci Retracement is at 1420.47, which is -67% below the current all-time high. If you really want a number that sounds outlandish, then look at the 50% retracement at 1,003. Near term though we should expect to see some support against the 3-week Tenkan-Sen and Kijun-sen (2,455 and 2,234, respectively).
Litecoin (LTCUSD)
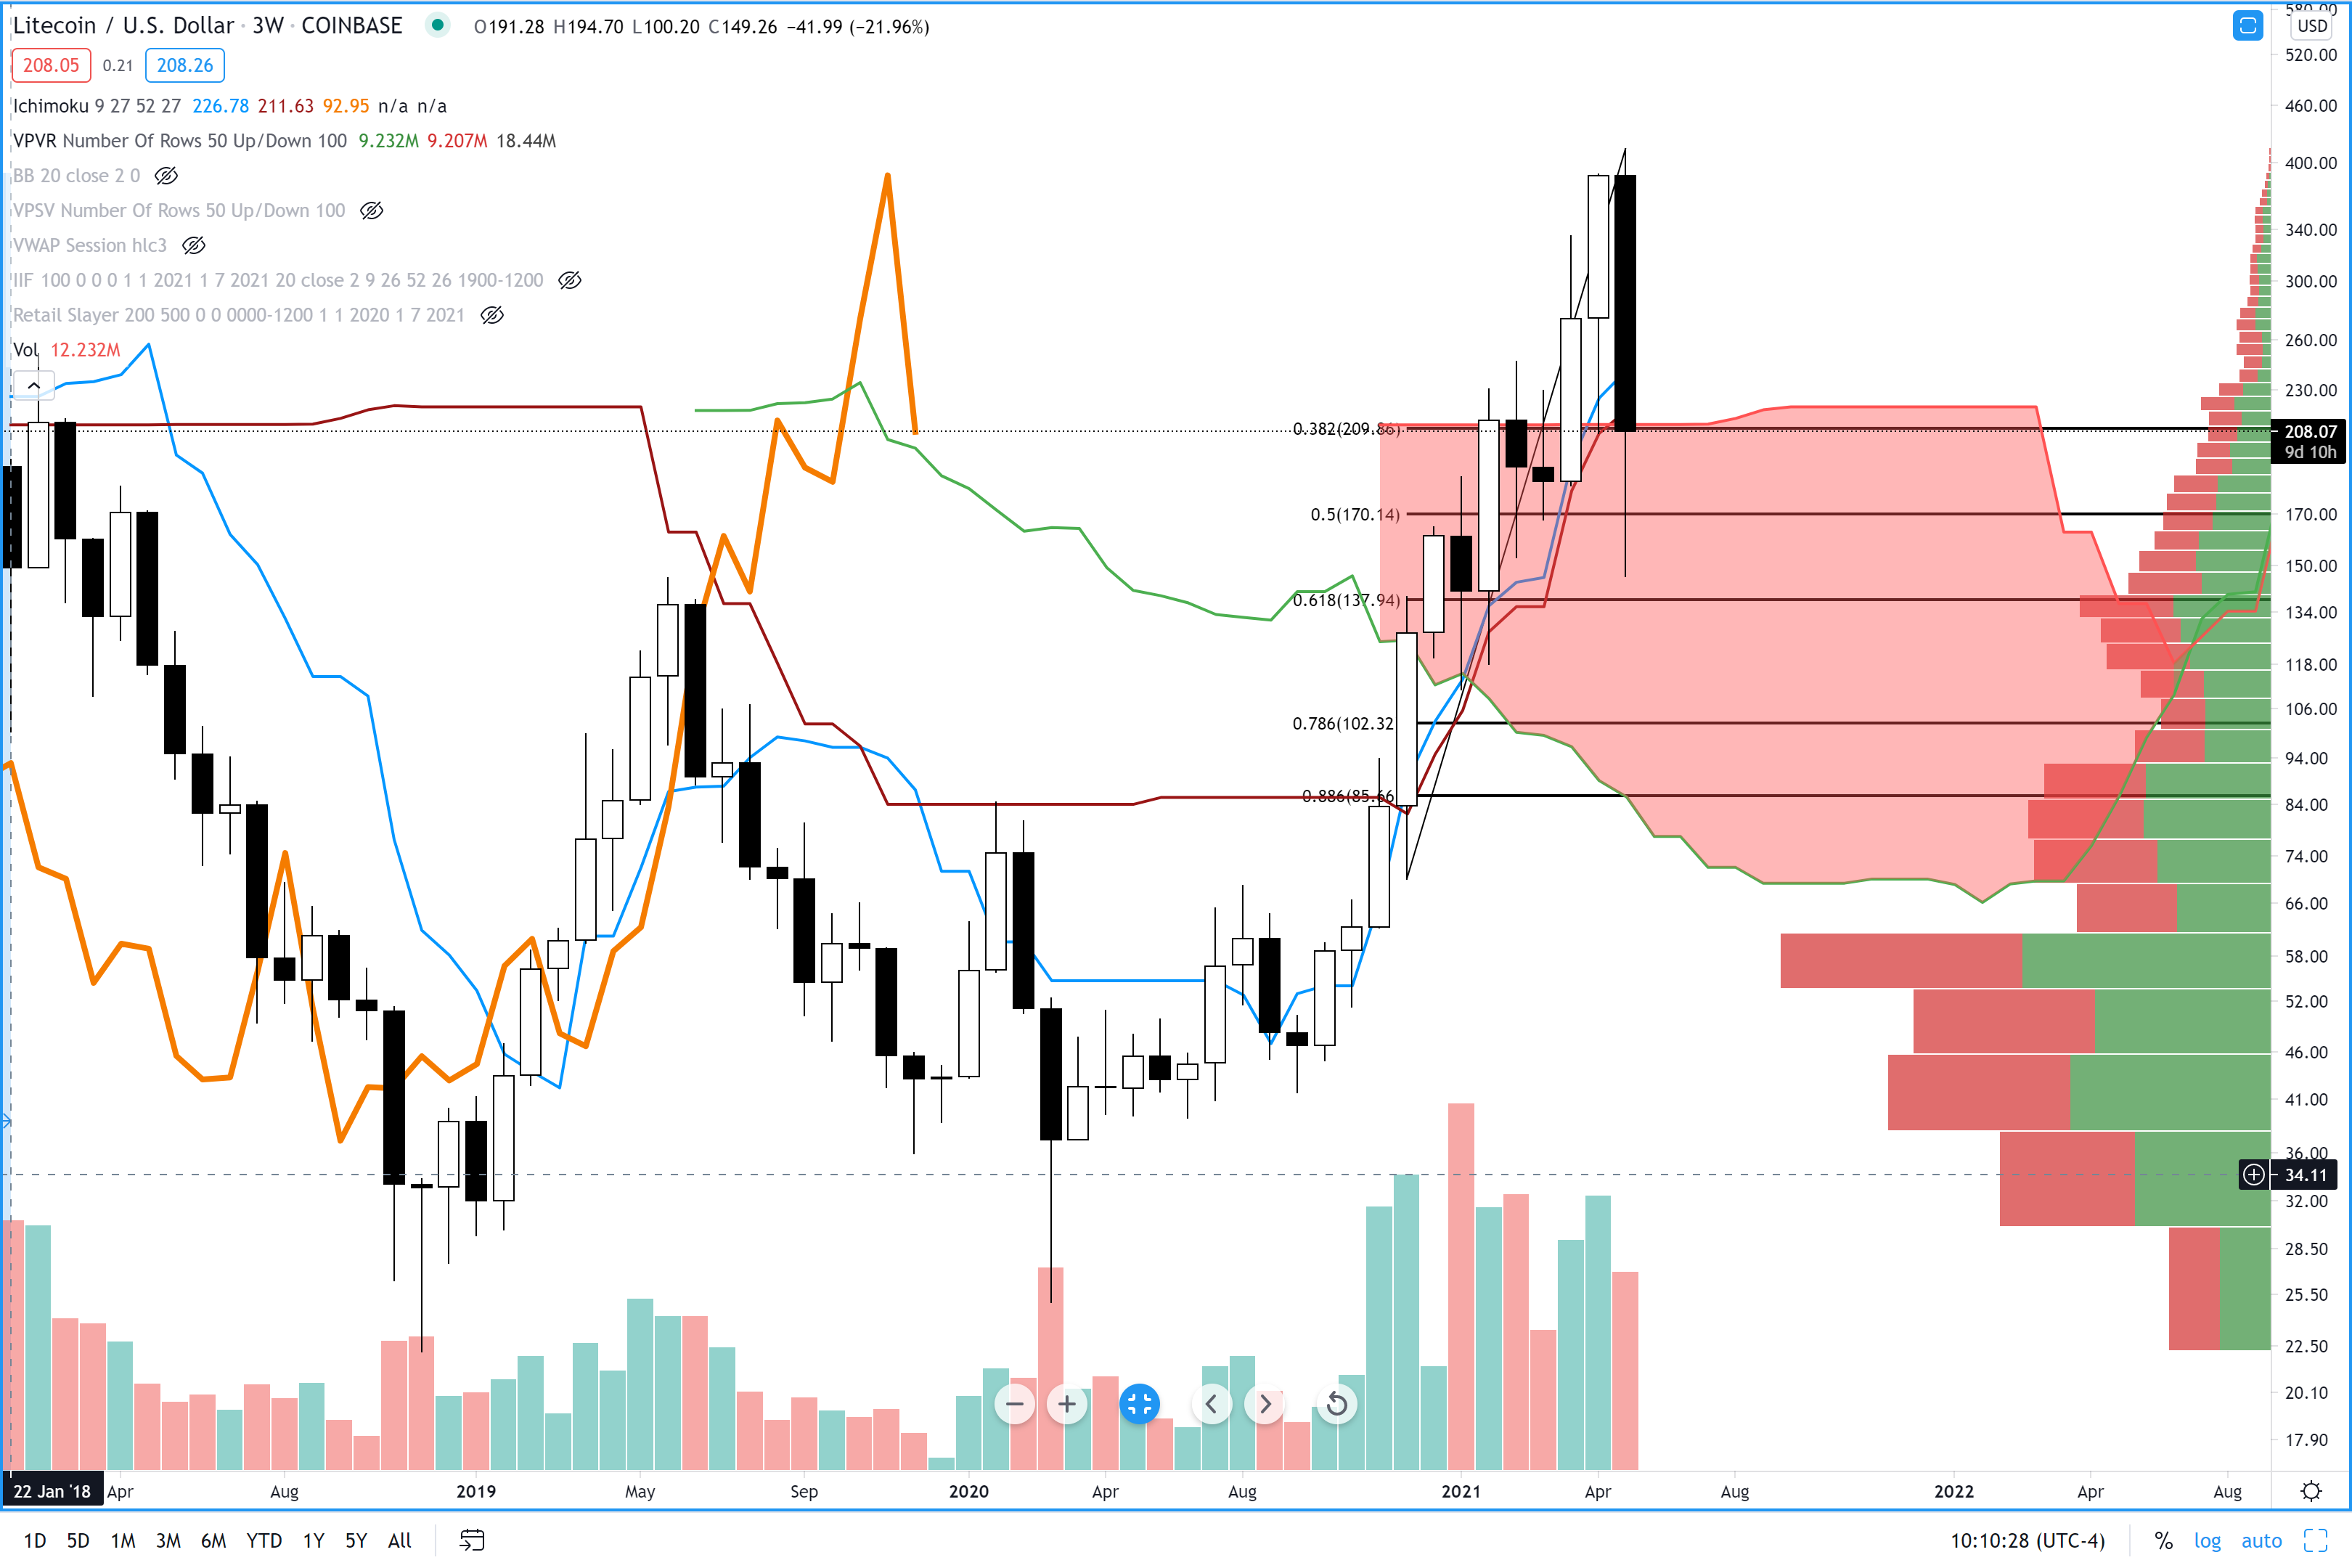
Above: Litecoin (LTCUSD) 3-Week Chart
Litecoin is still considered one of the ‘Big Three’ by institutional entities (Bitcoin, Ethereum, Litecoin). Regardless of your opinion on relevancy of Litecoin, it continues to have strong support among industry veterans and big money. The present close for Litecoin on the 3-week chart is on top of two powerful support levels: The top of the Kumo at Senkou Span B (211.81) and the 38.2 Fibonacci Retracement level at 209.86. If Litecoin spend a couple days with closes below the 209 – 2011 level, then we enter the place where trading accounts go to die: inside the cloud. At that point, I’d really only look to go long on Litecoin if it tags the bottom of the cloud at Senkou Span A (77.77) and the 88.6% Fibonacci Retracement at 85.6.