
XRP/USD – XRP Falls 37% From Last Weeks Highs
Key Support Levels: $1.20, $1.12, $1.05.
Key Resistance Levels: $1.30, $1.50, $1.70.
XRP went on an epic bullish run last week as the coin surged almost 100% as it pushed above $1.00 to reach the 2021 high at $1.98. Since then, XRPP has dropped by a total of 35% to reach the current price.
During the Bitcoin crash on Sunday, XRP dropped as low as $1.12, where it found support at the 20-days MA. From there, it rebounded to close the week at $1.40. Over the past couple of days, XRP continued to dip again as it dropped beneath the support at $1.29 (.382 Fib) today to reach as low as $1.15. The buyers have since regrouped to bring XRP to the current price, but the bearish momentum is still in place for the short term.
XRP-USD Short Term Price Prediction
Looking ahead,the first support lies at $1.20 (20-days MA). This is followed by $1.12 (.5 Fib), $1.05 (downside 1.618 Fib Extension), $1.00, and $0.95 (.618 Fib).
On the other side, the first resistance lies at $1.30. This is followed by $1.50, $1.70, and $1.77 (1.272 Fib Extension).
The RSI dipped beneath the midline on Sunday, indicating that the bears are controlling the market momentum. Since then, it has continued to fall as the bearish momentum starts to increase.
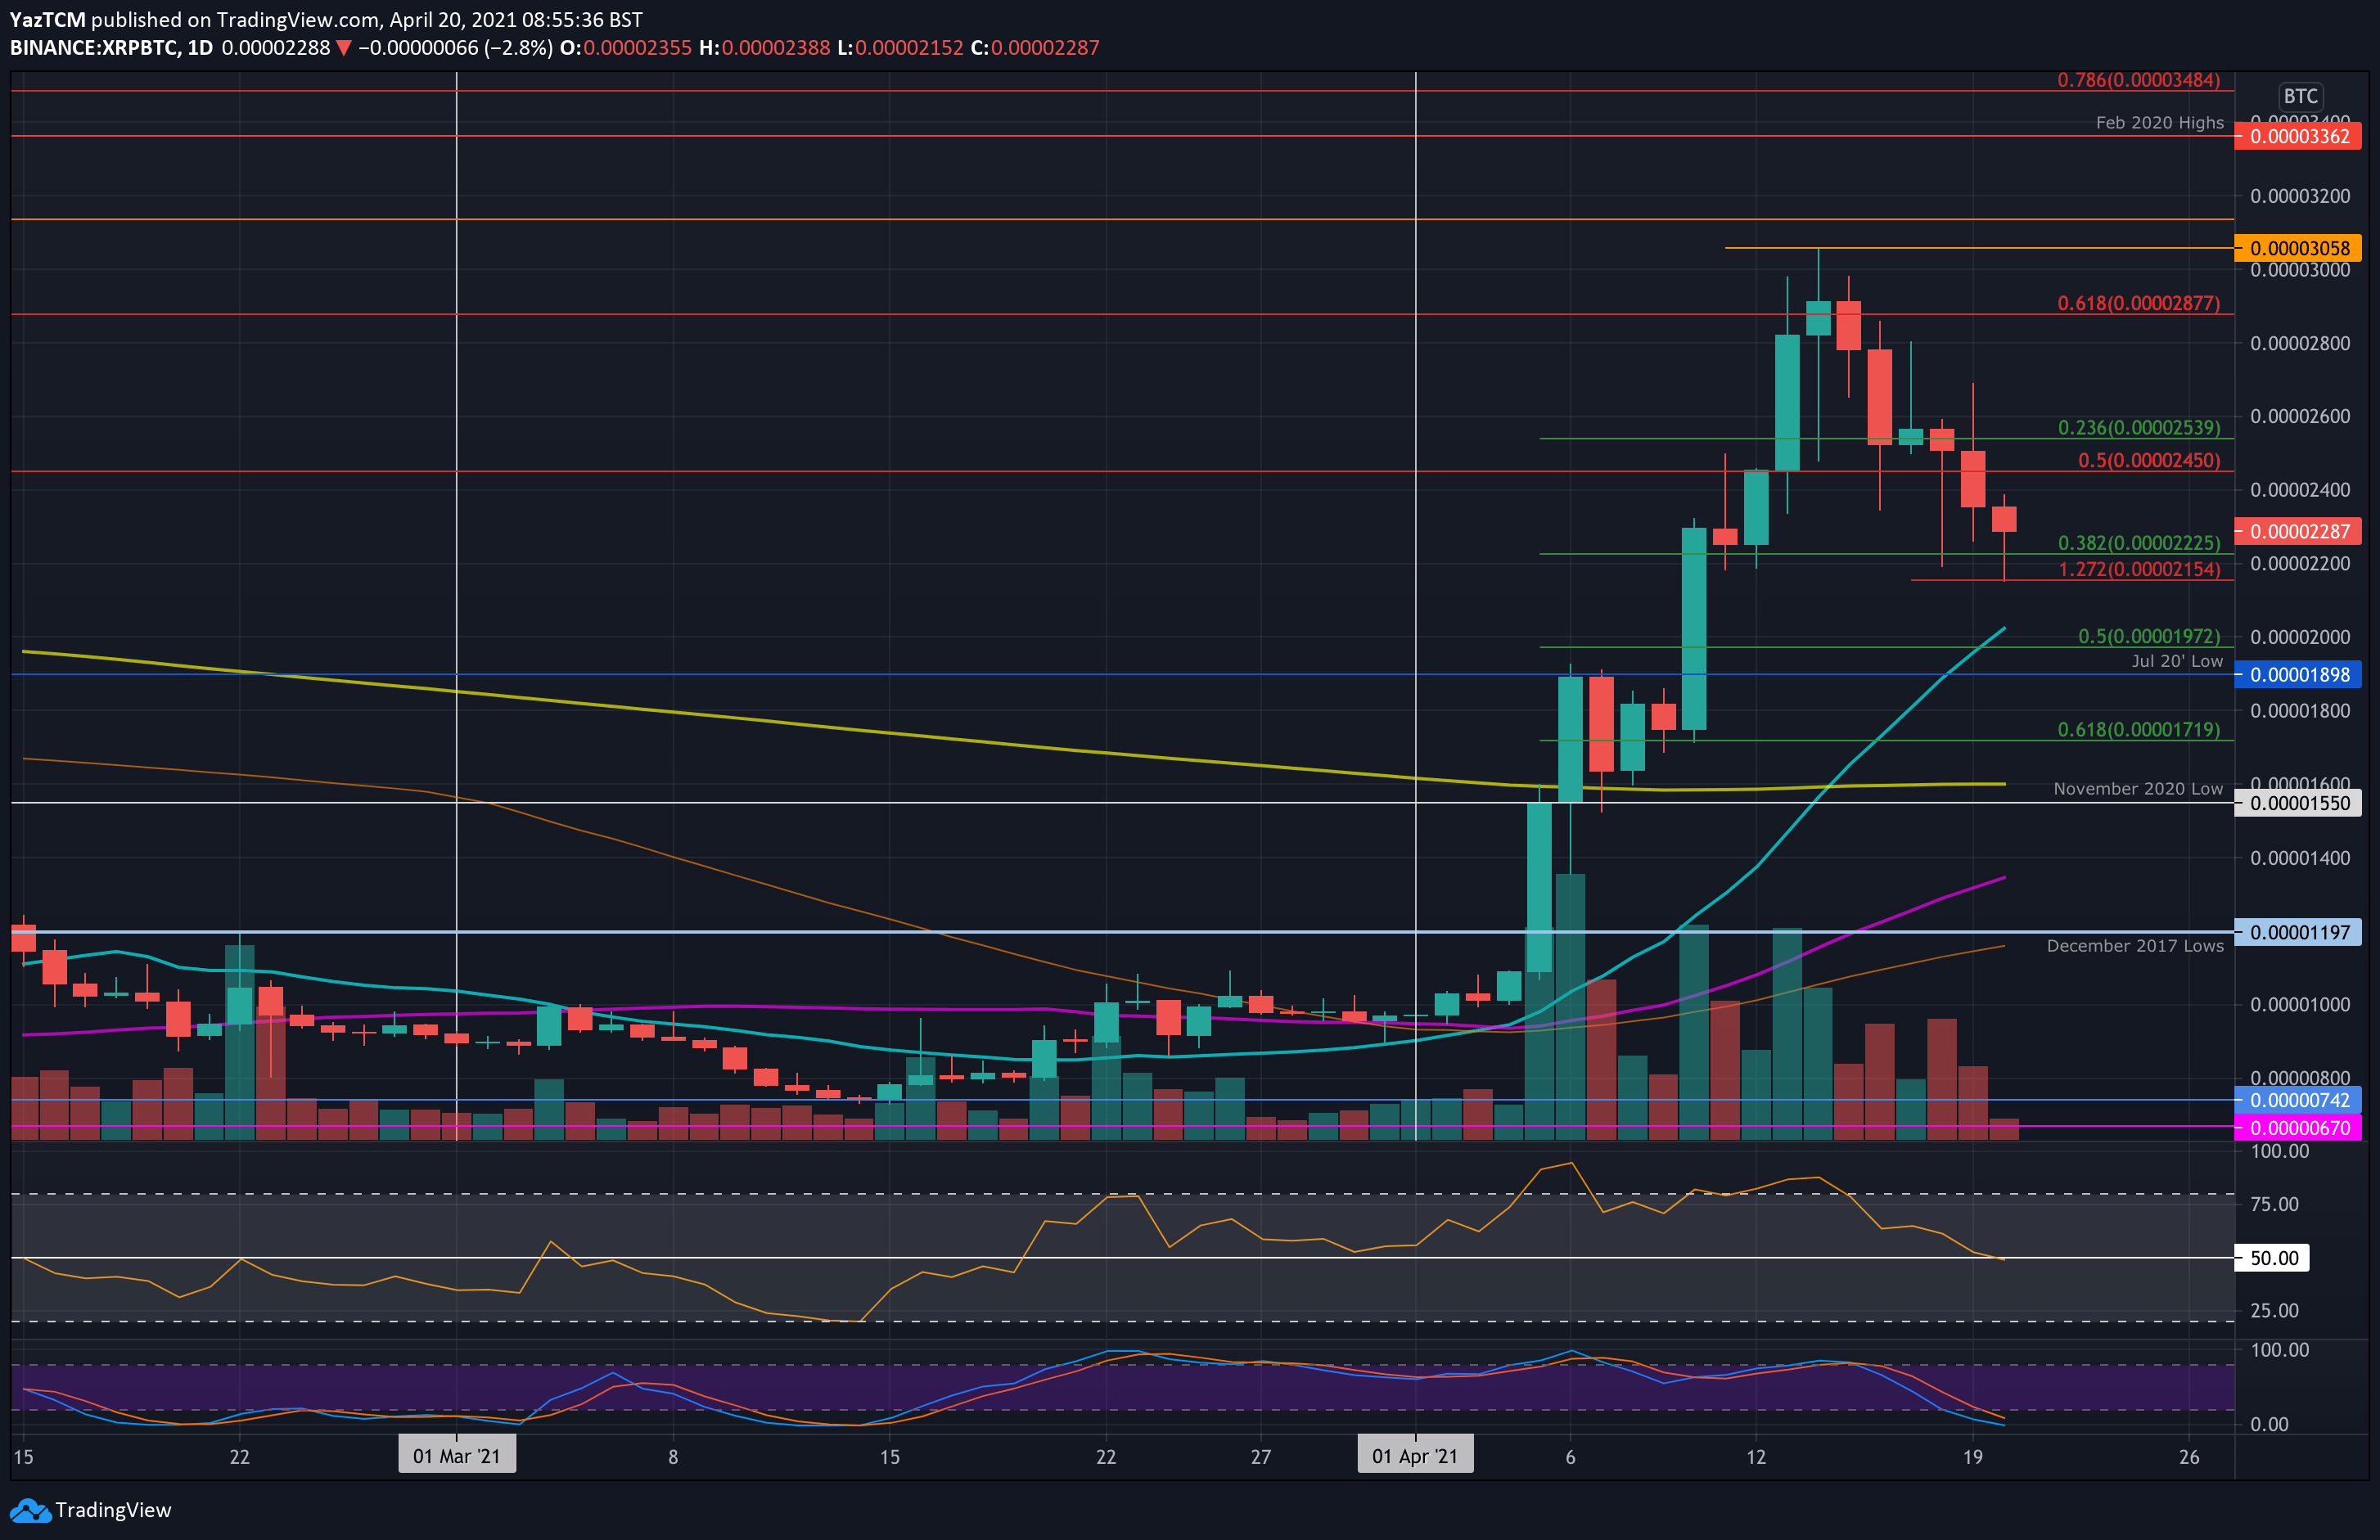
XRP/BTC – Bulls Battle to Remain Above .382 Fib Support at 2225 SAT.
Key Support Levels: 2225 SAT, 2155 SAT, 2000 SAT.
Key Resistance Levels: 2400 SAT, 2600 SAT, 2800 SAT.
Against Bitcoin, XRP is also trending lower since setting a 2021 high at 3058 SAT last week. Initially, it was holding above support at 2500 SAT, but this was penetrated during the Sunday crash.
Today, XRP continued beneath 2400 SAT to reach as low as 2155 SAT. There, it found support at a downside 1.272 Fib Extension and rebounded back above support at 2225 SAT (.382 Fib). A closing candle beneath this support is likely to bring XRP beneath 2000 SAT.
XRP-BTC Short Term Price Prediction
Looking ahead, the first support lies at 2225 SAT (.382 Fib). This is closely followed by 2155 SAT (downside 1.272 Fib Extension), 2000 SAT (20-days MA & .5 Fib), 1900 SAT (July 2020 low), and 1720 SAT (.618 Fib).
On the other side, the first resistance lies at 2400 SAT. This is followed by 2600 SAT, 2800 SAT, and 3000 SAT.
The RSI is at the midline for XRP/BTC, indicating indecision within the market. The bears have not quite taken control of the momentum just yet, but the previous bullish momentum has disappeared. A break beneath the 50 level will see XRP heading back to 2000 SAT.
Binance Futures 50 USDT FREE Voucher: Use this link to register & get 10% off fees and 50 USDT when trading 500 USDT (limited offer).
PrimeXBT Special Offer: Use this link to register & enter POTATO50 code to get 50% free bonus on any deposit up to 1 BTC.
Disclaimer: Information found on CryptoPotato is those of writers quoted. It does not represent the opinions of CryptoPotato on whether to buy, sell, or hold any investments. You are advised to conduct your own research before making any investment decisions. Use provided information at your own risk. See Disclaimer for more information.
Cryptocurrency charts by TradingView.