
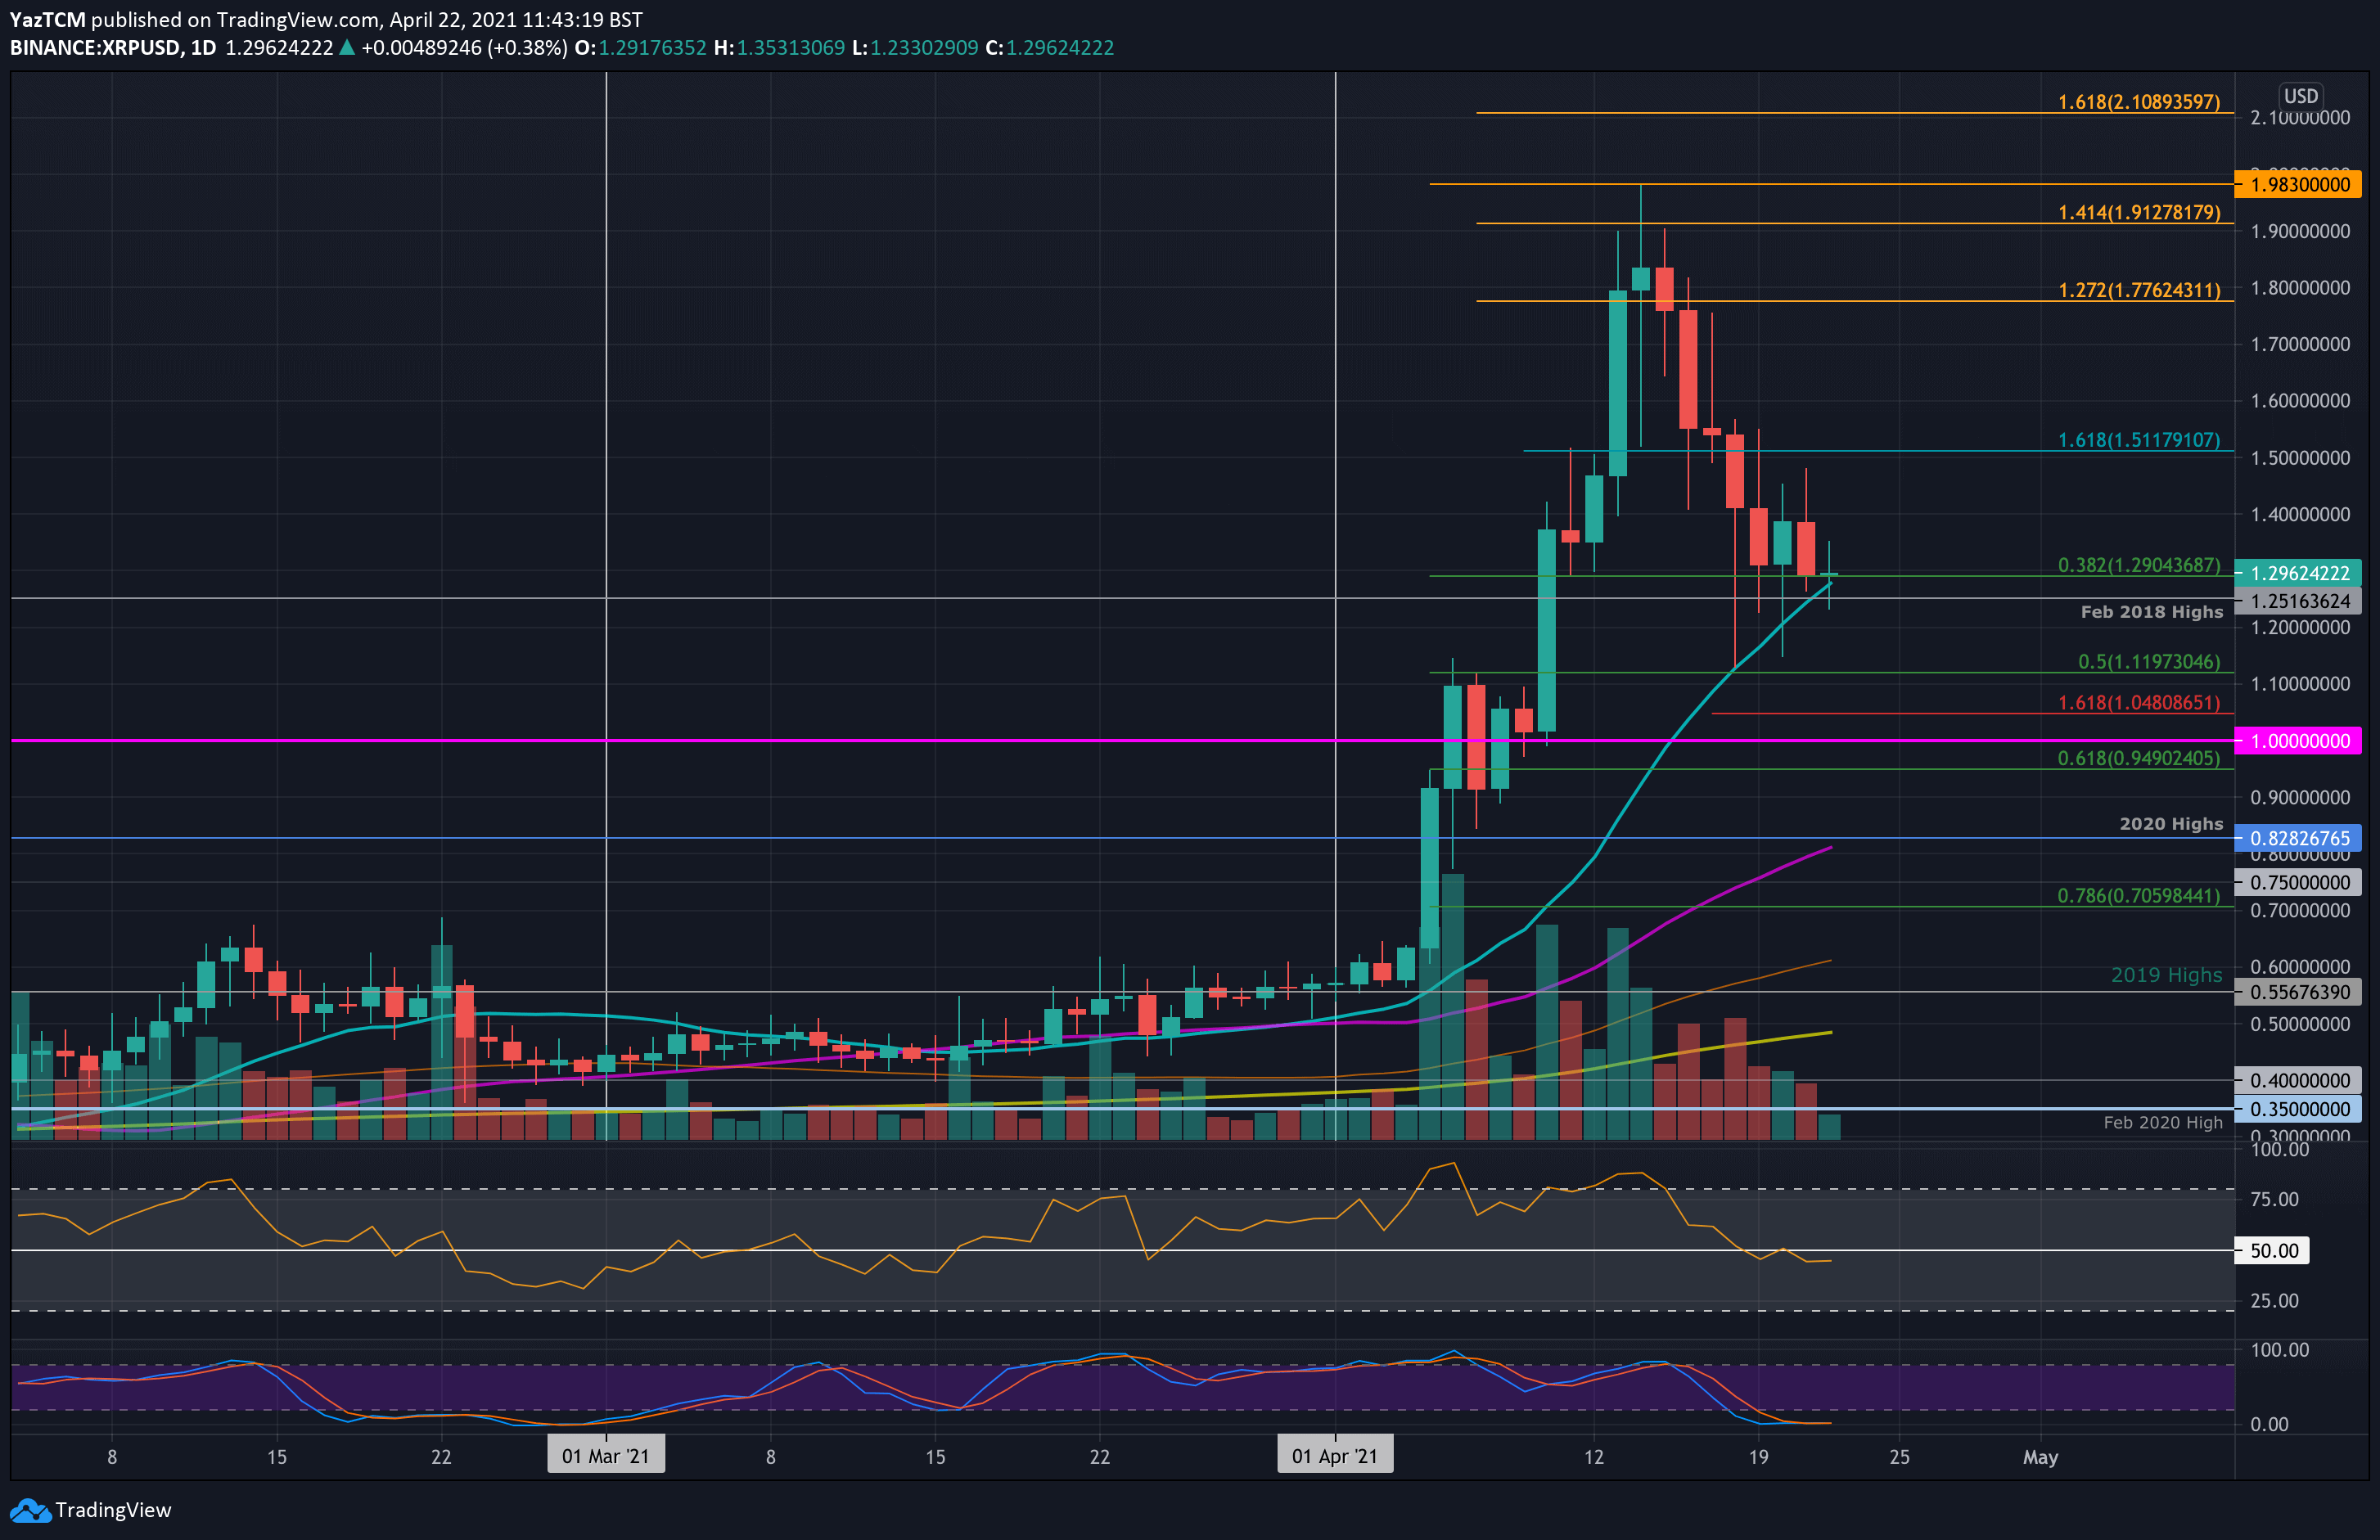
XRP/USD – Bulls Battle To Stay Above .382 Fib & 20-days MA
Key Support Levels: $1.29, $1.25, $1.12.
Key Resistance Levels: $1.40, $1.50, $1.77.
XRP might be down 28% this week, but it seems the bulls have found solid support at $1.29, provided by a .382 Fib. XRP has closed each daily candle above this support for the past four days, and it is now further bolstered by the 20-days MA.
On Sunday, bitcoin suffered a significant price drop which caused the entire market to head lower. During that time, XRP dropped as low as $1.12, where it found support at a .5 Fib and the 20-days MA. It rebounded from there to close Sunday’s daily candle above $1.40 and has since established the support at $1.29.
XRP-USD Short Term Price Prediction
Looking ahead, if the sellers break the support at $1.29, the first support beneath lies at $1.25 (Feb 2018 highs). This is followed by $1.12 (.5 Fib), $1.00, and $0.95 (.618 Fib).
On the other side, the first resistance lies at $1.40. This is followed by $1.50, $1.77 (1.272 Fib Extension), and $1.98 (2021 highs).
The daily RSI is marginally beneath the midline, indicating indecision within the market. If it continues to dip further, the increased bullish momentum is likely to drive XRP beneath the 20-days MA. Luckily, the Stochastic RSI is extremely oversold and is primed for a bullish crossover signal that might help the bull’s case.
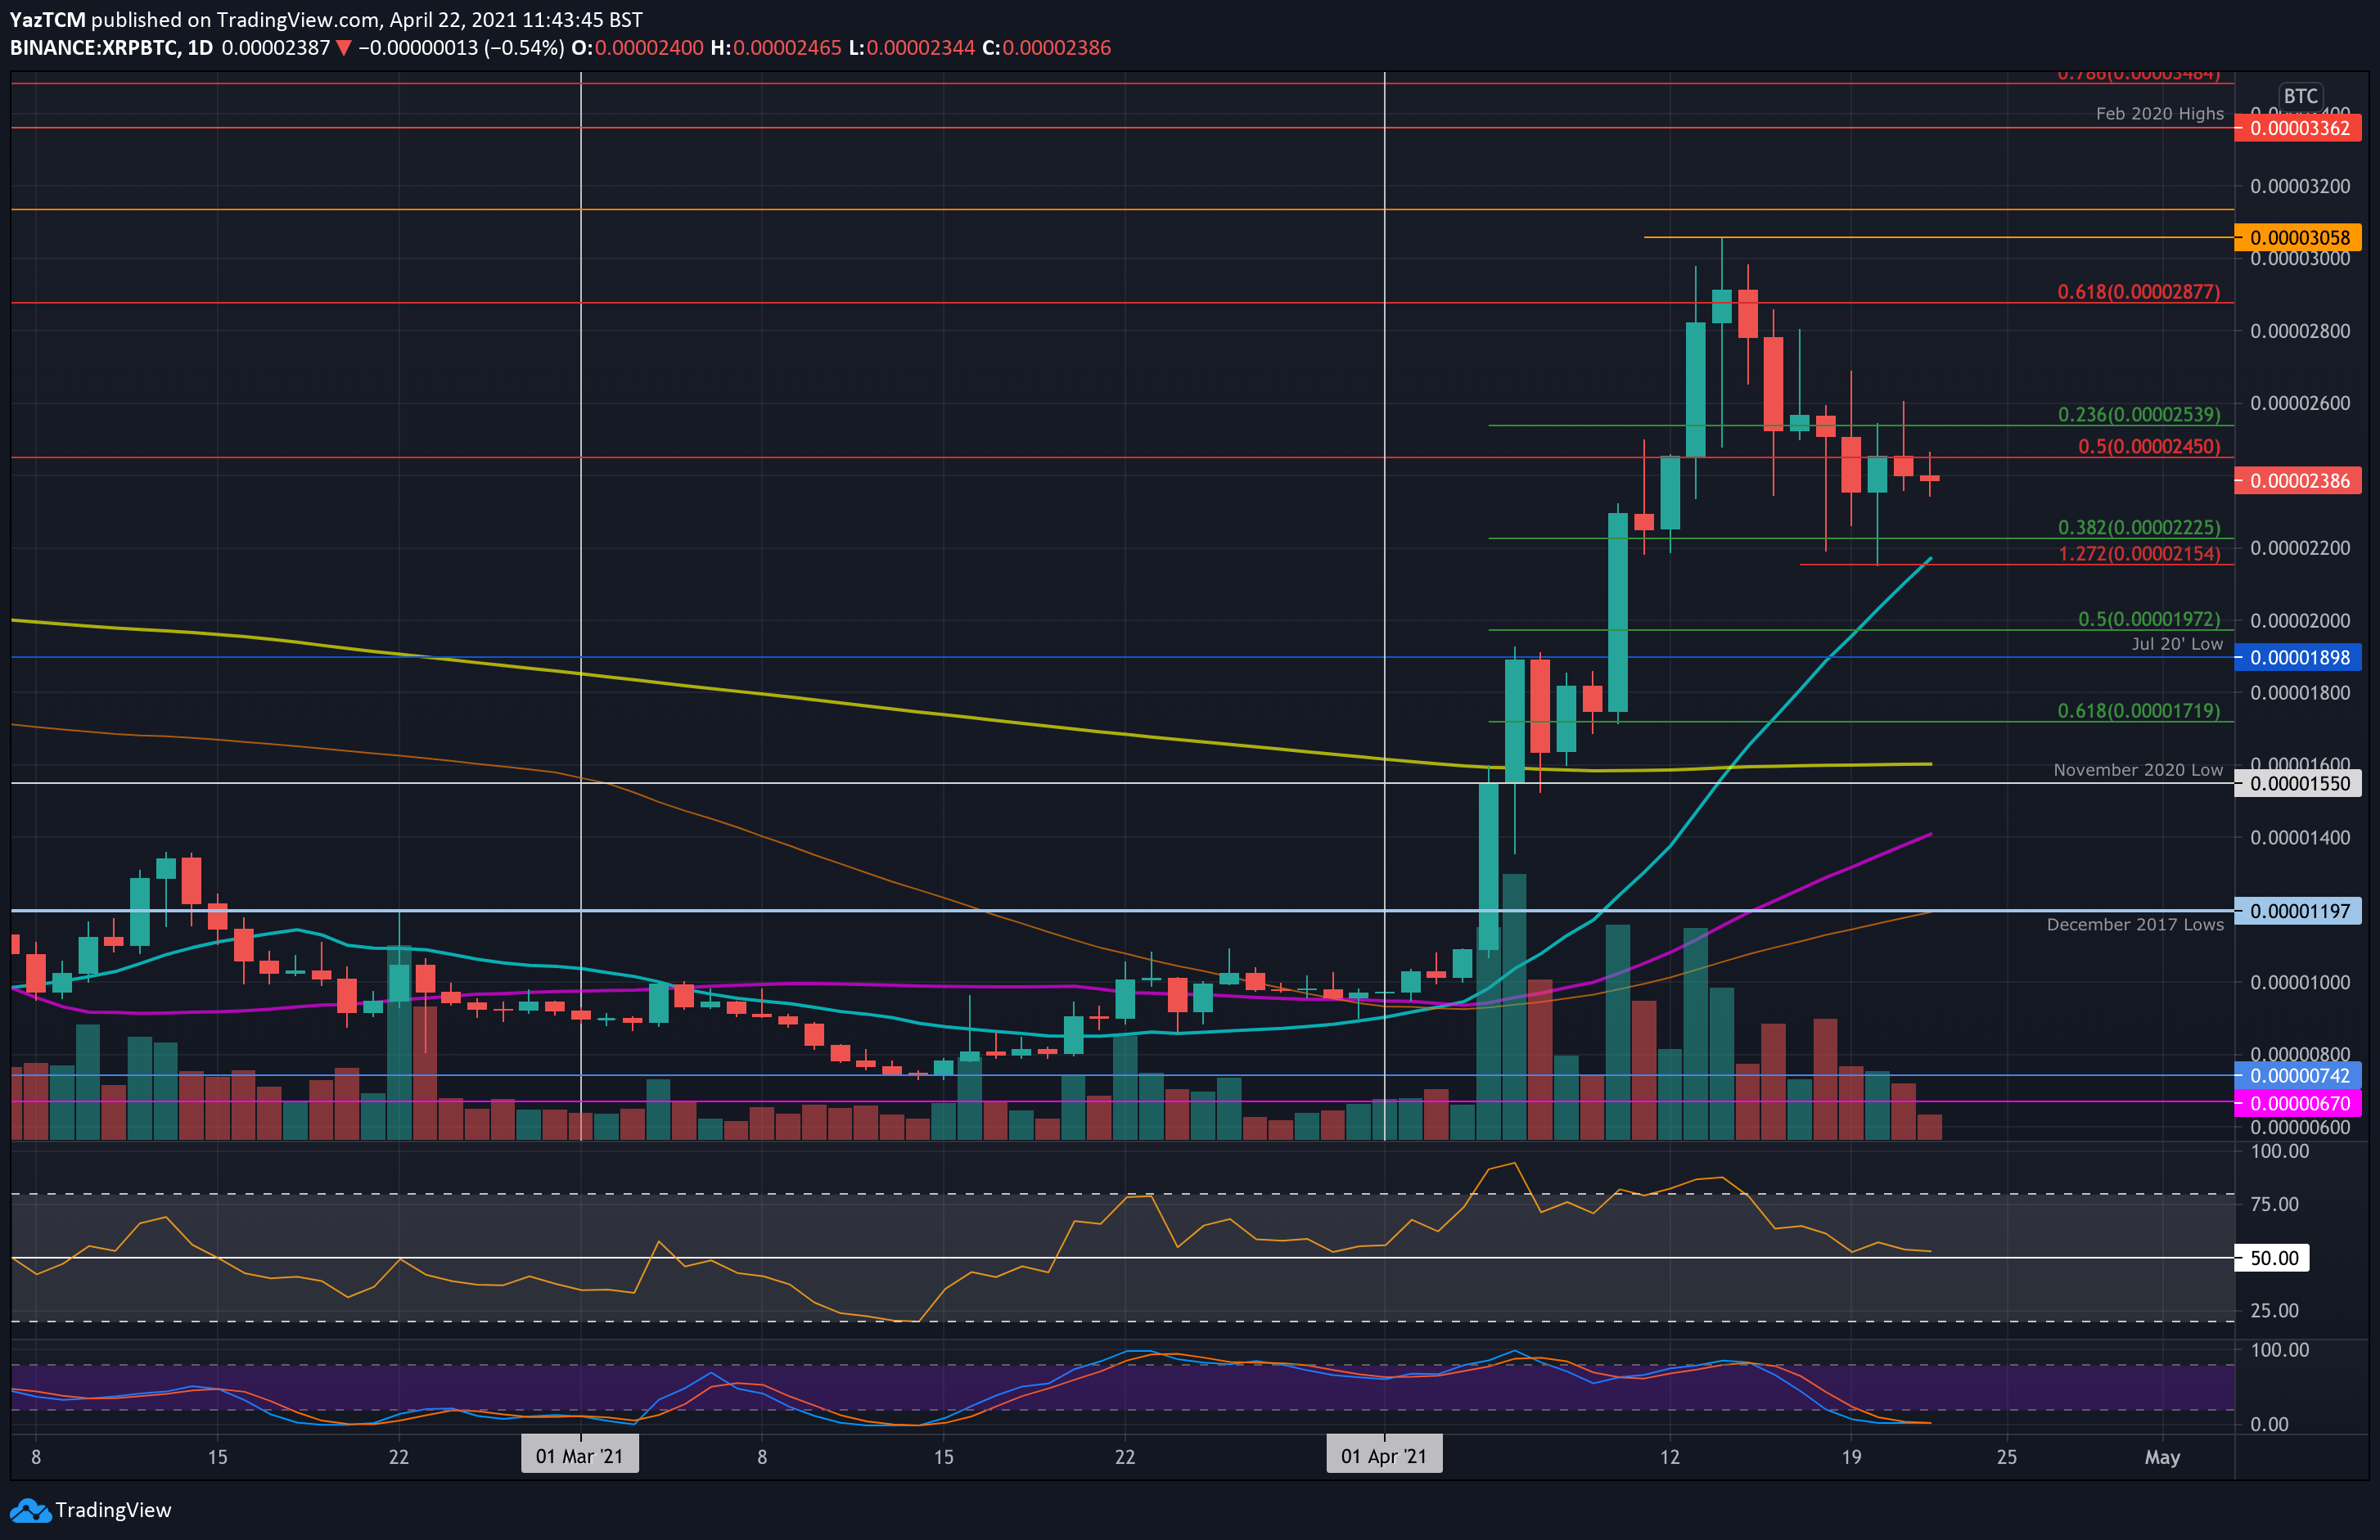
XRP/BTC: Buyers Fight To Remain In Control Of The Momentum.
Key Support Levels: 2225 SAT, 2155 SAT, 2000 SAT.
Key Resistance Levels: 2450 SAT, 2600 SAT, 2877 SAT.
Against Bitcoin, XRP had clocked a new 2021 high at 3060 SAT last week but has been falling since. The cryptocurrency fell as low as 2155 SAT (downside 1.272 Fib Extension) on Tuesday but quickly recovered to the resistance at 2450 SAT (bearish .5 Fib).
Unfortunately, the bulls could not break back above 2450 SAT and have since lost grounds beneath 2400 SAT as they attempt to regain the level.
XRP-BTC Short Term Price Prediction
Looking ahead, the first support lies at 2225 SAT (.382 Fib). This is closely followed by 2155 SAT (downside 1.272 Fib Extension), 2000 SAT (20-days MA & .5 Fib), 1900 SAT (July 2020 low), and 1720 SAT (.618 Fib).
On the other side, the first resistance lies at 2450 SAT (bearish .5 Fib). This is followed by 2600 SAT, 2877 SAT (bearish .618 Fib), and 3000 SAT.
The RSI is at the midline for XRP/BTC, indicating indecision within the market. Likewise, it will need to rebound from the 50 level to indicate that the bullish momentum is starting to increase again. Additionally, the Stochastic RSI is also extremely oversold and is primed for a bullish crossover signal.
Binance Futures 50 USDT FREE Voucher: Use this link to register & get 10% off fees and 50 USDT when trading 500 USDT (limited offer).
PrimeXBT Special Offer: Use this link to register & enter POTATO50 code to get 50% free bonus on any deposit up to 1 BTC.
Disclaimer: Information found on CryptoPotato is those of writers quoted. It does not represent the opinions of CryptoPotato on whether to buy, sell, or hold any investments. You are advised to conduct your own research before making any investment decisions. Use provided information at your own risk. See Disclaimer for more information.
Cryptocurrency charts by TradingView.