
Bitcoin (BTC/USD), Litecoin (LTC/USD), Ethereum (ETH/USD), Technical Analysis – Talking Points
- Bitcoin approaching all-time highs after period of consolidation
- Litecoin trading in a Symmetrical Triangle, awaiting breakout
- Ethereum upside momentum fading ahead of record highs

Recommended by Daniel Dubrovsky
Get Your Free Introduction To Bitcoin Trading
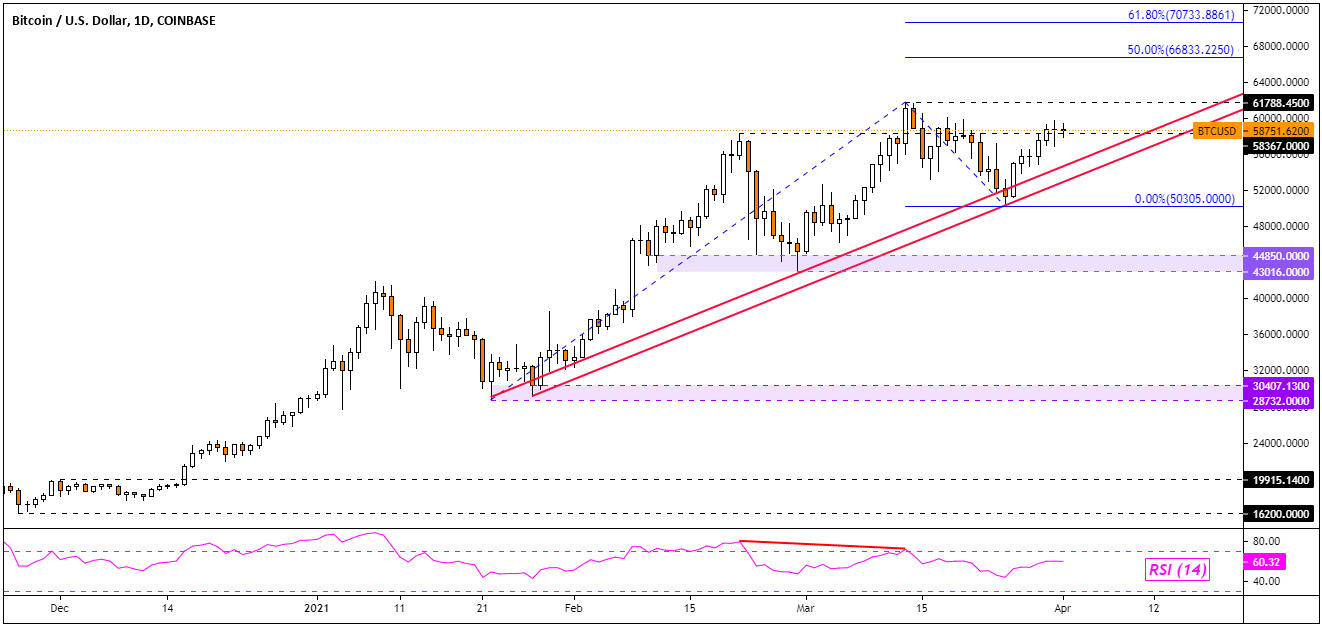
Bitcoin Technical Outlook
Bitcoin finds itself around similar levels seen during the middle of February. While the dominant uptrend continues to hold – via rising support from January on the daily chart below – the path since February 21 has been fairly choppy. The 58367 – 61788 resistance zone is now in focus, standing in the way from reaching new highs.
Keep a close eye on RSI. Earlier in March, negative divergence emerged, showing fading upside momentum. That ended up preceding a turn lower. Falling under rising support from January could pave the way to revisit 50305. Below that price sits the 43016 – 44850 support zone. Otherwise, breaking the all-time high exposes the midpoint of the Fibonacci extension at 668333.
BTC/USD – Daily Chart
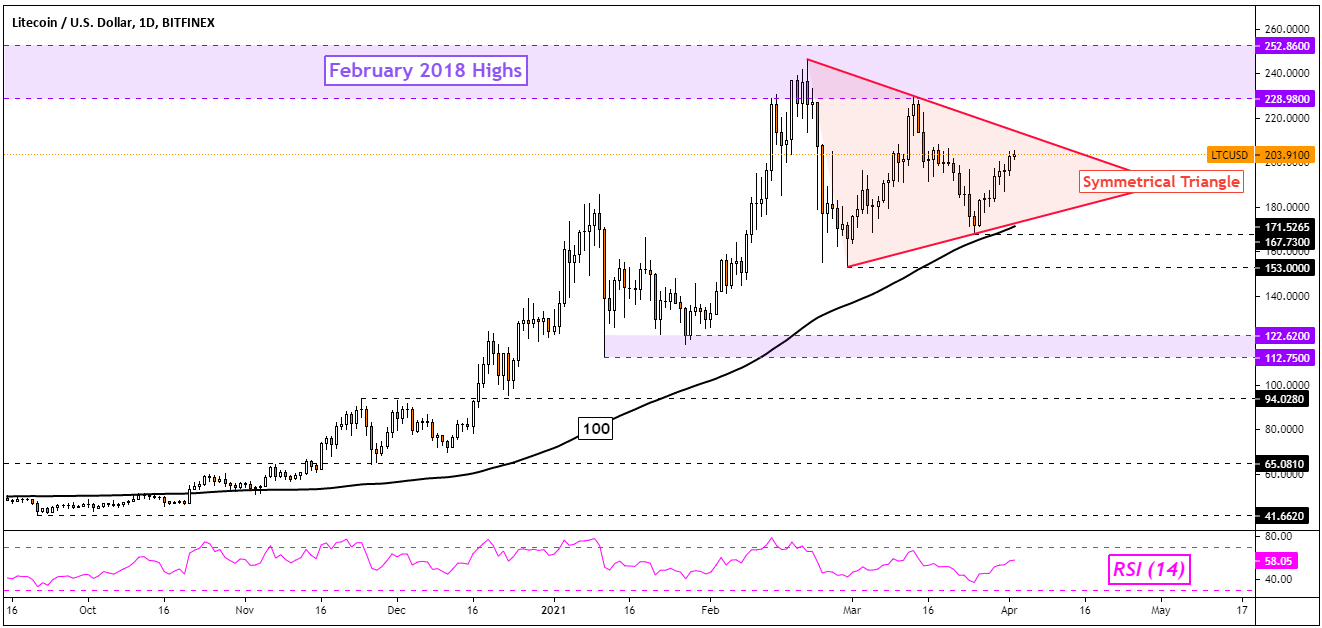
Litecoin Technical Outlook
Litecoin appears to be trading within a neutral Symmetrical Triangle chart pattern. The direction of the breakout may determine the next key move in LTC/USD. A break above the ceiling of the triangle could open the door to revisiting peaks from earlier this year. That is when Litecoin topped as it struggled to push above highs from February 2018 – see chart below.
On the other hand, Litecoin is fast approaching falling resistance. A test and hold could end up preceding a turn lower. That would place the focus on the rising floor of the triangle. The 100-day Simple Moving Average may also come into play soon as a key support point. Falling under the triangle may open the door to extending February’s top, placing the focus on lows from the same month.
Discover what kind of forex trader you are

LTC/USD – Daily Chart
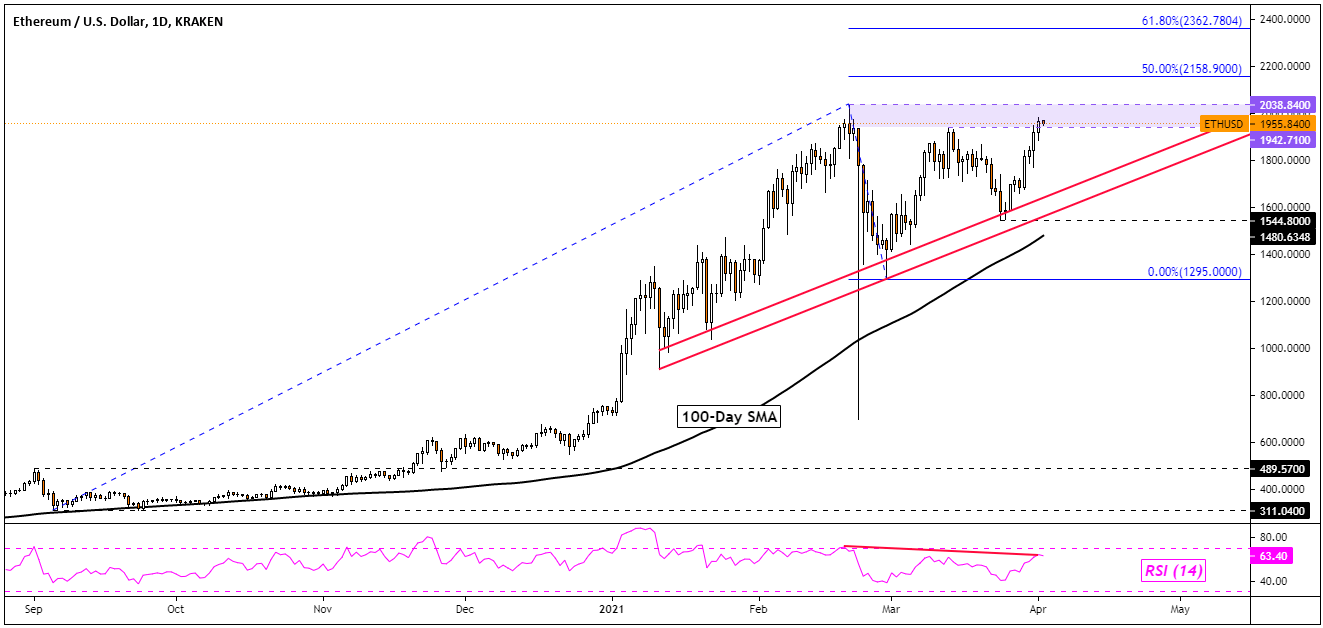
Ethereum Technical Outlook
Following choppiness since the latter half of February, Ethereum is once again testing the critical 1942 – 2038 resistance zone. Negative RSI divergence does warn that this time may be similar to last, when ETH/USD turned lower to test rising support from the beginning of the year. Such a near-term drop may not end up overturning the dominant uptrend.
Much like with Litecoin, the 100-day SMA may soon come into focus in the event of a turn lower. 1544 would also be a critical level to watch. Breaking it could pave the way to revisiting the February 28th low at 1295. Otherwise, pushing above immediate resistance exposes the midpoint of the Fibonacci extension at 2158. Above that is the 61.8% level at 2362.
ETH/USD – Daily Chart
— Written by Daniel Dubrovsky, Strategist for DailyFX.com
To contact Daniel, use the comments section below or @ddubrovskyFX on Twitter