
– Lower volume during Holiday’s often creates massive moves in crypto markets.
– Many high market cap cryptocurrencies are trading at near breakout conditions.
Cardano (ADA)
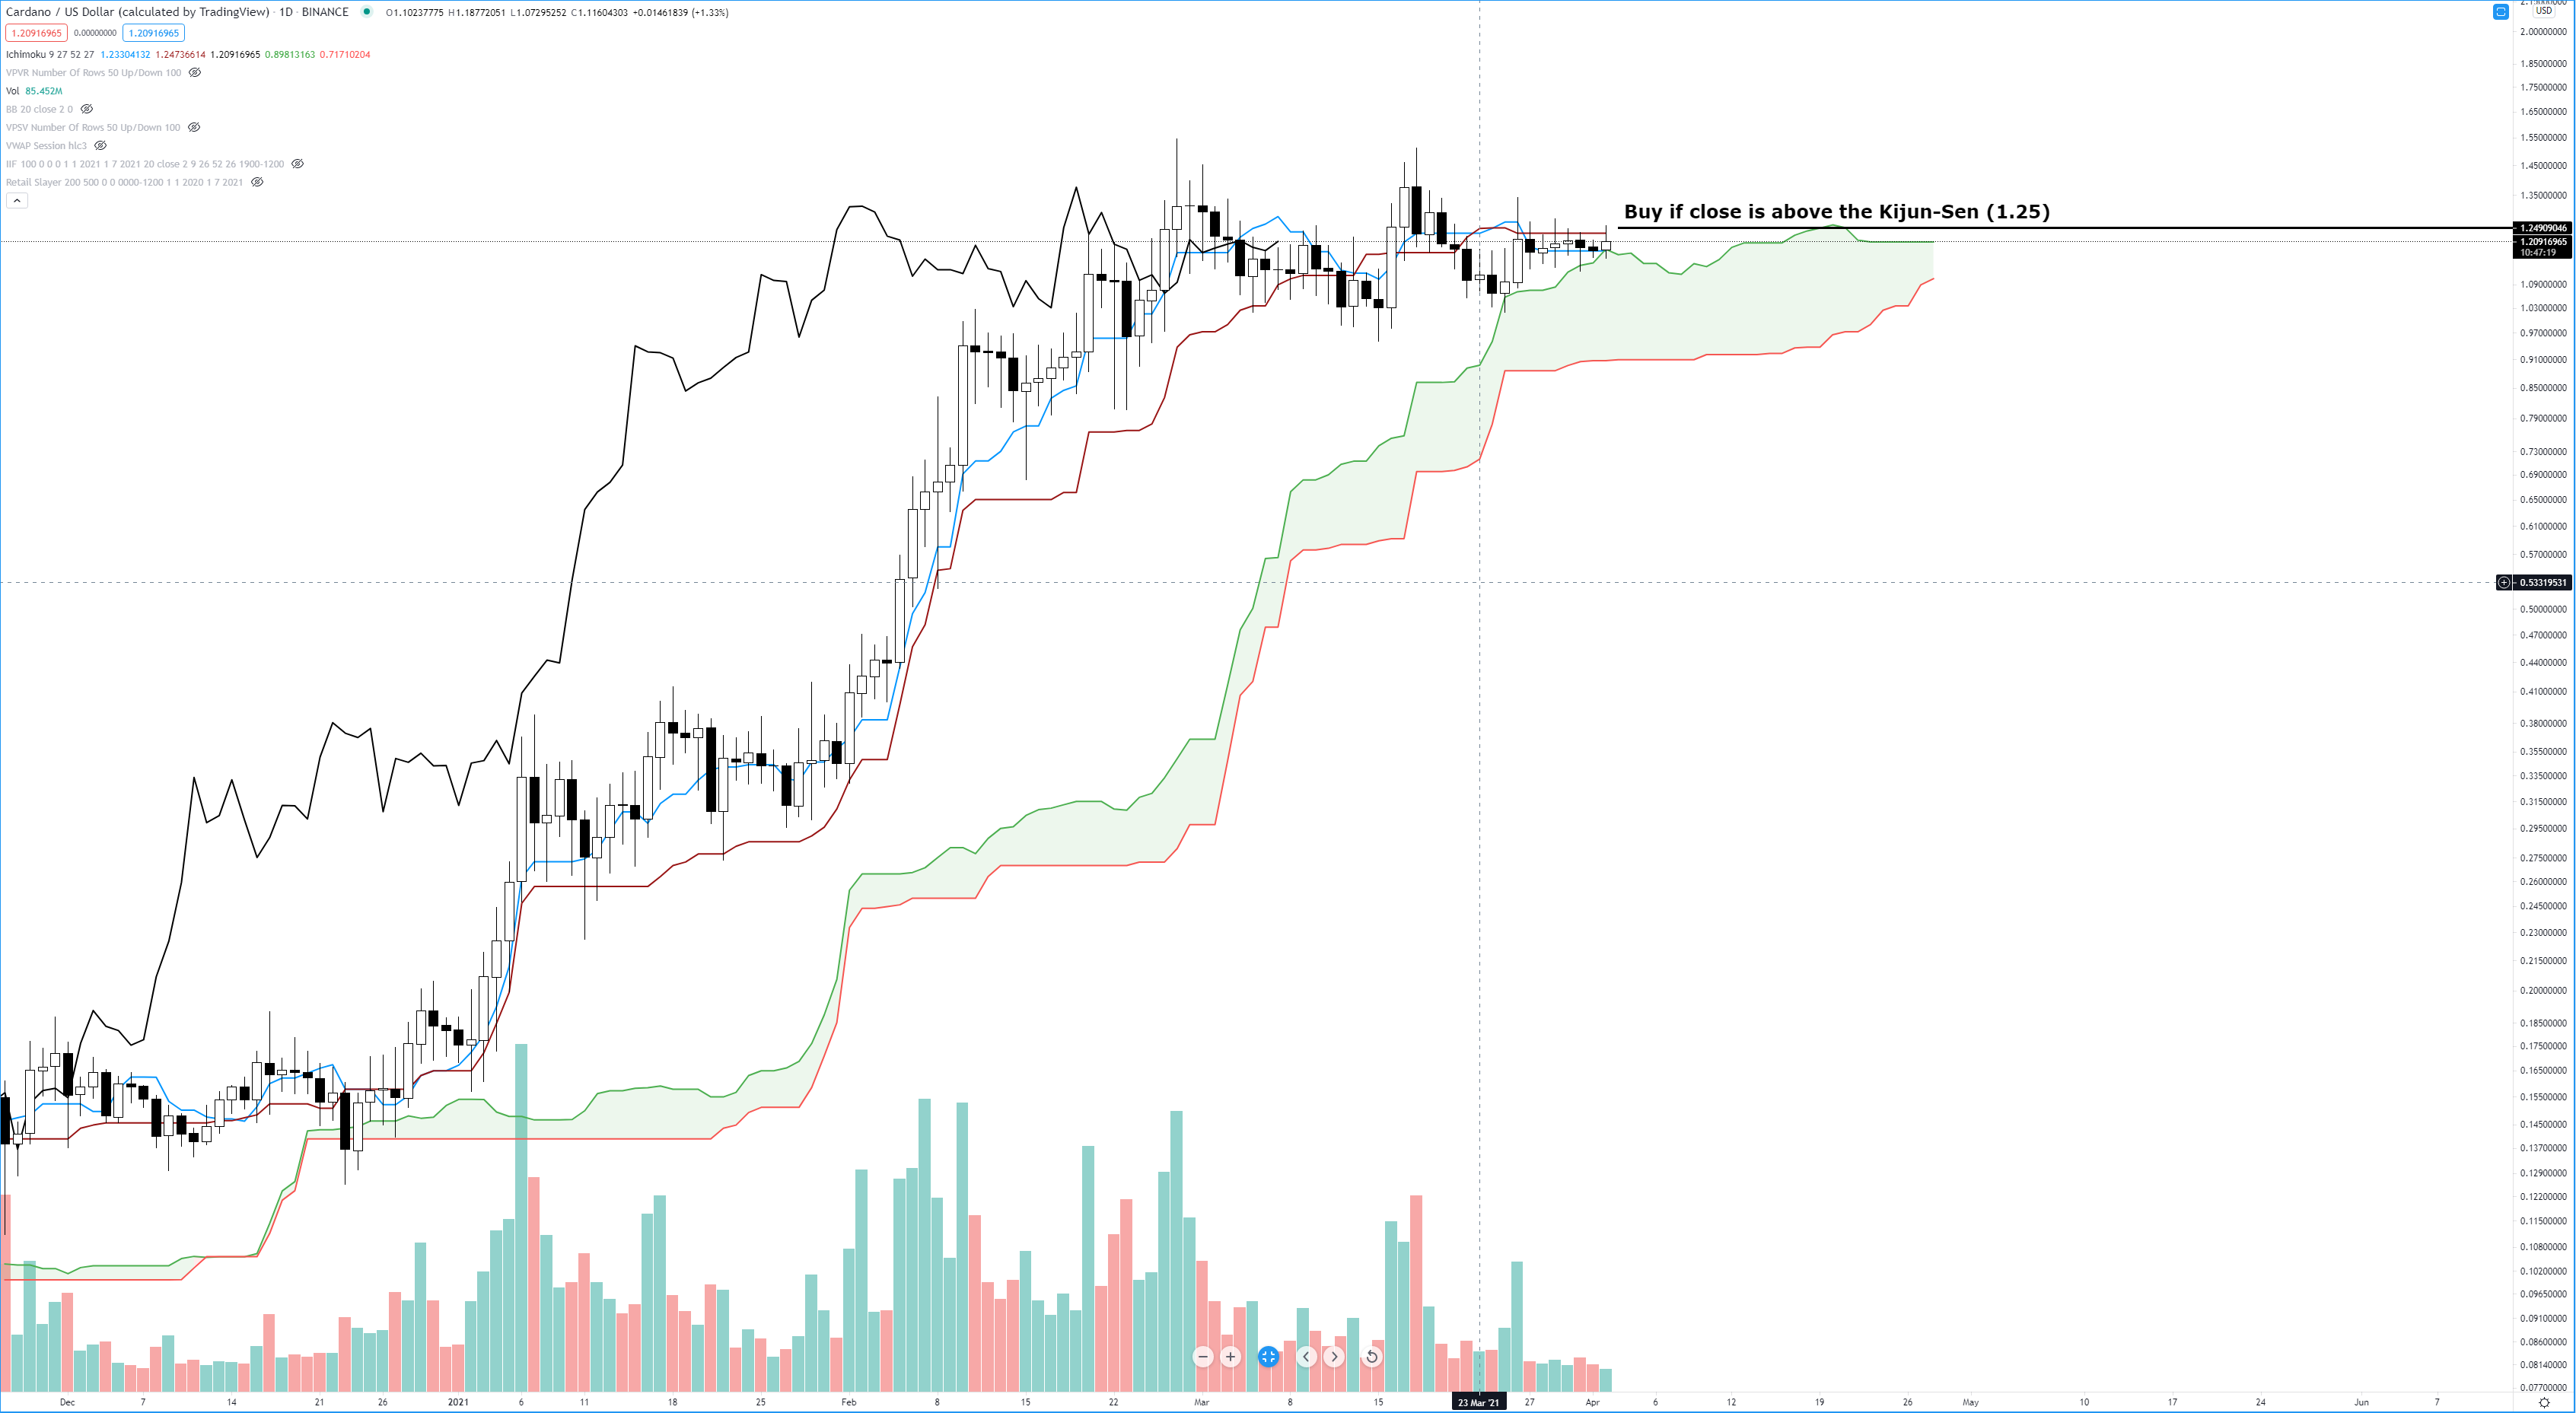
We’ve spent a good amount of time throwing some hard analysis at Cardano, providing bullish and bearish cases for months now. As we transition into the Easter weekend, Cardano is just one of many high market cap cryptocurrencies that is trading near an imminent breakout move higher. The only condition we are awaiting is a close above the daily Kijun-Sen at $1.25. Every other condition we have on the chart is pointing to a massive expansion move higher if Cardano can drive up and close at $1.25 or above.
Litecoin (LTC)
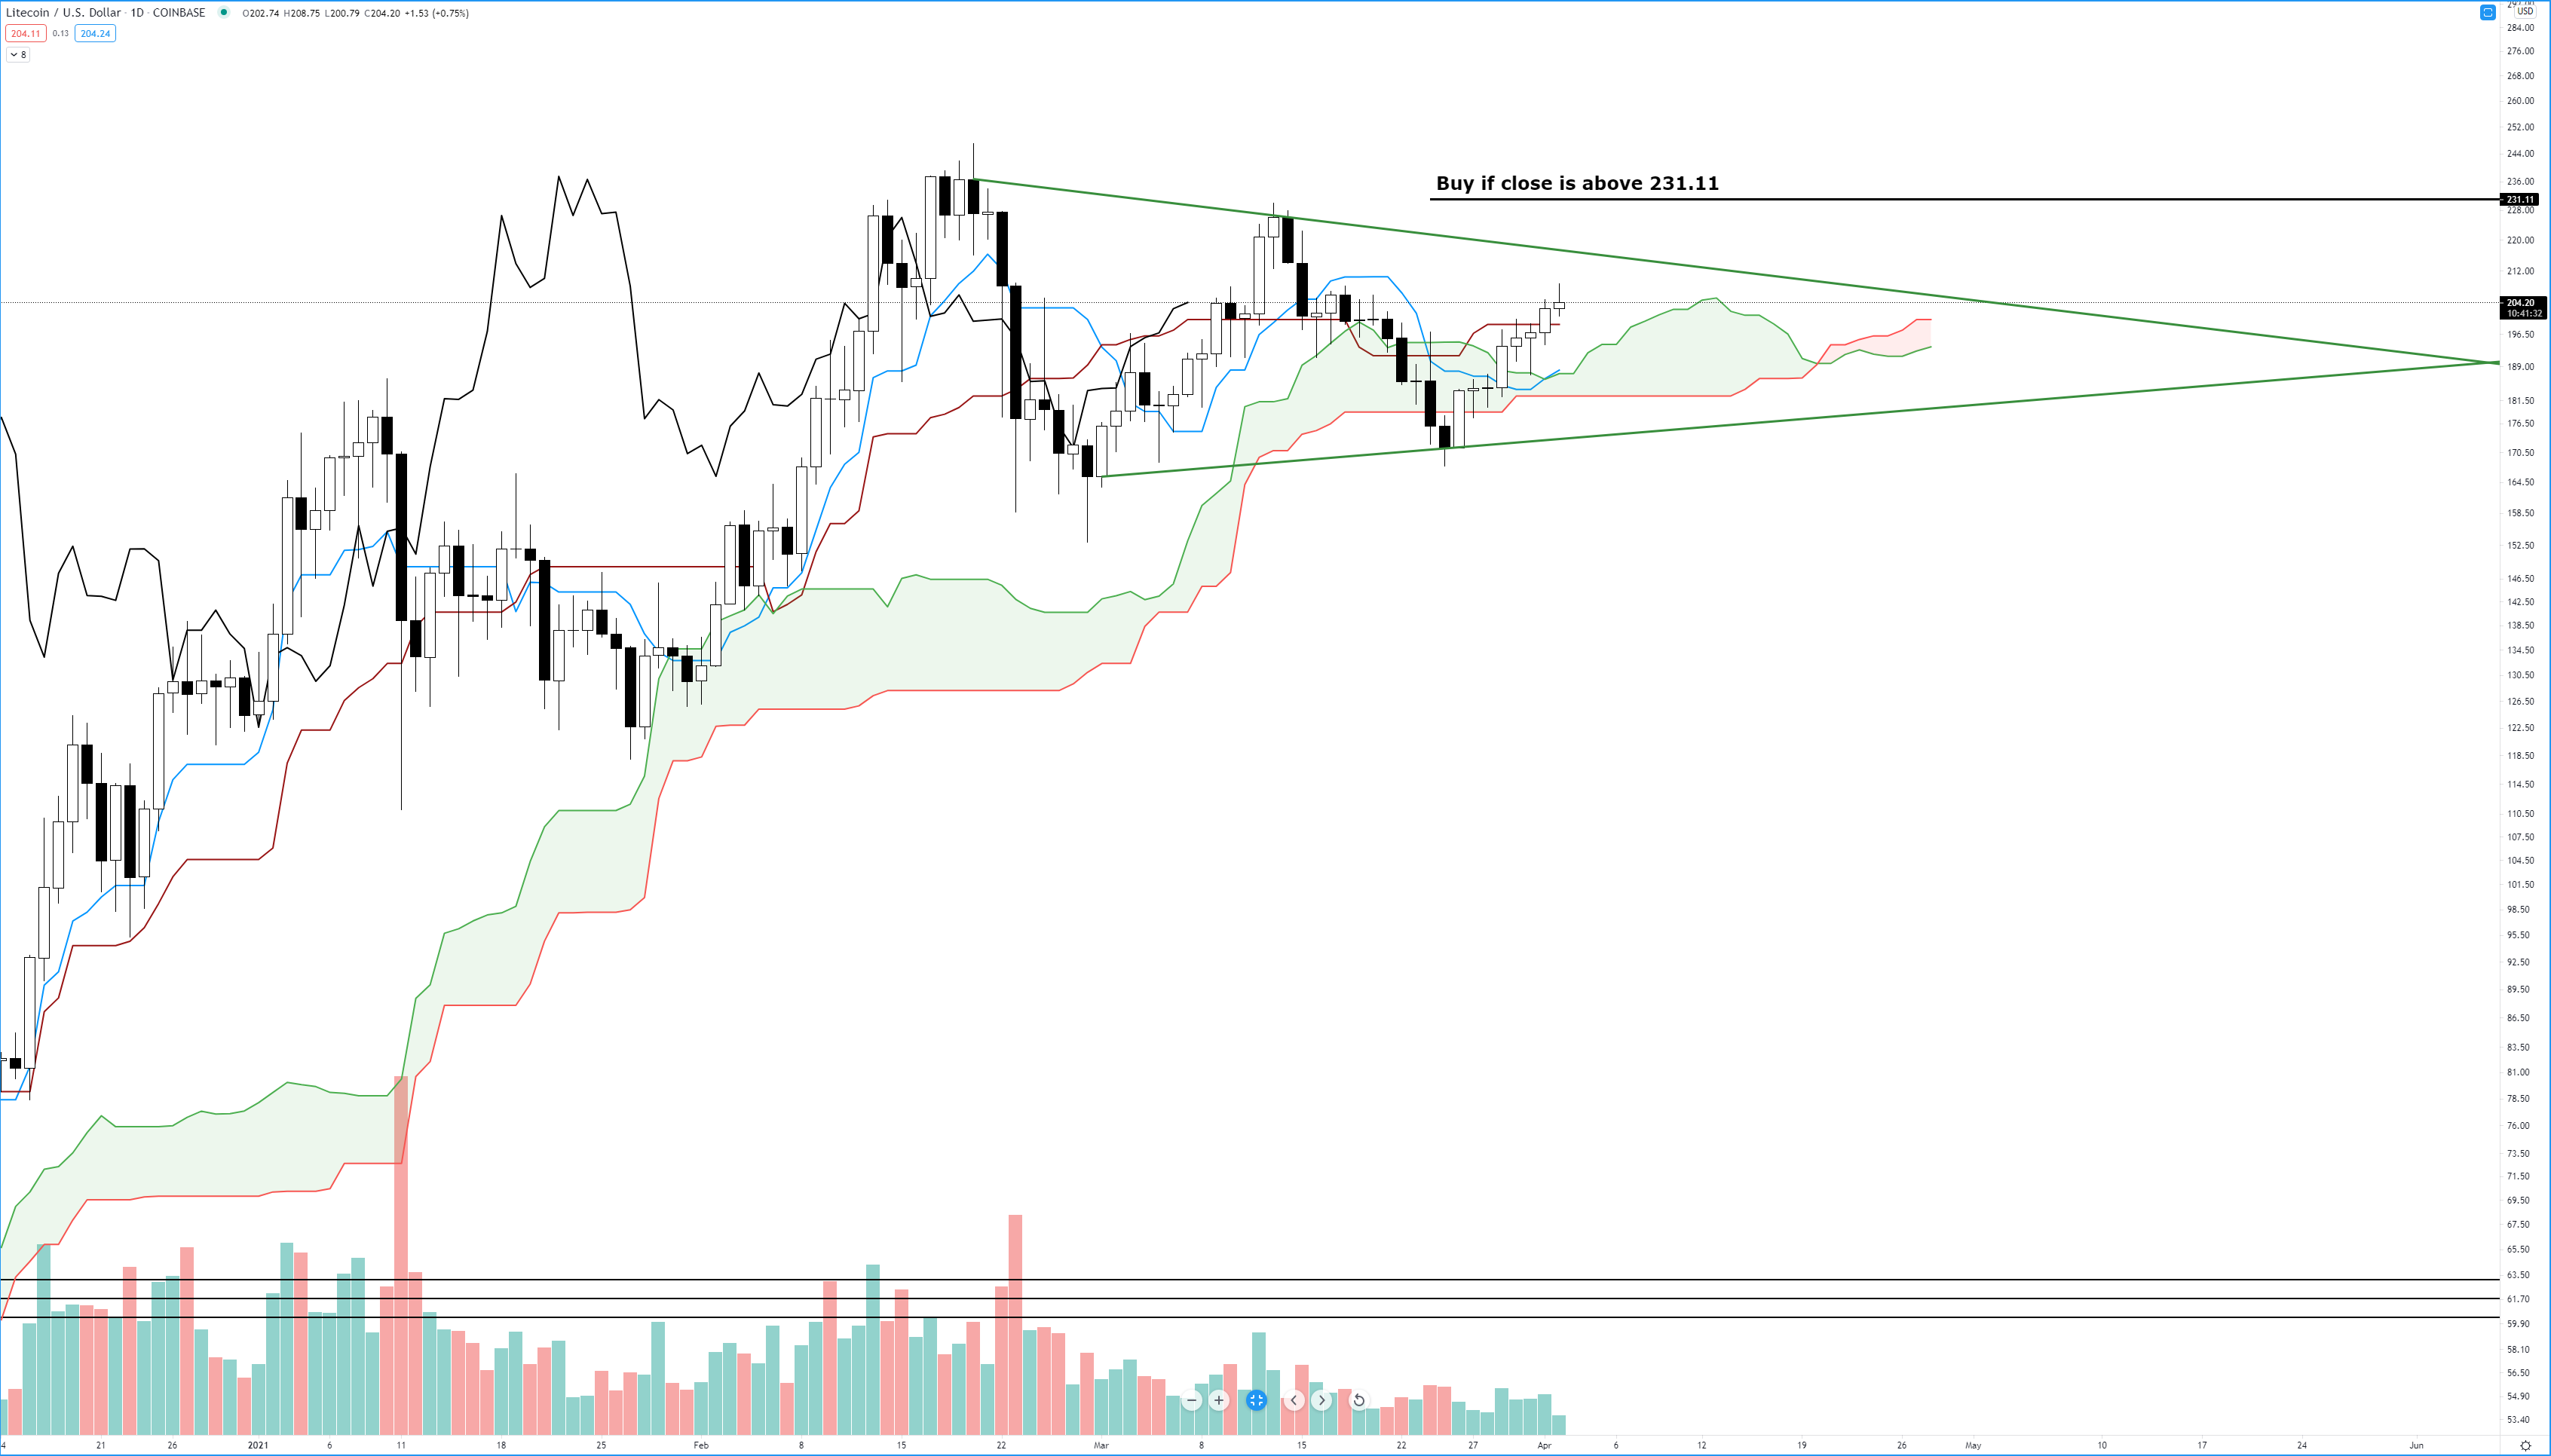
 Litecoin has a number of conditions on its chart that, if all come to fruition, could yield a massive rally. The two trends lines on the chart show Litecoin is inside a very standard bullish continuation pattern known as a bullish pennant. A bullish pennant is any variation of a triangle pattern – in this case, a symmetrical triangle. In a symmetrical triangle, we often see price breakout near the final 1/3rd of the triangle; but not always. It’s been my experience that the most important factors for confirming if a breakout is going to occur is the volume component of this pattern. If we see volume decrease as price moves close to the apex of the triangle, this is a sign of an imminent breakout. When the breakout does occur, the candlestick should have massive volume. If Litecoin can breakout above the triangle, close above 231.11, and if the breakout has major volume behind it, then we should see a nice rally to at least the $300 value area.
Polkadot (DOT)
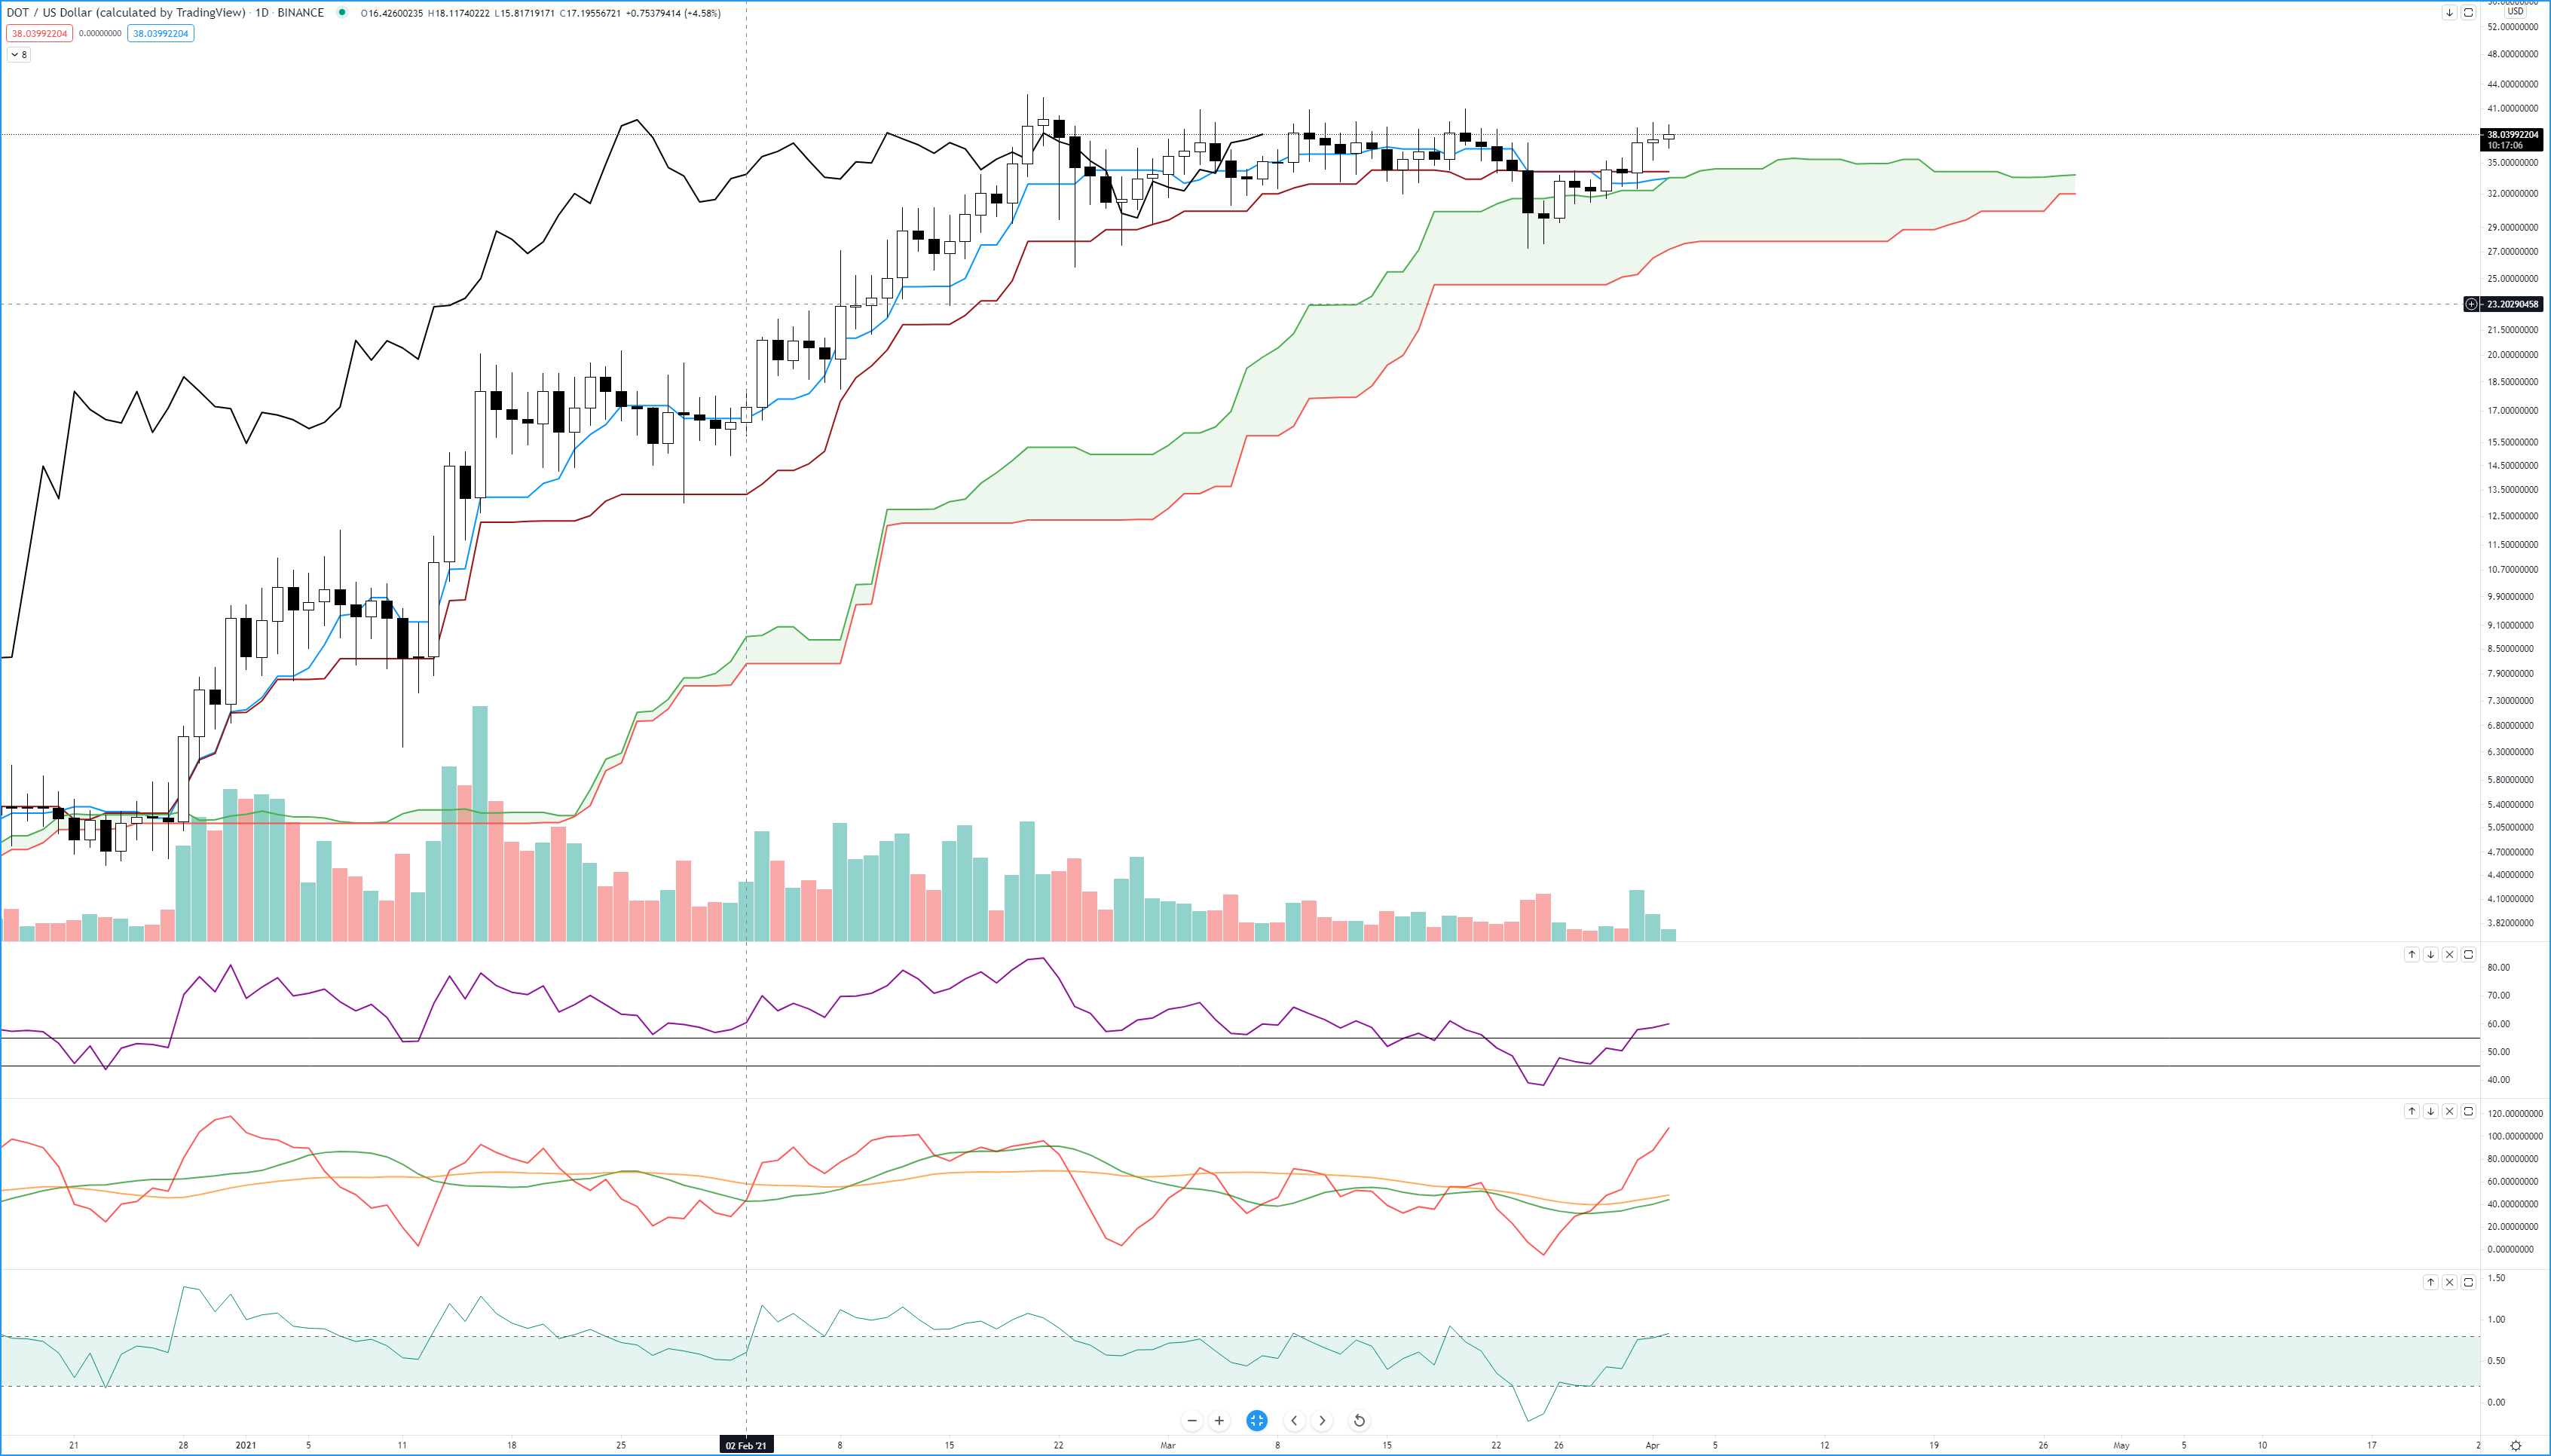
Polkadot has a very similar chart setup to Cardano – almost identical. The only different with Polkadot’s price action and Cardano’s is Polkadot is current trading above its daily Kijun-Sen. Since making its new all-time high back on February 20th, 2021 Polkadot has struggled to regain and breakout above that level. Today is the 42nd day that Polkadot has traded in a range, but it could breakout very soon. I am looking for a close above the prior all-time high as a good opportunity to add to my positions or to open new positions. If Polkadot closes around the $43 value area, that should bring every Ichimoku signal we need to confirm an Ideal Ichimoku Breakout setup. The oscillators below support any move that would create new all-time highs. The %B line has just crossed 0.8 while the RSI remains below 80. If price does move to a new all-time high, the oscillators show a very, very high probability that a continued move higher will occur.
Subscribe and watch forex and cryptocurrency technical analysis / forecast videos on our new channel: Exchange Rates UK TV
Advertisement
Save money on your currency transfers with TorFX, voted International Money Transfer Provider of the Year 2016 – 2020. Their goal is to connect clients with ultra competitive exchange rates and a uniquely dedicated service whether they choose to trade online or over the telephone.
Find out more here.