
Cardano (ADA)
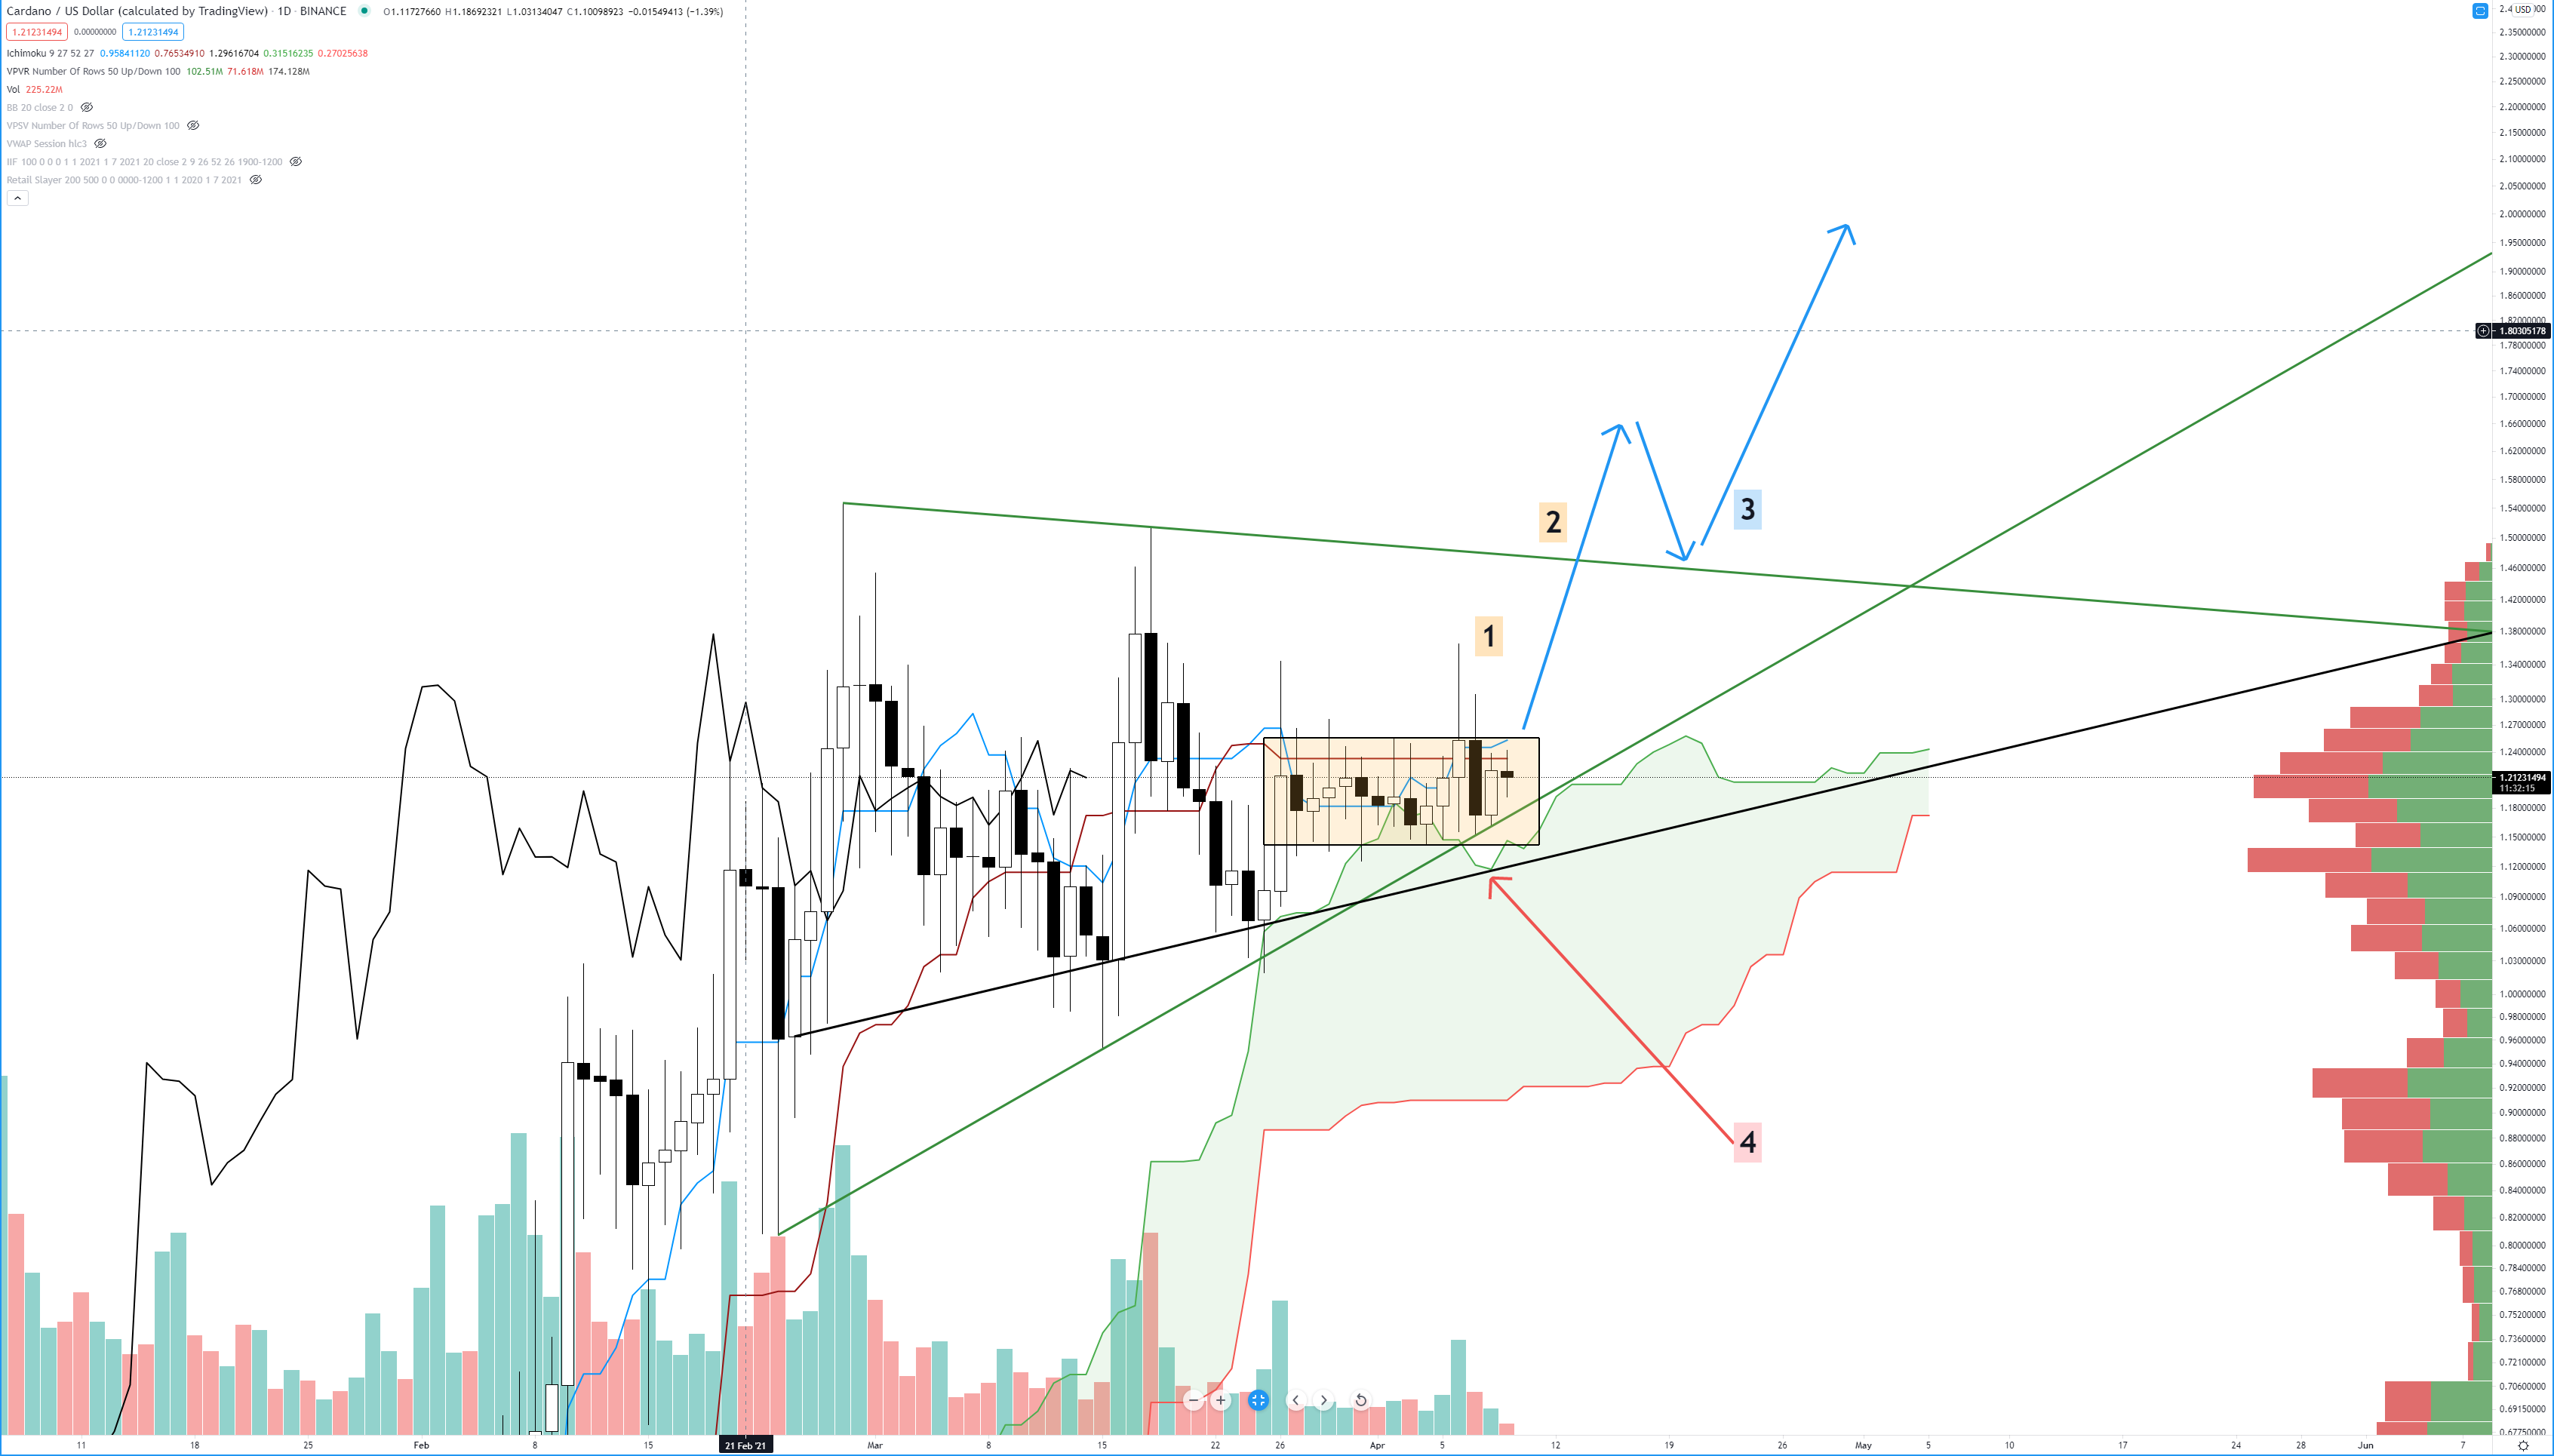
For those following my videos and articles, Cardano analysis will not be much different from what we have reviewed over the past week – but those new (welcome!) to here, I’ll make it quick! The highlighted zone (#1) represents a tight trading range that Cardano has been inside for the past fifteen days. Cardano remains inside the confines of the trendlines of the bullish pennant. For the short side of the market, watch for any drop and close below the black trendline near the 1.09 – 1.10 value area. If Cardano makes an attempt to re-enter above the black trend line or the bullish pennant but fails to return on the retest, a short opportunity may present itself. For bulls, there are three entry options – each more conservative than the next. First, an entry could be made when we get a daily close above the daily Tenkan-Sen around 1.255. Second, an entry could be made on the initial break or close above the bullish pennant around the 1.49 value area (#2). Third, and most conservative, would be waiting for a break above the pennant and then waiting for a retest of the breakout to confirm support and then entering the market if support holds (#3). The third entry opportunity would be the same value area as #2.
Litecoin (LTC)
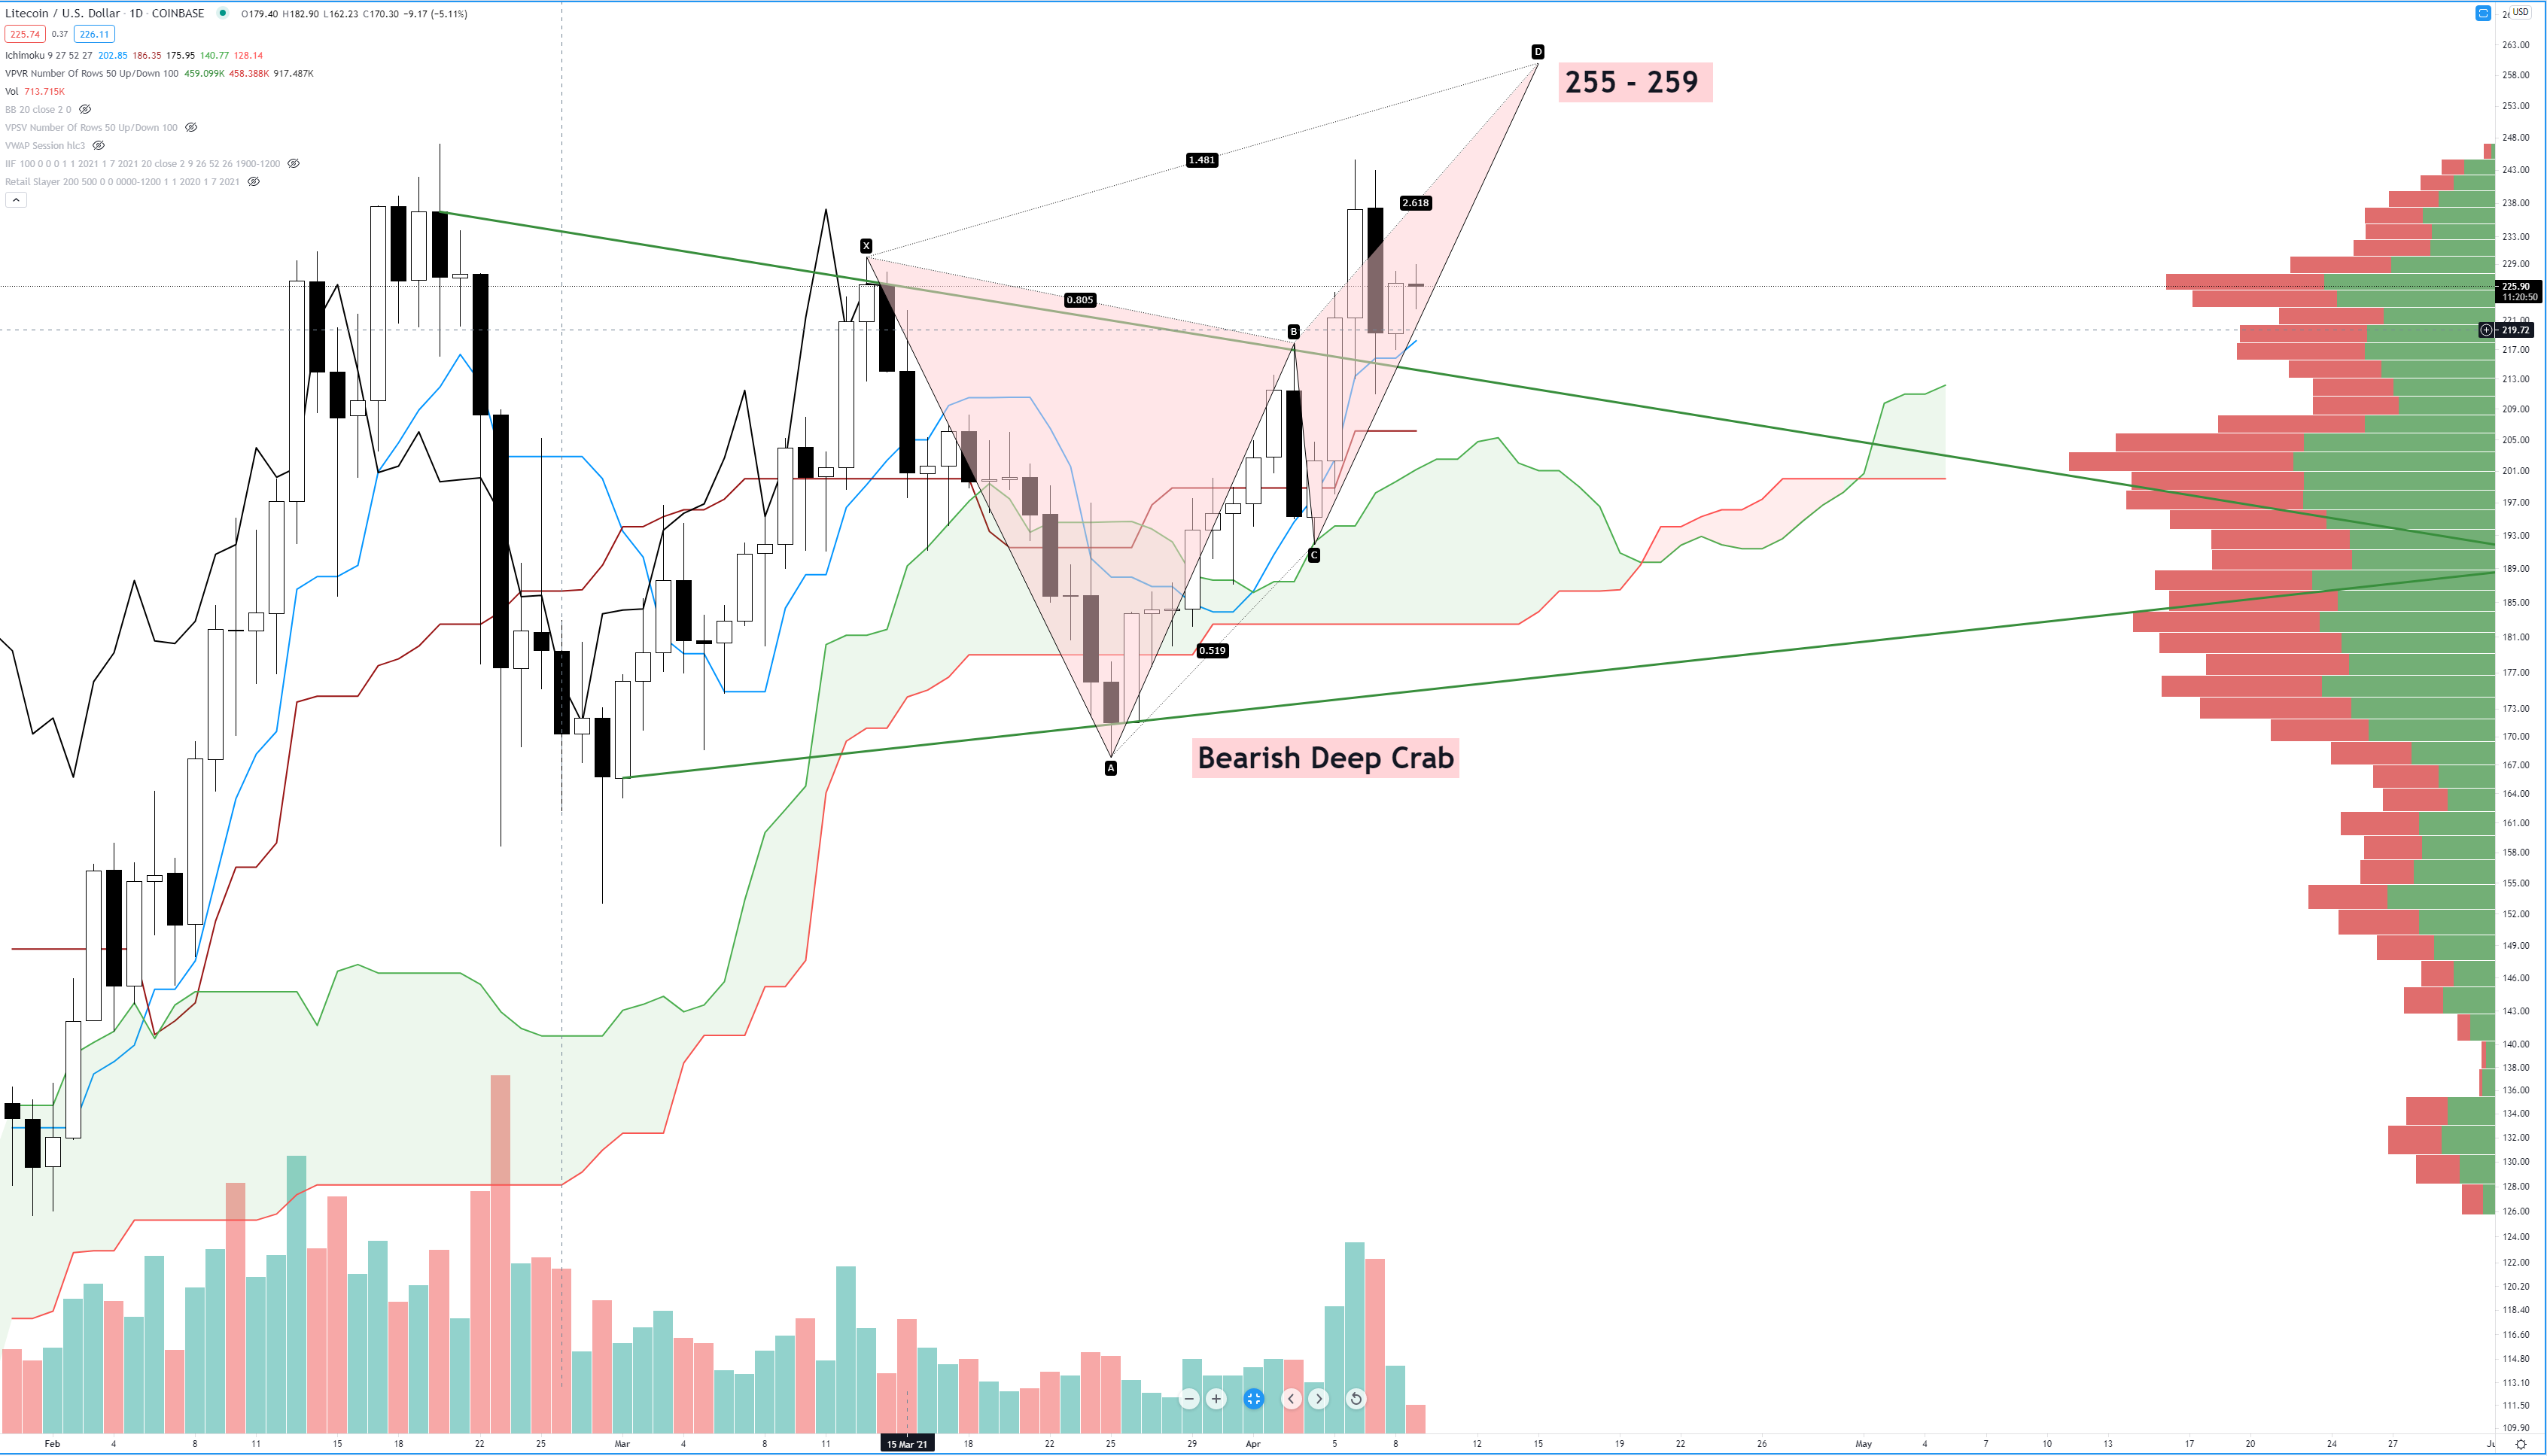
Litecoin broke out of its bullish pennant back on April 5th, moved higher, and then retested the break as support on April 7th. Yesterday’s daily candlestick created an inside bar. Last week I discussed waiting for a close above the prior swing high at 231 – which we did get. I am looking at that same value area for a new entry if, more specifically, a close above 230.00. The Lagging Span is slightly below the level it needs to be for all conditions on Litecoin’s daily Ichimoku chart to be bullish, so I’d wait for the daily close to confirm the Lagging Span closing above the candles. Upside potential, however, may be limited due to a powerful harmonic pattern known as a Bearish Deep Crab that completes around the 255 – 259 value area. We could see an immediate reversal and massive sell pressure when Litecoin reaches that level.
Polkadot (DOT)

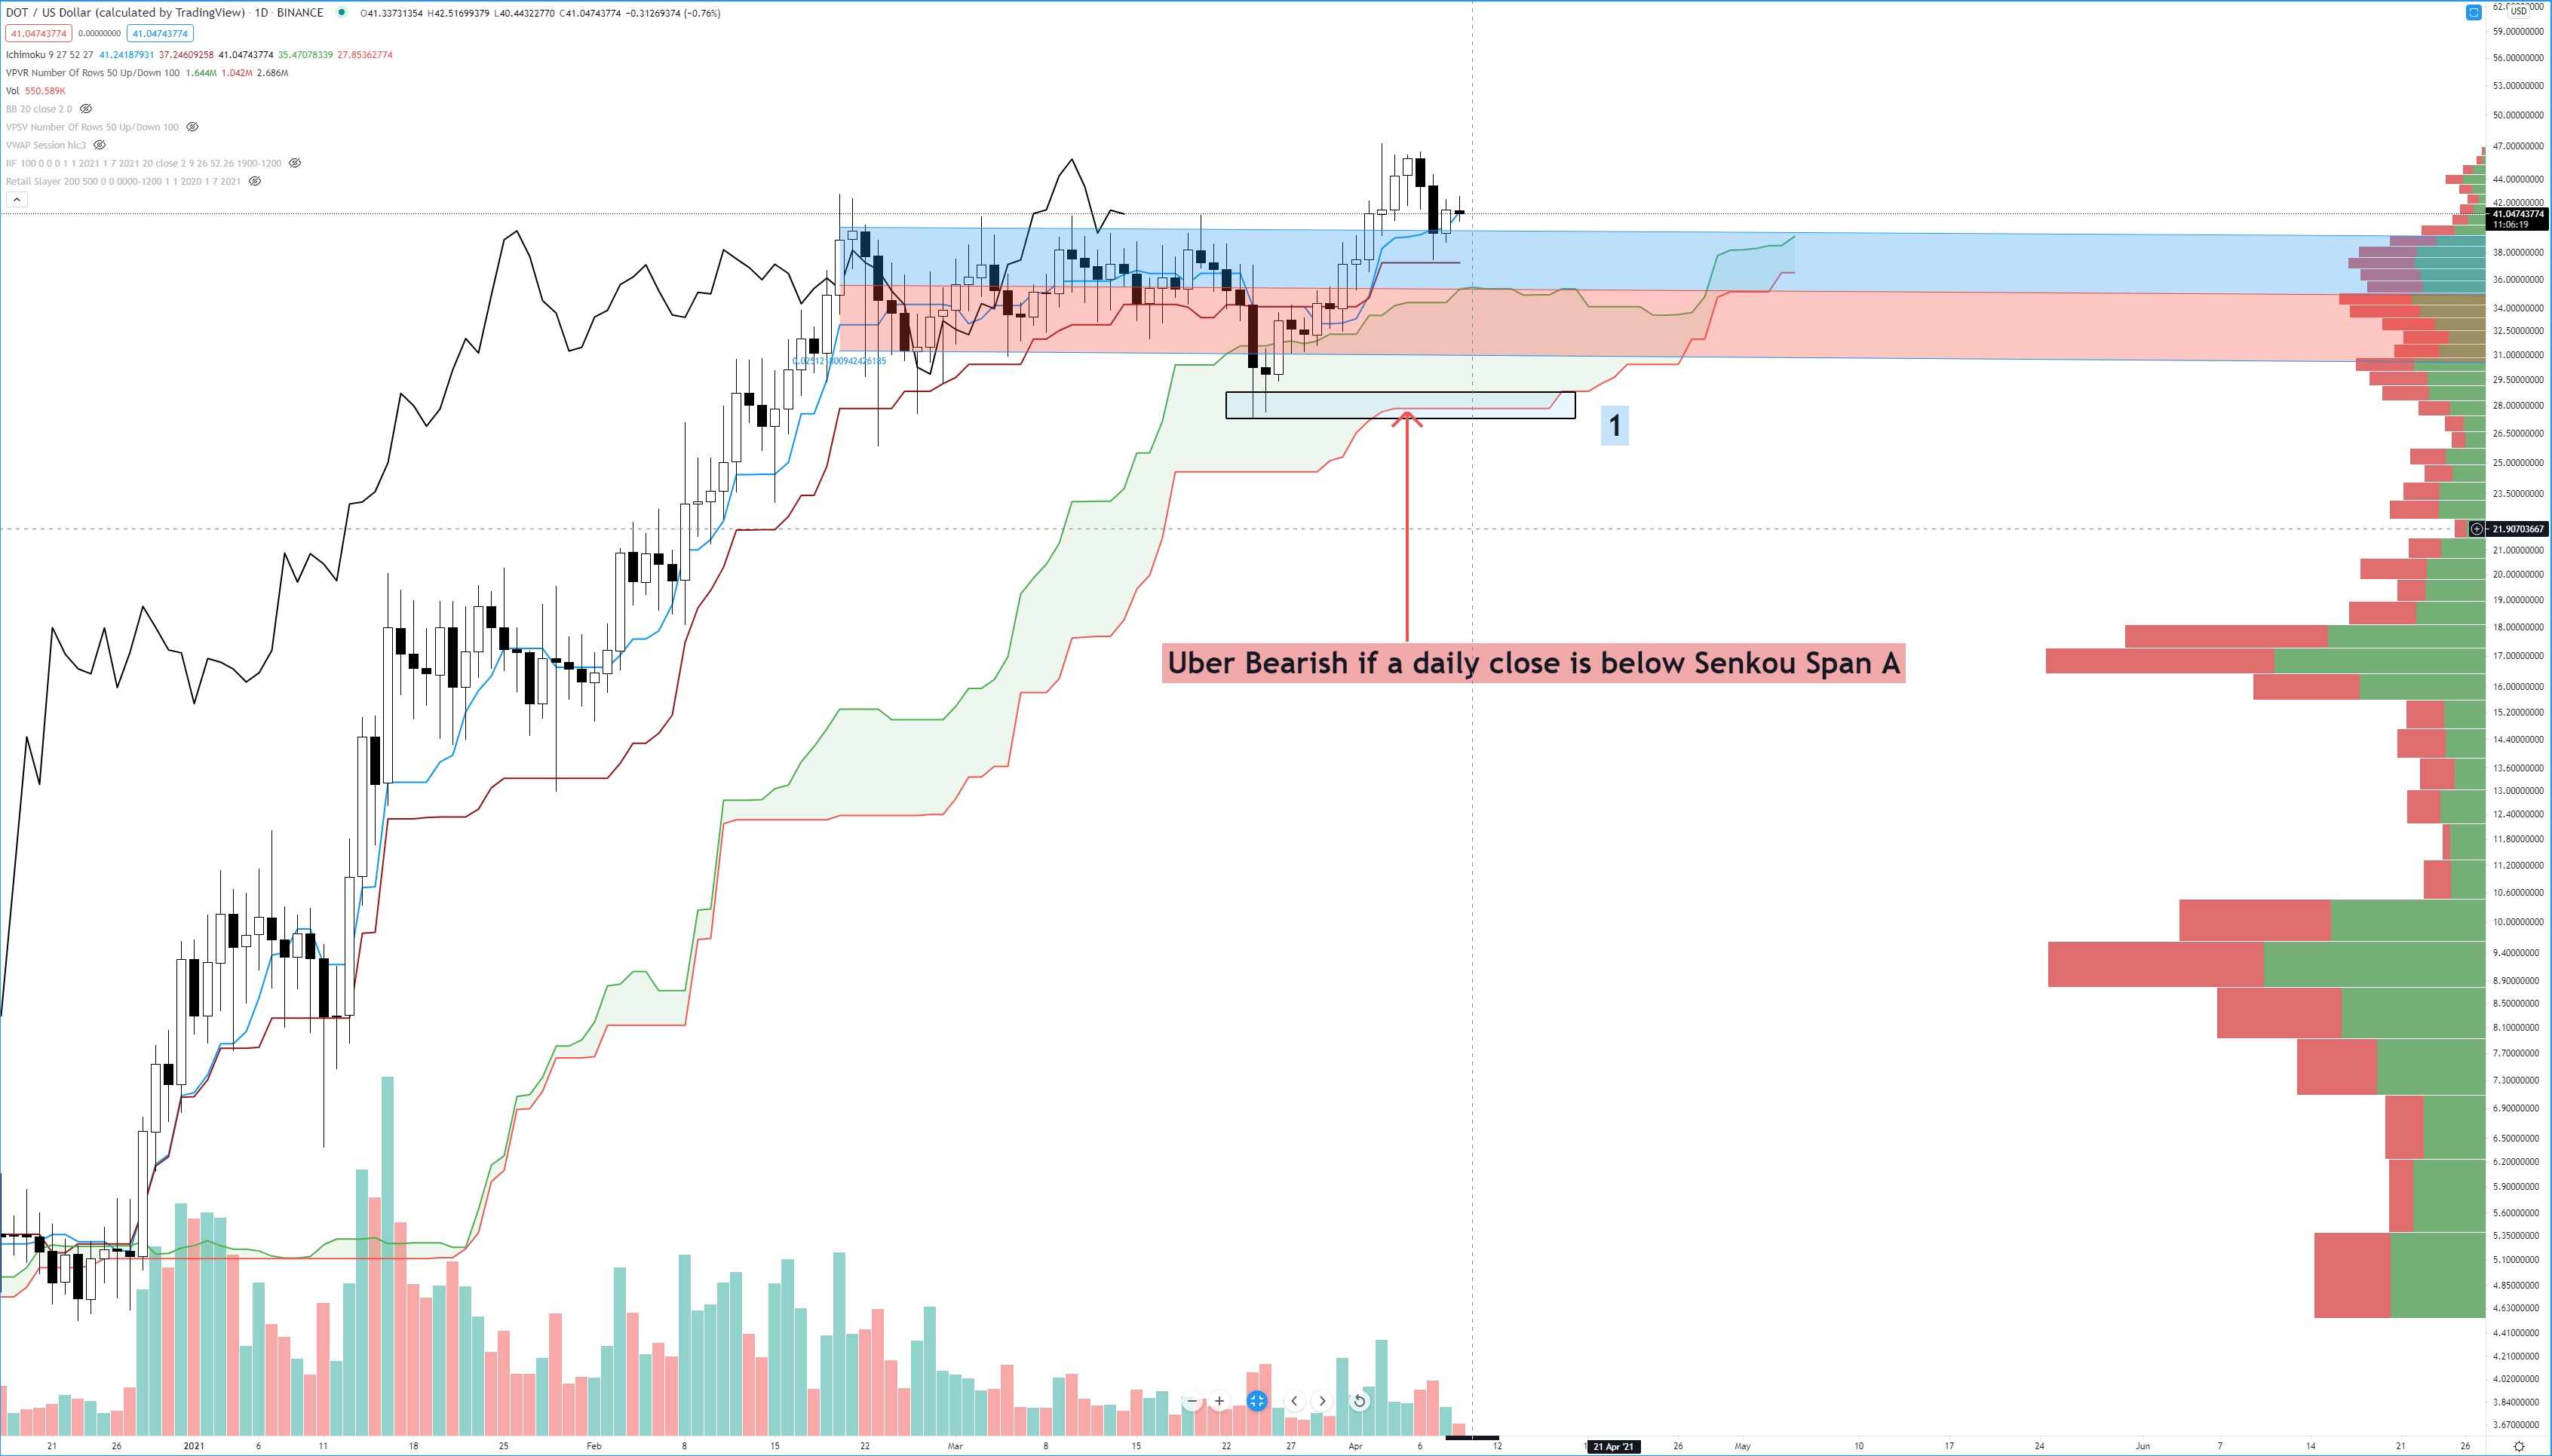
There are a couple of levels on Polkadot’s chart that I think we should pay attention to. First, on the daily chart above, is where price is currently trading concerning the Regression Trend Channel (Red and Blue channel). You’ll observe that DOT pushed above the channel and has retested the breakout as support. However, we do not see a ton of follow-through since yesterday’s close. For those interested in shorting, I’d be cautious if you are using the daily chart. While a return into the channel is a bearish setup for a bull trap, we could see a beautiful bear trap develop if traders decide to short below the channel. The highlighted price level at #1 shows a dual support level. The lows of March 24th and March 25th share the same support zone as the most substantial support/resistance level in the Ichimoku system, Senkou Span B. One could easily see bears aggressively shorting the break below the channel, only to see buyers stop any further downside pressure. But any clear break and hold below Senkou Span A would be disastrous for bulls. If price drops to the support zone at #1 (27 – 29) and continues lower to close below Senkou Span A, that will mean price has dropped below the Cloud, and the Lagging Span will be below the candlesticks. This would generate the strongest bearish signal Polkadot has ever experienced on its daily chart. But what about the weekly chart?
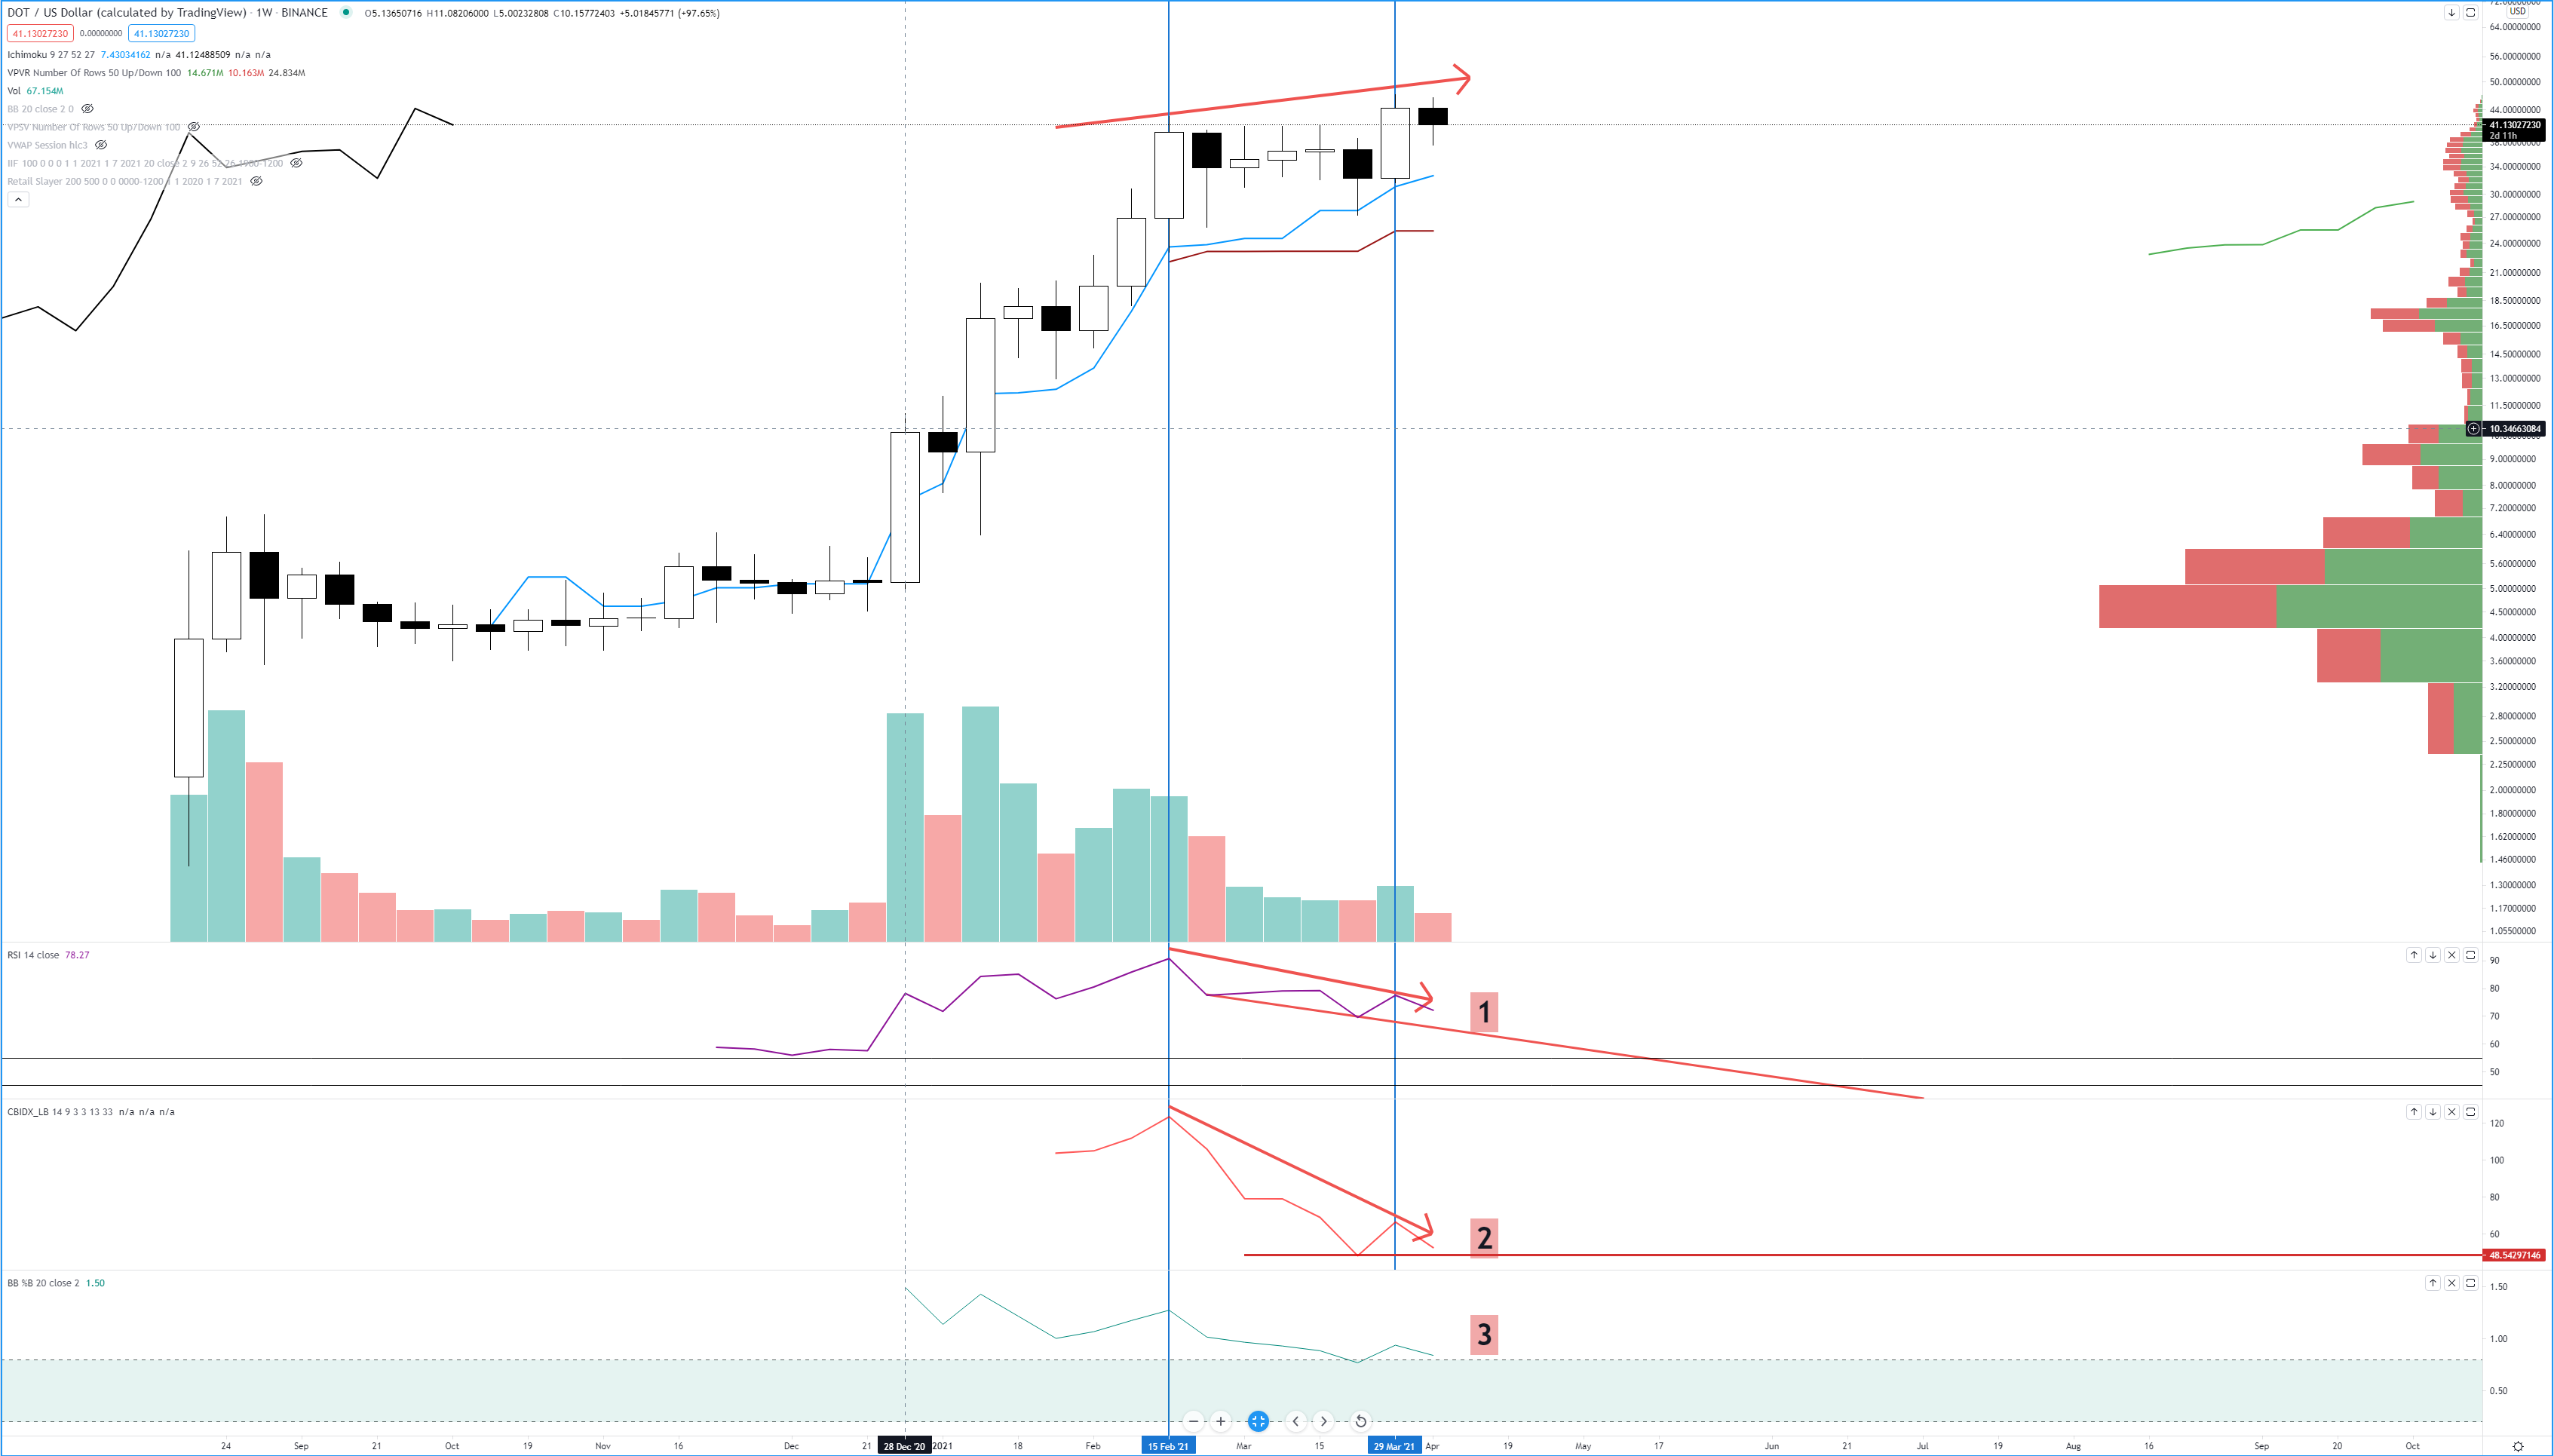
Polkadot’s weekly chart is still so new that there isn’t enough data to even plot Senkou Span A! Observe the red arrow on the candlestick cart along with the red arrows on the RSI (#1) and Composite Index (#2). When you see price action creating higher highs, but the RSI and/or the Composite Index is creating lower highs, this is a condition known as Bearish Divergence – a warning sign that further upside potential could end. There are several conditions in the oscillators I want you to pay attention to over the coming weeks.
1. The first condition to observe is the RSI (#1). I drew a trendline showing where the support level is on the RSI. If we see the RSI drop below that trendline, we will likely see a flash crash. BUT! Only if the next two conditions are also met.
2. The second condition is on the Composite Index (#2). The lowest value on the weekly chart for the Composite Index is at 48. If the Composite Index drops below this level (and conditions one and three are met), expect a crash.
3. Finally, the third condition to watch is the %B. If the %B drops below the 0.8 level, watch out. The %B dropping below 0.8 is the likely trigger event that will see the RSI and Composite Index drop below its levels and trigger a massive crash.
Polkadot’s price action will be interesting to watch over the next few weeks. Depending how fast Polkadot would fall, we could see a setup for some hidden bullish divergence on the weekly chart, indicating support and a resumption of the move higher – but that would only occur after Polkadot dropped over -35% to -45% from its most recent all-time high.