
- The stock market is bleeding, while government bonds are a no-go zone for most investors.
- Investors are likely to get creative with their portfolios, adding cryptocurrency instead of government bonds.
- Bitcoin seeks support, preferably above $54,000, to kick start the upswing to new all-time highs.
- Ethereum and Ripple face intensifying overhead pressure after failing to hold crucial support zones.
Bitcoin closed in on the all-time high slightly above $58,000 but corrected before making any significant action toward a new record high. Despite the uptrend from the first day of March, many experts and analysts have called for correction. However, the consistency seems to shift the target significantly above $60,000, perhaps $66,000.
Meanwhile, Ethereum appears to be consolidated under $1,800 after failing to reclaim the lost ground toward $1,900. Similarly, Ripple’s consolidation continues toward the end of the third week.
The stock market is extremely volatile toward the end of the week’s trading. S&P Futures is exchanging hands 18.5% down on the day; Dow Futures has not been affected much, losing 4%. However, one of the biggest losers is the Nasdaq Futures, with a daily loss of 207%.
The sliding stock market means that investors will be looking for a cushion. Government bonds have for a long time been preferred as a low-risk investment. However, with the world dealing with the pandemic, these bonds offer little attraction to investors.
In line with that, investors are bound to get creative with their portfolios, and cryptocurrencies seem to be coming up the list, especially with the month-over-month gains recorded from late 2020. A fresh influx of funds into the market could set the pace for another bull run.
Bitcoin could ignore the bearish calls
Bitcoin is trading marginally above $56,000. This follows a rejection from areas around $58,000. The bellwether cryptocurrency is looking forward to higher support, whereby bulls will launch the next attack mission.
The short-term technical analysis shows that the losses could go on under $56,000. However, support at $54,000 remains robust. At this level, buyers are likely to enter, adding weight to the tailwind and pushing BTC toward the all-time. Note that a break above $60,000 may open the door to gains eyeing $66,000.
BTC/USD 4-hour chart
Ethereum holds firmly crucial short-term support
The pioneer smart contract token has been on a downward trend after hitting a barrier slightly under $1,900. Support at $1,800 did little to stop the correction. However, the 61.8% Fibonacci retracement level has remained unshaken, ensuring the further losses are kept at bay.
Holding above the 61.8% Fibo level would a bullish signal. Buyers will focus on higher levels heading to $2,000 while stability will prevail in the market. A possibly incoming golden cross will validate the bullish outlook. The 50 Simple Moving Average (SMA) on the 4-hour chart is likely to cross above the 200 SMA.
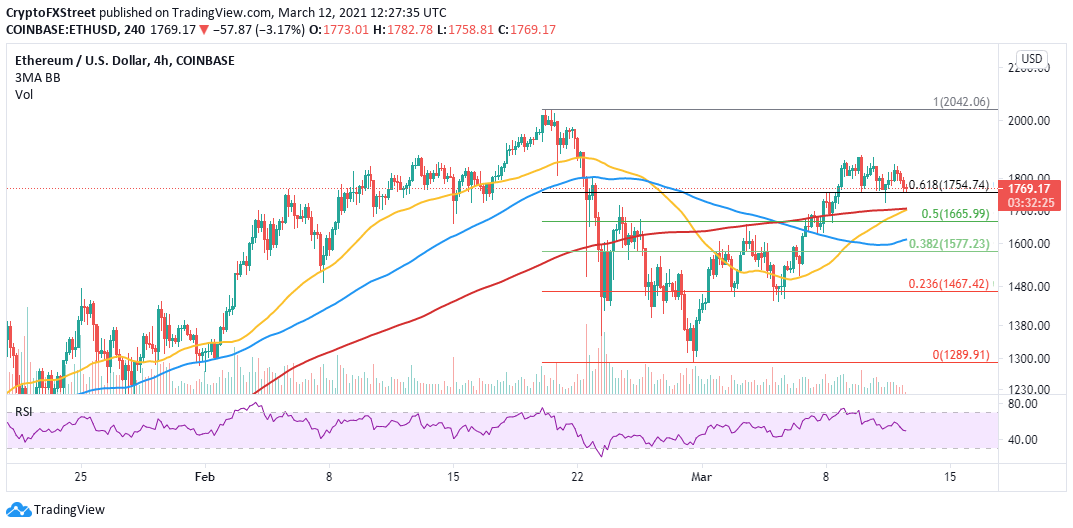
ETH/USD 4-hour chart
Ripple’s technical flip bearish
The cross-border token is gearing upward for a downswing as bears become stronger. The SuperTrend indicator has confirmed the bearish impulse on Thursday. This indicator shows traders when to short or long an asset. When the line changes to red and moves above the price, traders are usually on alert to sell.
Therefore, losses are expected to increase under $0.44 and probably retest the support $0.4. The Moving Average Convergence Divergence (MACD) seems to have reinforced the bearish narrative. If the MACD cross stays under the signal line, investors can anticipate more dips.
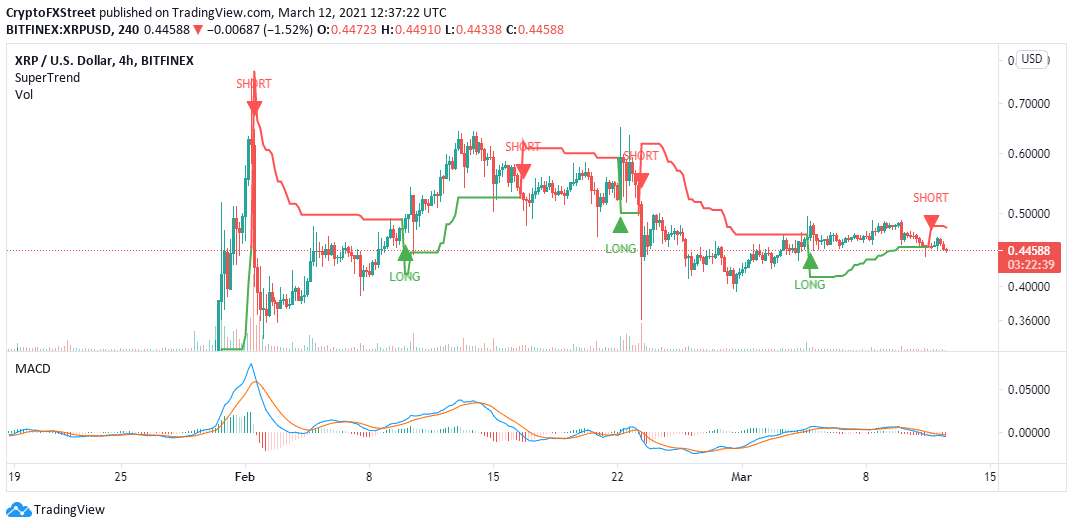
XRP/USD 4-hour chart
On the upside, a recovery above $0.45 will shift the attention to $0.5. Moreover, bulls must concentrate on action beyond $0.5 to bring XRP out of the woods. Traders can also look out for the MACD line (blue) recovery above the signal line to add credence to the trend reversal.