

- Ripple is on the verge of a massive move if a technical pattern on the 4-hour chart matures.
- XRP must settle above $0.5 to come out of the woods, focusing on higher levels toward $0.6.
Ripple has been among the digital assets that managed to comfortably weather down the widespread declines at the beginning of this week. The cross-border token corrected toward $0.4 but established robust support.

An immediate recovery took place with XRP jumping above two key levels at $0.45 and $0.5. XRP traded a weekly high at $0.532, but a correction ensued, forcing bulls to seek support at $0.45.
In the meantime, Ripple is trading at $0.47 amid a renewed uptrend. Its immediate downside is protected by the 50 Simple Moving Average (SMA) and the 100 SMA on the 4-hour chart. On the upside, eyes are glued on breaking the hurdle at $0.5 and hopefully kick start the journey to $0.6.
XTZ/USD 4-hour chart
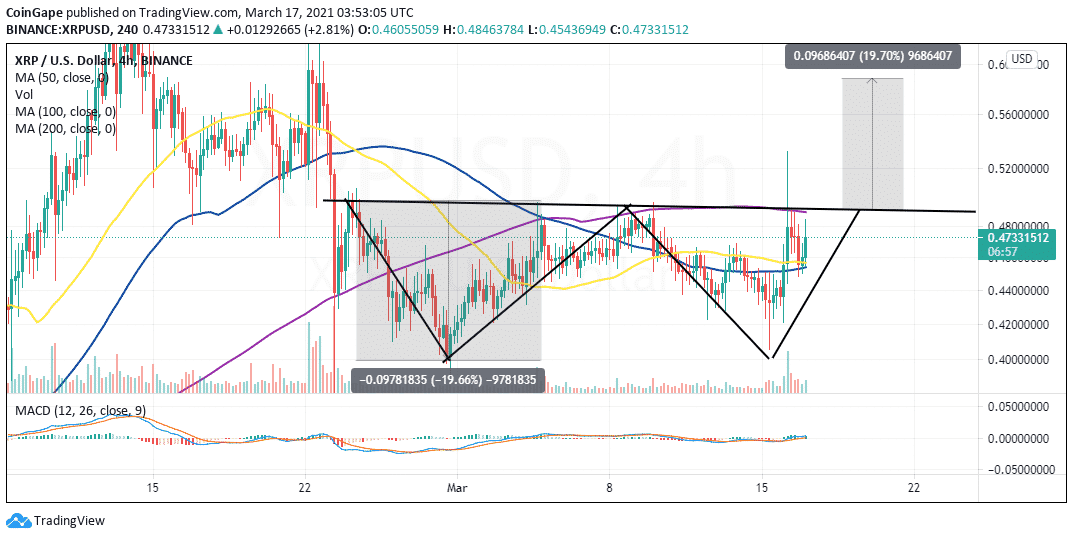
Simultaneously, a double bottom pattern has recently been formed on the 4-hour chart. The pattern is very bullish and comes into the picture when an asset price dips to the support level twice but is separated by a sharp peak. As the price approached the support for the second time, the downtrend fizzles out, and bulls aggressively rush in to take over control.
Double bottom patterns have precise breakout targets, measured from the neckline to the bottom point. A breakout is anticipated when the price slices through the neckline. For instance, Ripple eyes a 20% upswing toward $0.6.

Ripple intraday levels
Spot rate: $0.473
Relative change: 0.0123
Percentage change: 2.7%
Trend: Bullish
Volatility: Low
To keep track of DeFi updates in real time, check out our DeFi news feed Here.

Share on Facebook
Share on Twitter
Share on Linkedin
Share on Telegram