
Cardano (ADA)
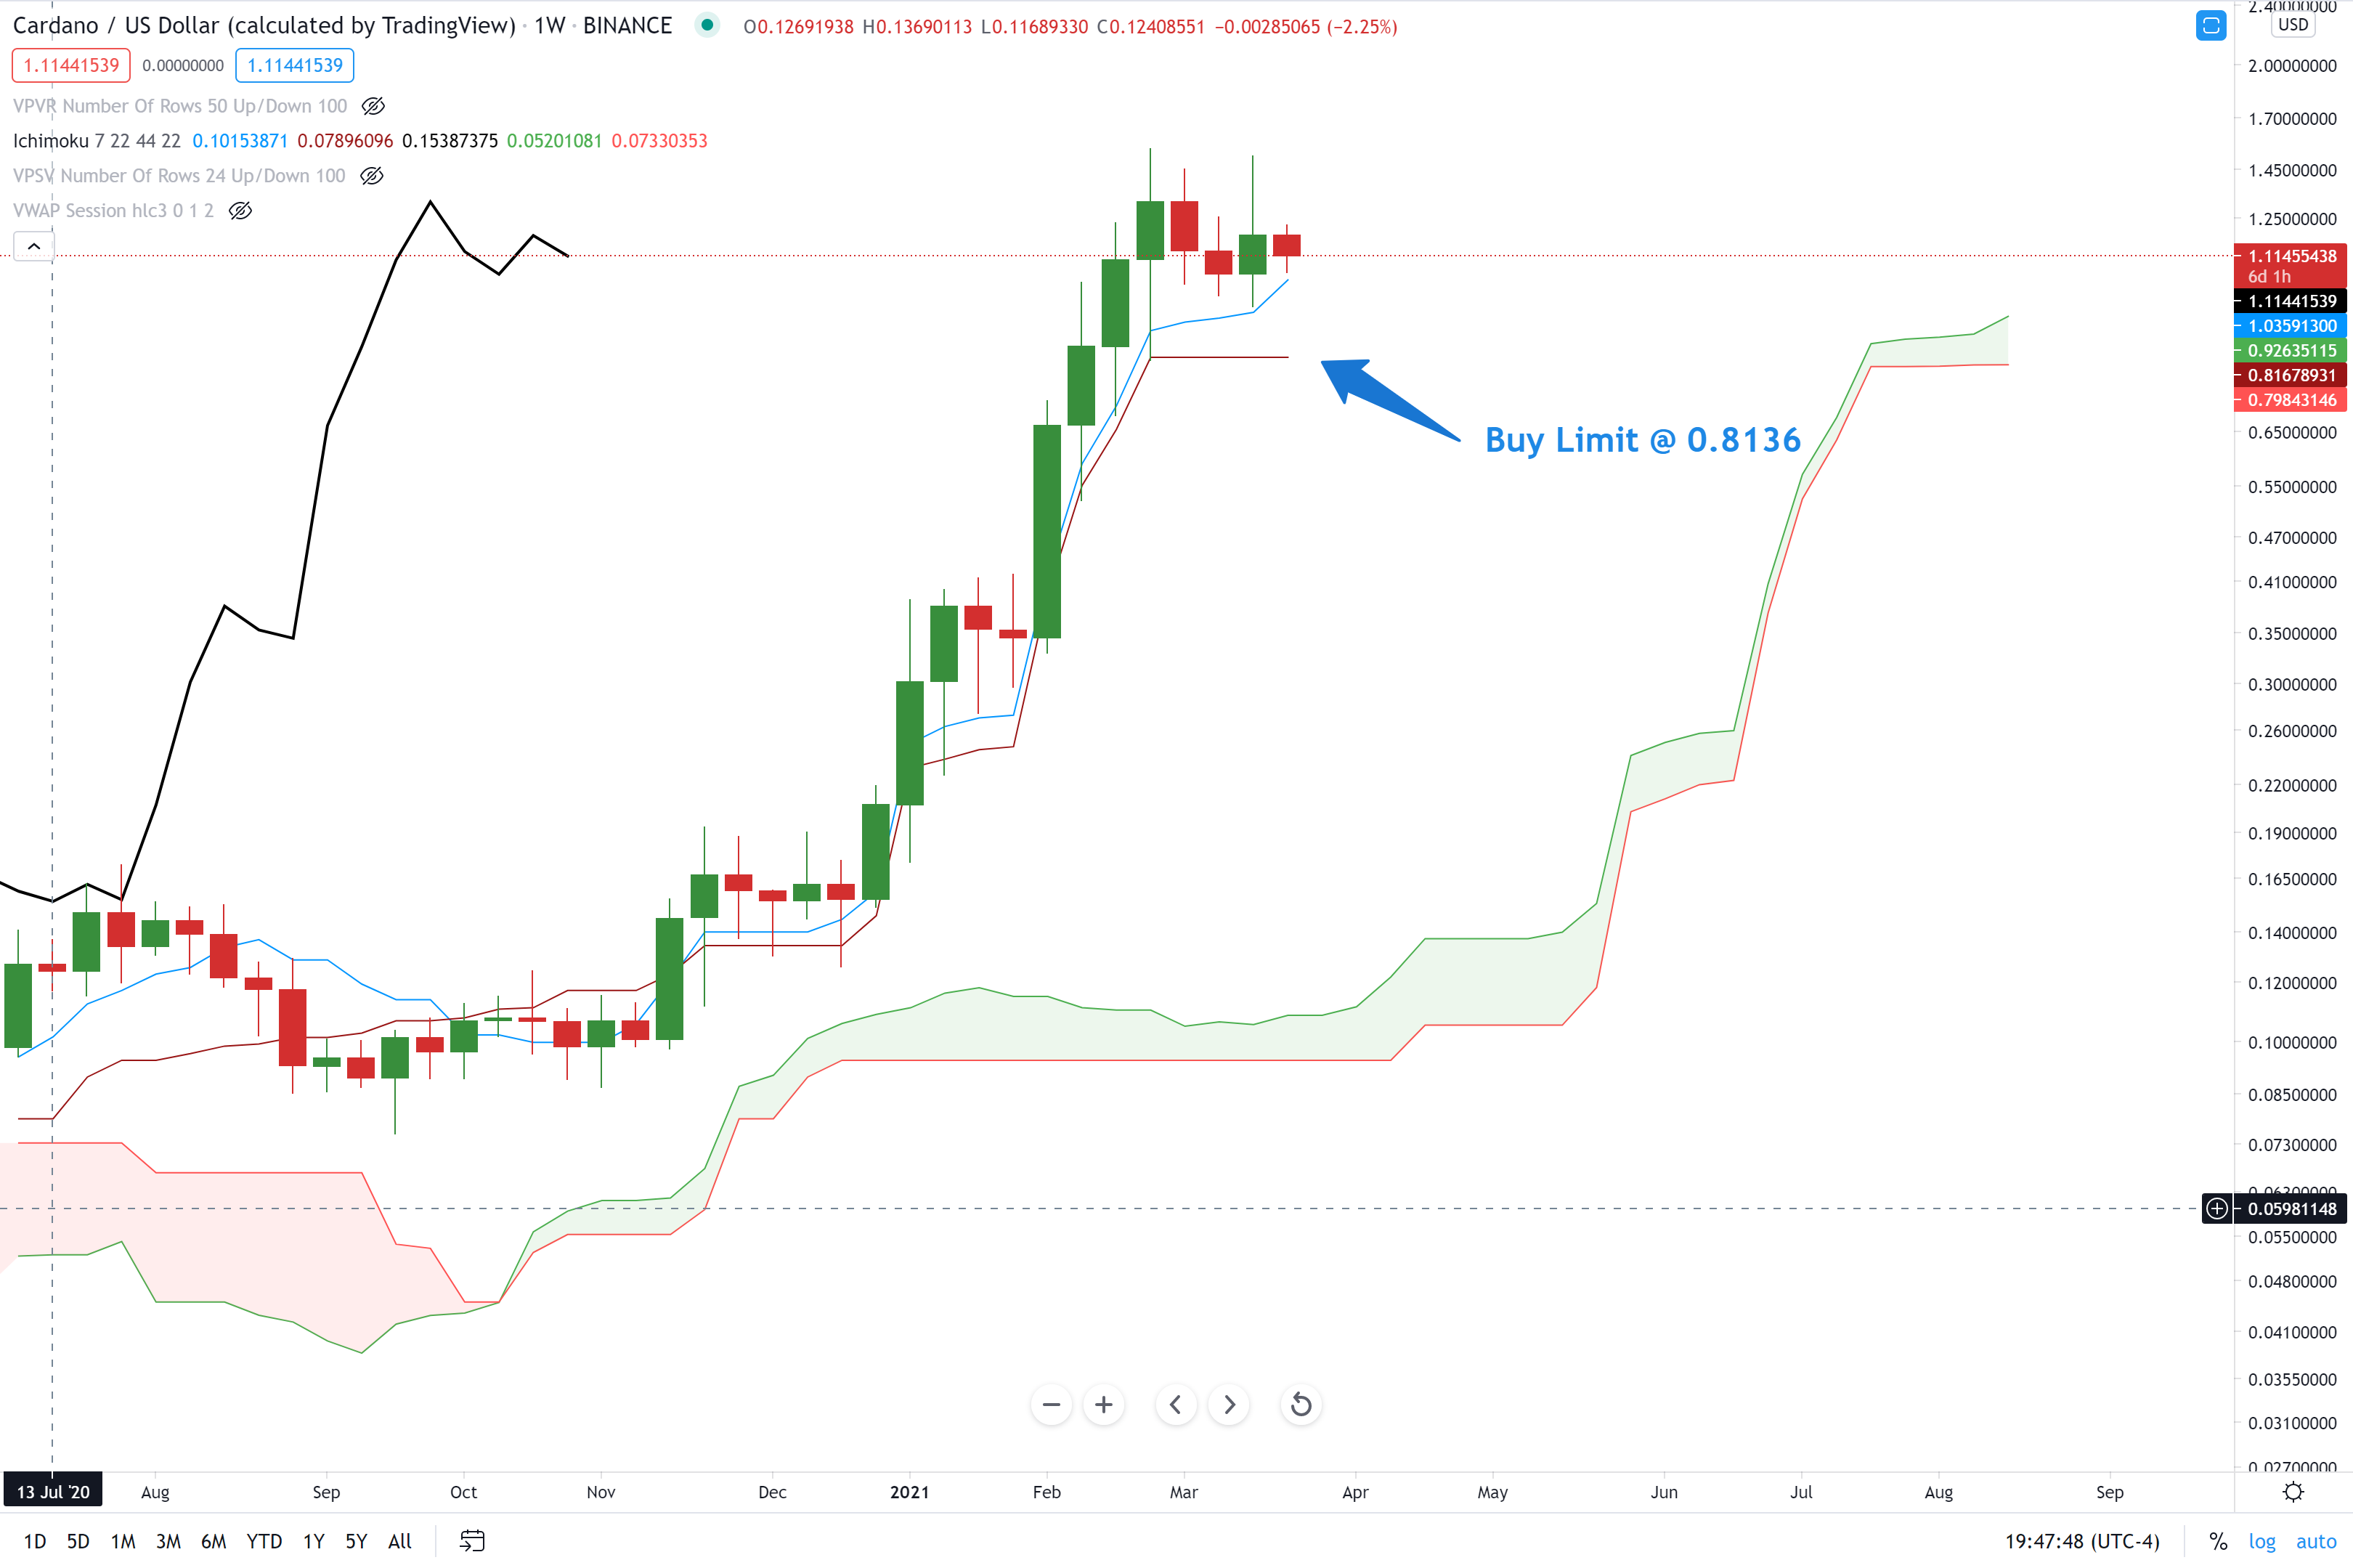
Above: Cardano (ADA/USD) Weekly Ichimoku Chart
After watching Cardano’s price action over the weekend, I’m moving my buy limit orders to a level that is more established and shows significant strength. The level I am looking at is the Kijun-Sen on the weekly chart. It’s been nearly four weeks since we’ve seen Cardano test this level, so any weekly close below the Tenkan-Sen will more than likely generate a move lower to the weekly Kijun-Sen at 0.8136. It would be very odd for the Kijun-Sen not to hold as a major support level. Why? Look at how flat the Kijun-Sen is. In the Ichimoku Kinko Hyo system, a flat Kijun-Sen that extends over a long period of time is a sign of significant strength. It is at this level I am waiting for price to come down to test.
READ: Cardano (ADA) to hit $5? Probably – Cryptocurrency Price Forecast
Ethereum (ETH)
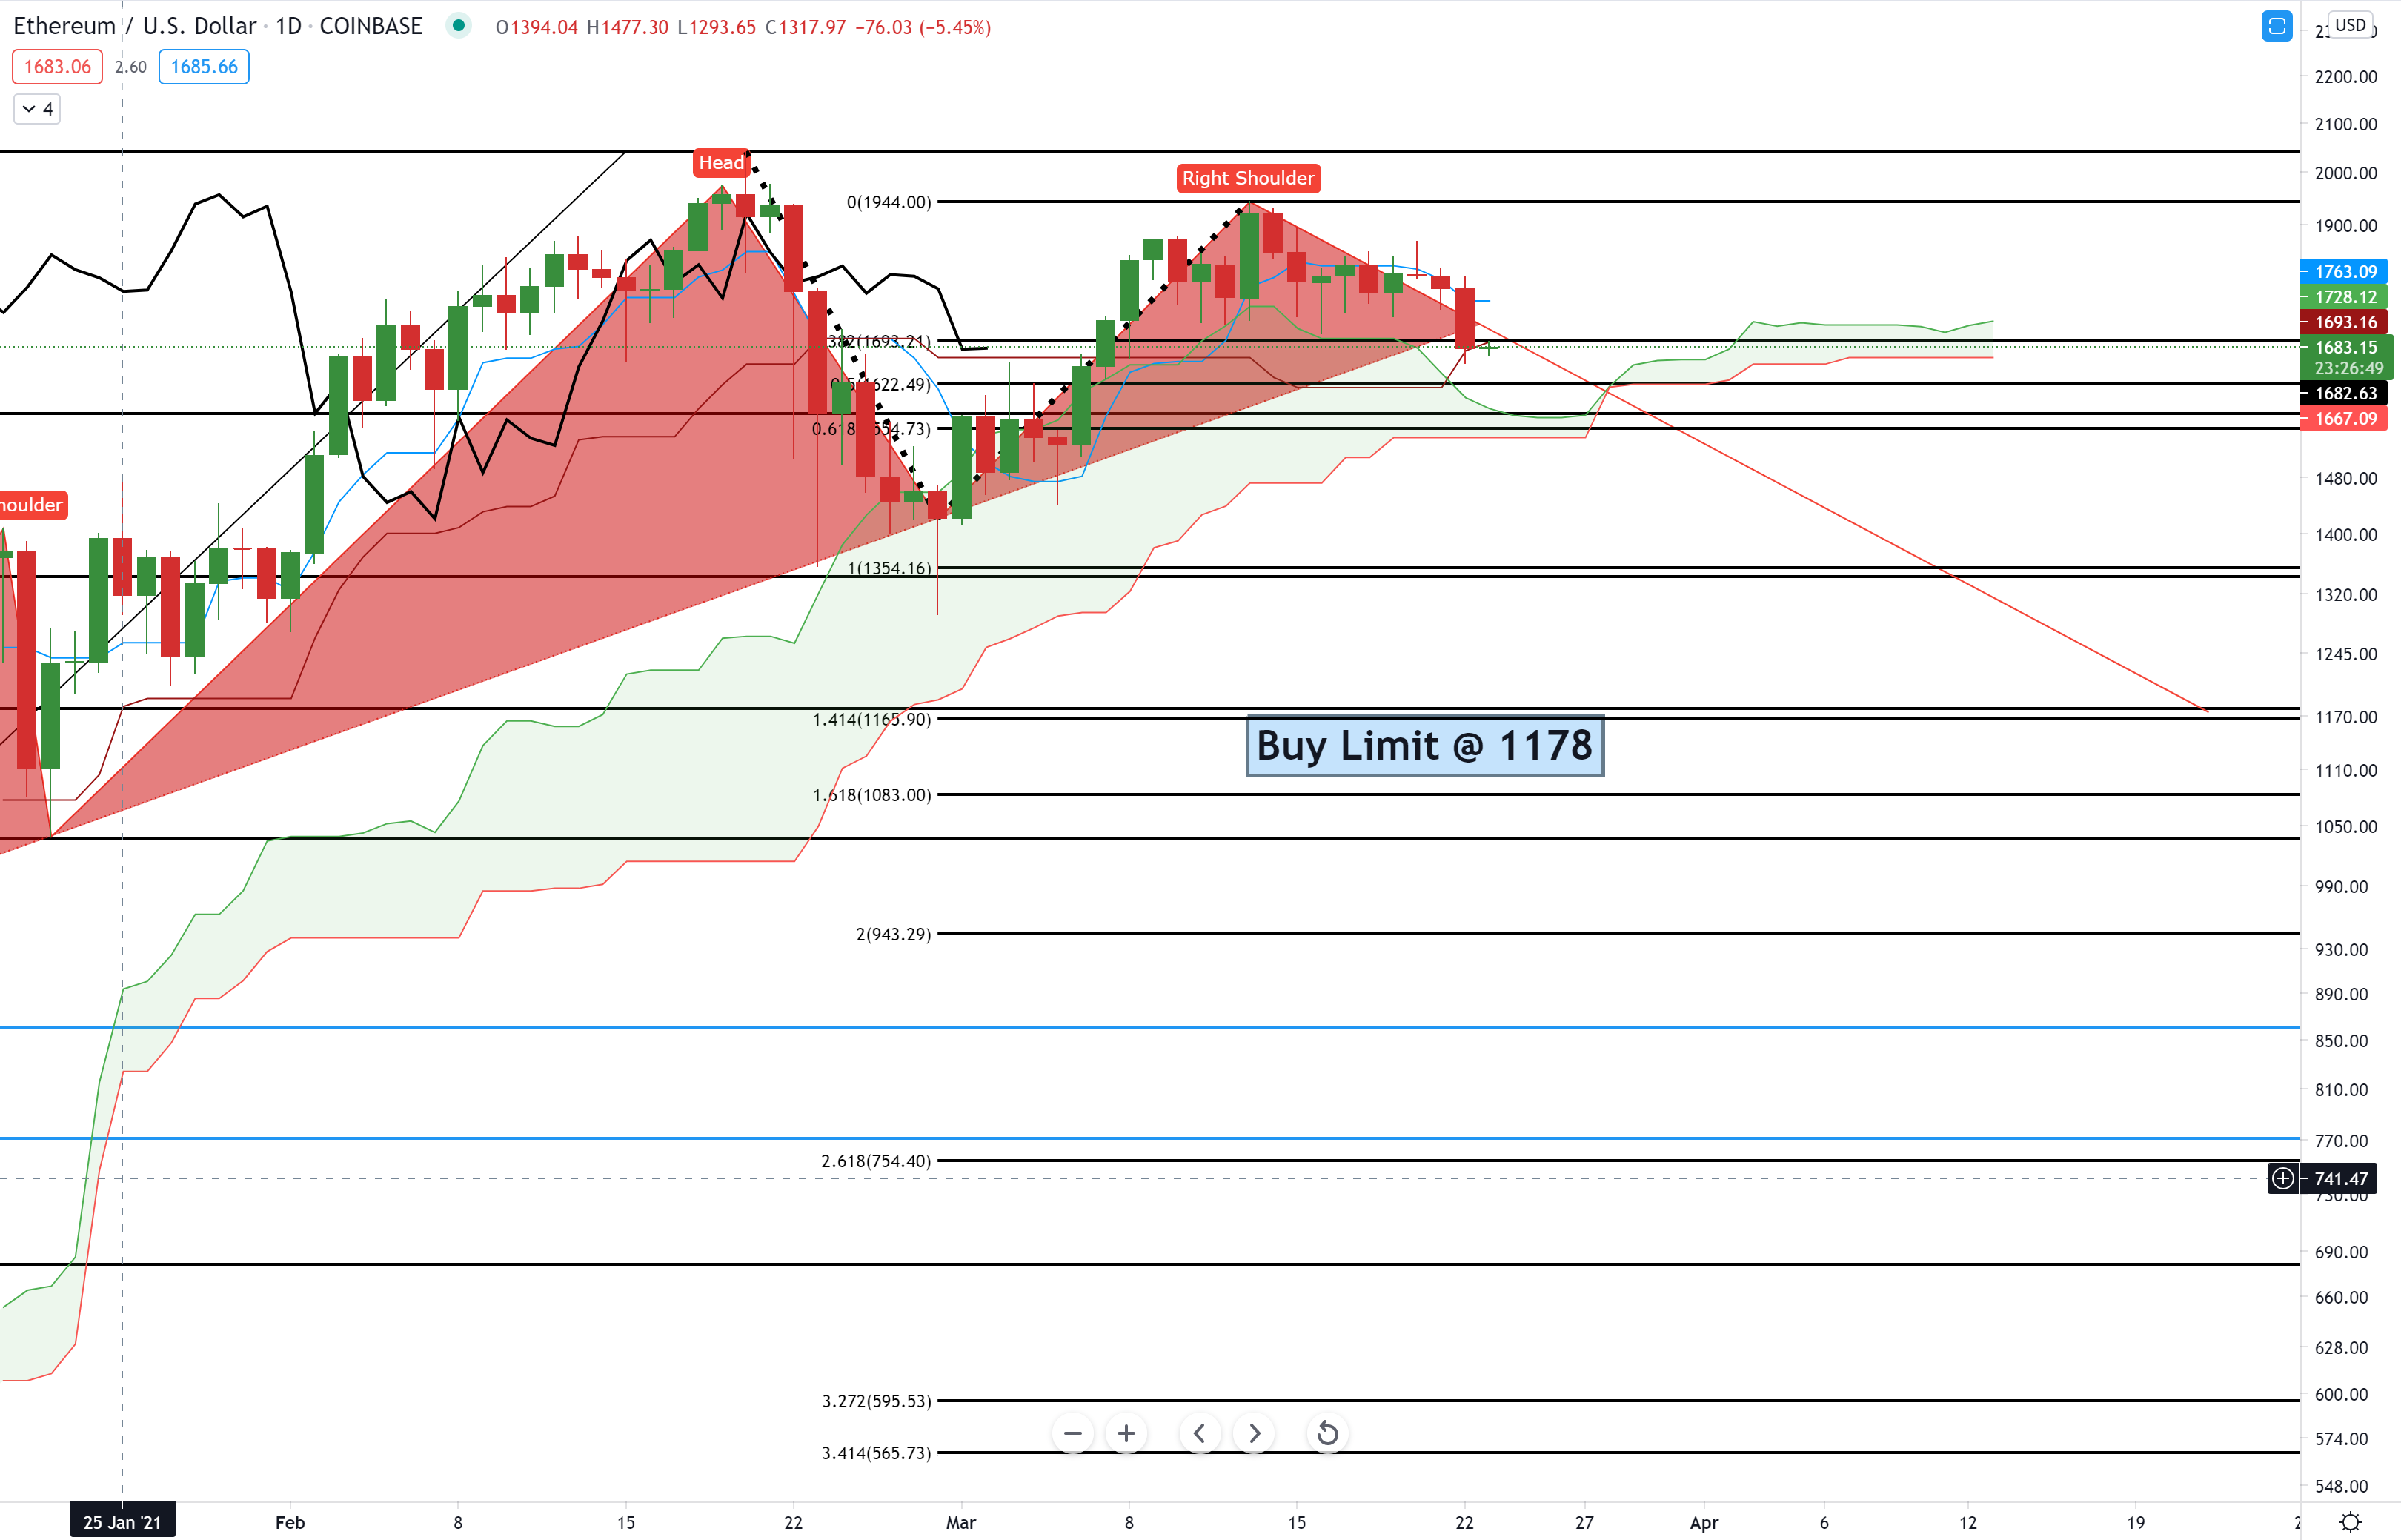
Above: Ethereum (ETH/USD) Daily Ichimoku Chart
Ethereum’s daily chart shows a large head and shoulder pattern developing. An important level to watch for any strong drop is if Ethereum breaks the 1606 level. The buy limit order I’ve identified at 1178 is a confluence zone of two key Fibonacci levels. The first level is at 1178 – the 50% Fibonacci retracement of 2041 to 680. The next level is at 1165 – the 141.4% Fibonacci extension of 1426.24 and 1944. Consequently, this level is also the Kijun-Sen on the weekly chart. I am looking to place some limit buy orders at 1035.71 as well. 1035.71 is the 61.8% Fibonacci retracement level. Why would I put a limit order at this level? Because when cryptocurrencies experience a corrective move, some cryptocurrencies often see flash crashes beyond normal levels.

Litecoin (LTC)
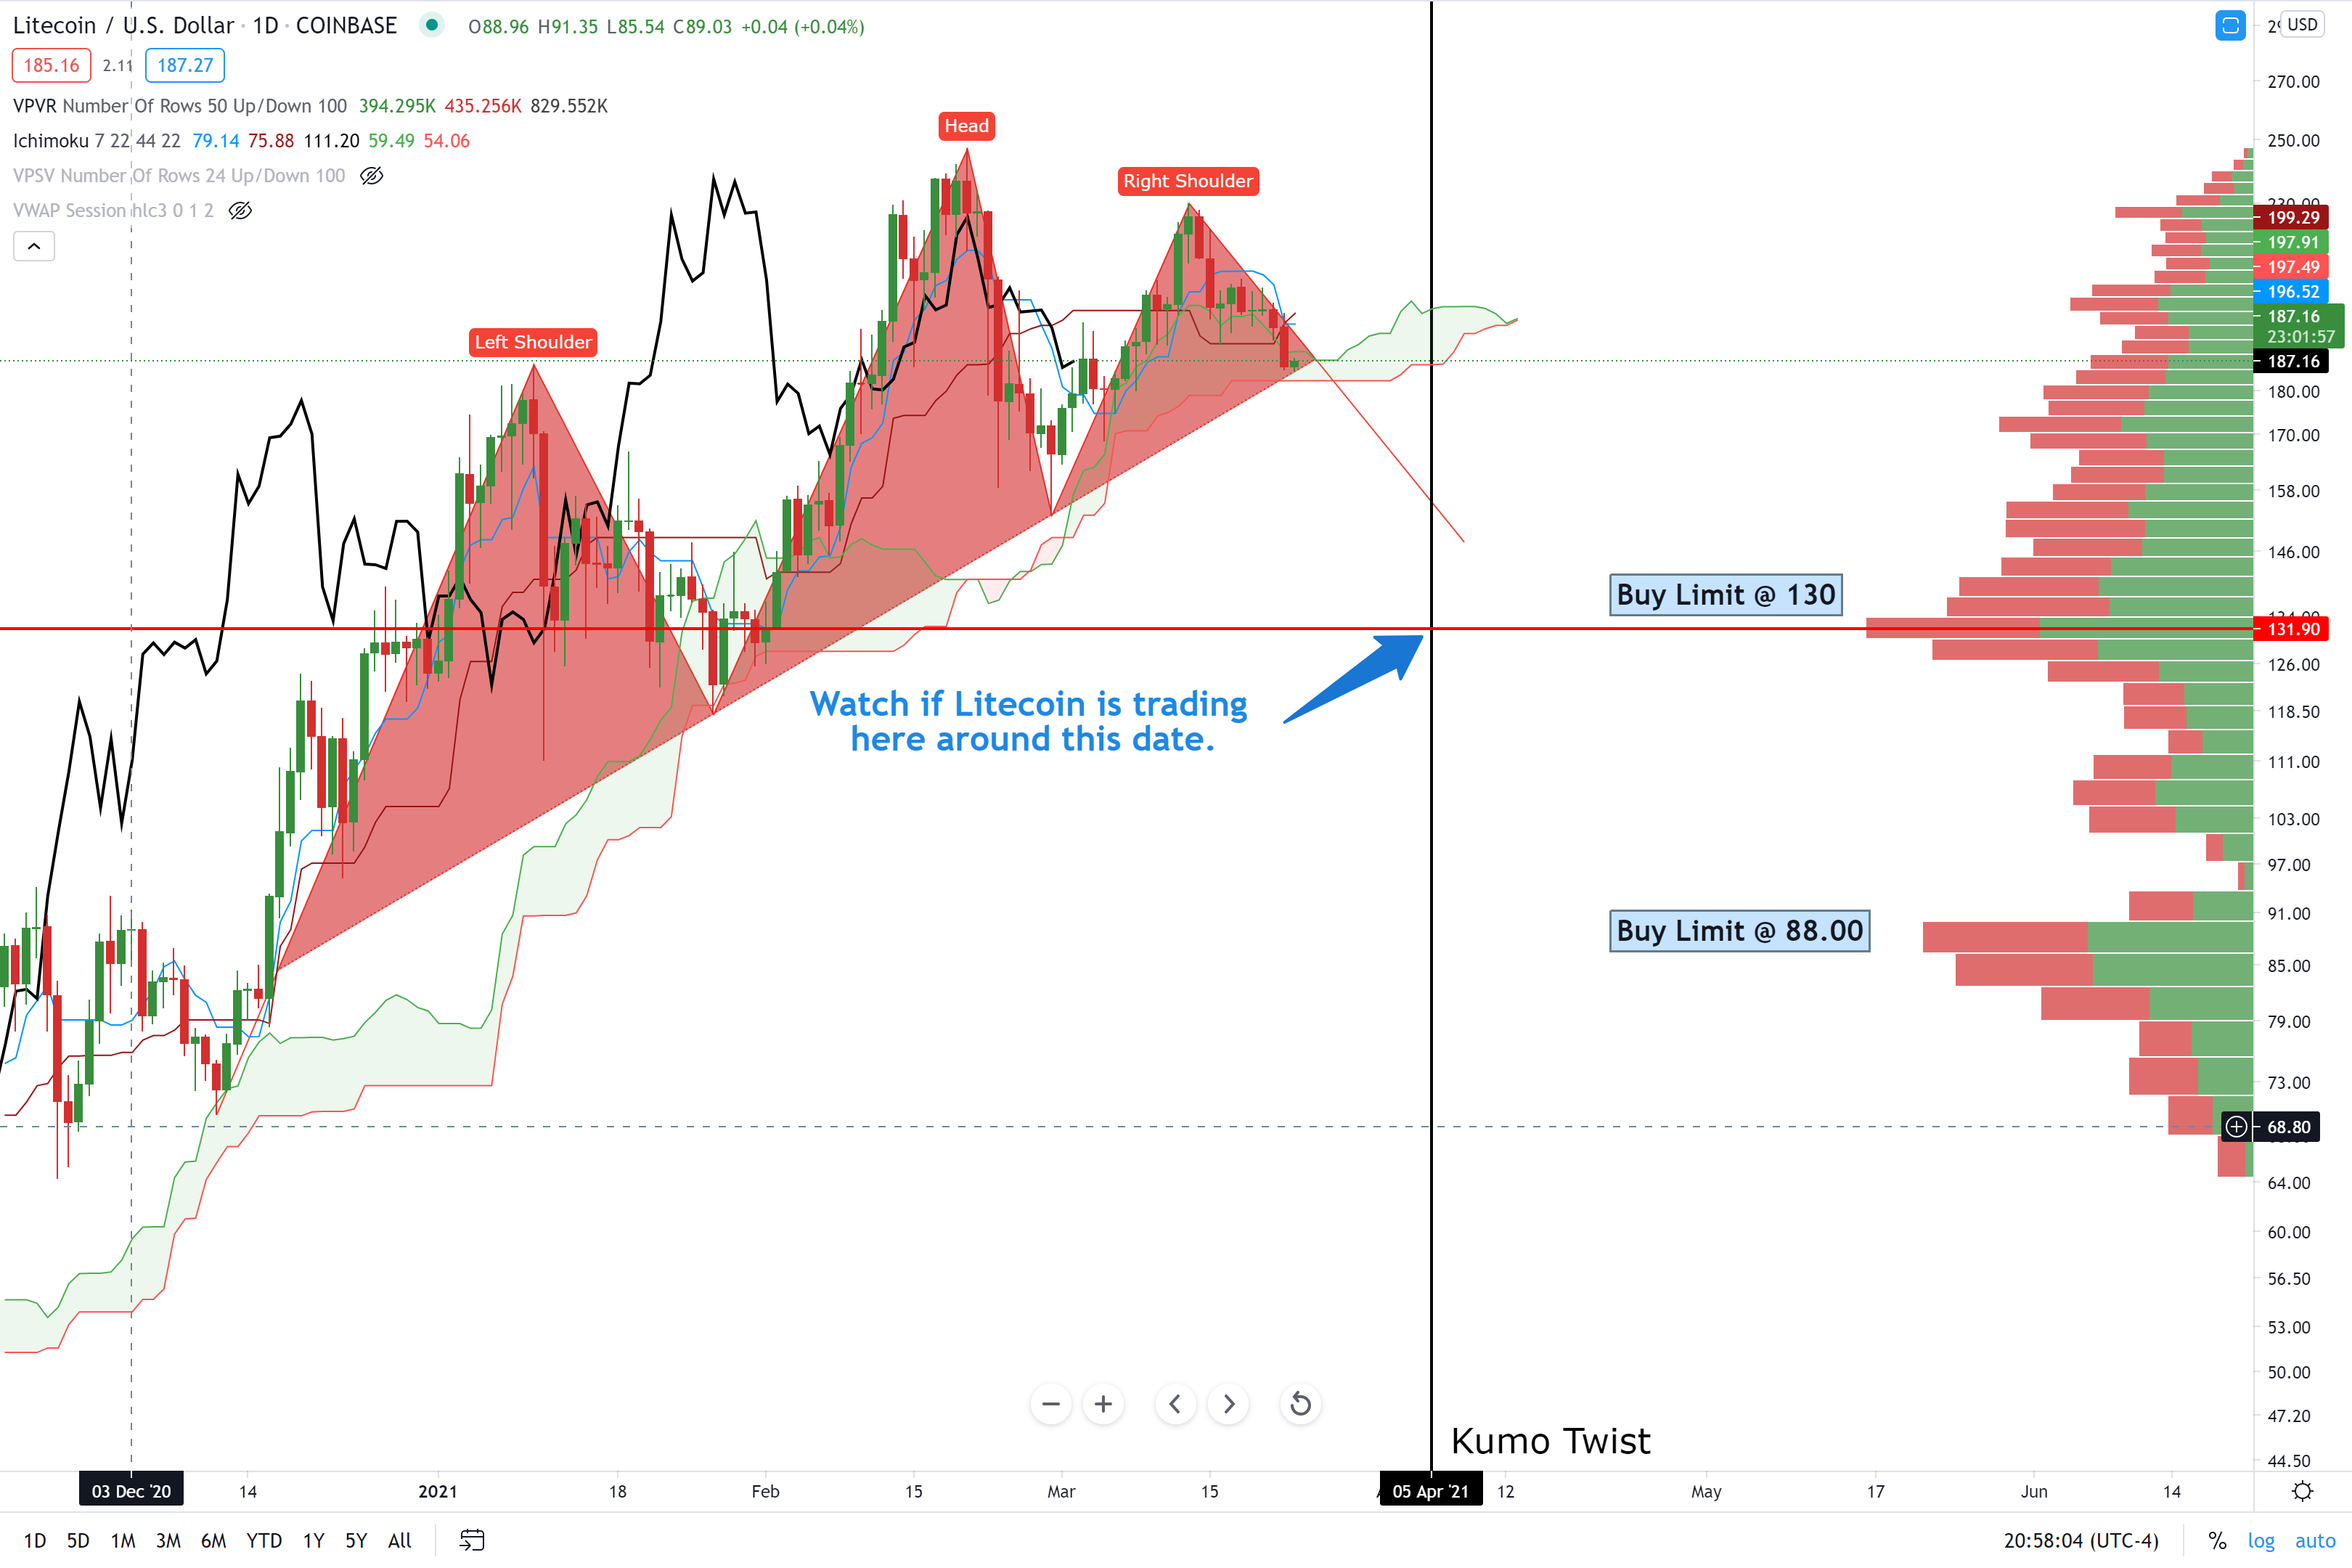
Above: Litecoin (LTC/USD) Daily Ichimoku Chart
Litecoin’s daily chart has a much better looking head and shoulders pattern compared to Ethereum’s – which is a good thing if you are bearish on Ethereum as Litecoin often leads Ethereum in trending and corrective moves. The breakdown below the neckline on Litecoin’s chart occurs when price would drop below the bottom of the cloud. I’ve identified two buy limit levels that are based strictly on the Volume Profile. The buy limit at 88.00 is to catch any flash crash move. The buy limit order at 130 is the VPOC (Volume Point Of Control). Take note of the vertical line on April 5th, 2021. That date is when the Kumo Twist occurs on the weekly chart. Kumo Twists are an interesting component in the Ichimoku system because it is an event that appears on the chart 26 period ahead of the current candlestick. Kumo Twists often give the earliest hint of when a new trend will occur. If Litecoin is trading at 130 or below around April 5th, that could be the date we see the uptrend resume.
READ: Cardano Technical Analysis, Charts: ADA Price Prediction and Foldback Patterns [Video]
Advertisement
Save money on your currency transfers with TorFX, voted International Money Transfer Provider of the Year 2016 – 2020. Their goal is to connect clients with ultra competitive exchange rates and a uniquely dedicated service whether they choose to trade online or over the telephone.
Find out more here.