
- Bitcoin is likely to flip bullish in the near-term as PlanB predicts the price rally as high as $288,000.
- Ethereum downswing to intensify if losses extend below ascending parallel channel support.
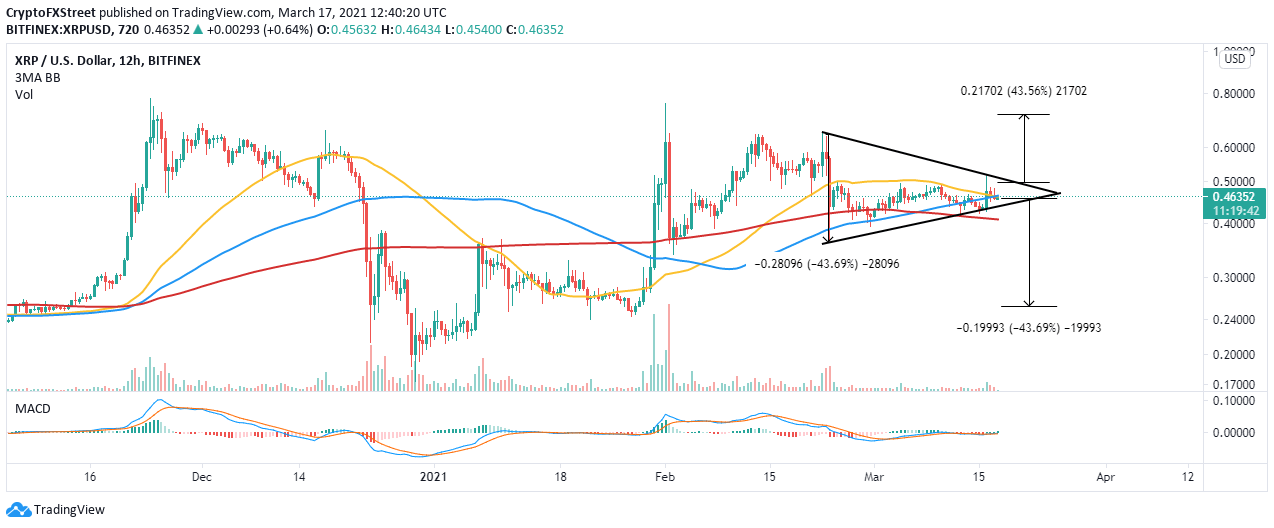
- Ripple eyes a 44% upswing to $0.71 if the symmetrical triangle pattern matures as anticipated.
Bitcoin corrected at the beginning of the week, sliding under $54,000 support from highs above $61,000. The entire cryptocurrency market was caught in the bearish wave with Ethereum testing support at $1,700. Ripple plunged close to $0.4 before making a reflex recovery above $0.5.
Meanwhile, Cardano (ADA) spiked over 20% following the listing on Coinbase Pro. The aspiring smart contract platform is among the few cryptocurrencies posting double-digit gains. Other well-performing coins include Filecoin (FIL) and Zilliqa (ZIL).
Bitcoin could soon flip bullish
Bitcoin embraced support around $53,150 following the colossal breakdown from the recently achieved all-time high. However, recovery has been lethargic for the bellwether cryptoasset. Meanwhile, higher support is needed for Bitcoin to flip bullish and recover the lost ground above $60,000.
The seemingly imminent bullish outlook has been accentuated by the SuperTrend indicator, as observed on the daily chart. This indicator has just given a signal to traders to go long on BTC. If stability returns to the market, Bitcoin will shift the focus back to $60,000.
BTC/USD daily chart
PlanB, a pseudonymous prominent analyst, believes that Bitcoin is still beginning the bull run. The analyst’s Stock-to-Flow (S2F) model has been quite accurate amid the rally and has a prediction of $100,000 per BTC by the end of the year. However, PlanB says that the bull run will not stop here but will soar to highs around $288,000.
December close: $28,992
January close: $33,141
February close: $45,240
March 17 price: $55,000
We are only 3.5 months into the #bitcoin bull market. IMO BTC will not stop at $100K and will continue to S2FX $288K average price level (ATH will be higher). pic.twitter.com/skS6a7pepu— PlanB (@100trillionUSD) March 17, 2021
Ethereum losing traction as overhead pressure rises
Ether failed in closing the day above $1,800 on Tuesday. This sabotaged the recovery toward $2,000 and opened to ongoing declines. At the time of writing, Ethereum exchanges hands at $1,760 and testing support at the ascending parallel channel lower boundary support.
If the declines extend above this immediate support, massive sell orders will likely be triggered. On the downside, tentative support is anticipated at the 50 Simple Moving Average (SMA) and the 100 SMA on the 12-hour chart.
Note that the downtrend has been validated by the Moving Average Convergence Divergence (MACD). A bearish signal emerged when the MACD line crossed under the signal line. Besides, the indicator is still dropping toward the midline.
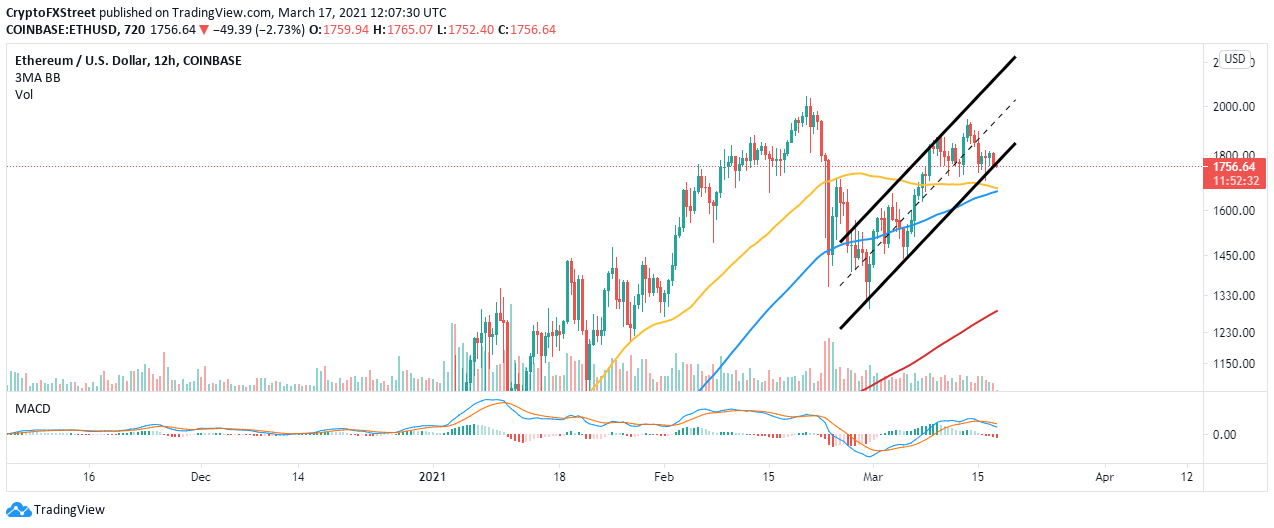
ETH/USD 12-hour chart
Ripple moving closer to a 44% move
Ripple is back to the drawing at $0.45 after failing to secure support above $0.5. However, bulls are not done with the assault mission to higher highs, considering that XRP is trading within the confines of a symmetrical triangle pattern.
A massive breakout is expected if the price slices through the upper trendline. Triangles have exact breakout and breakdown targets; therefore, Ripple would swing 44% higher and jump above $0.7.
Ripple must sustain the uptrend in the near-term for gains beyond the uptrend trendline of the triangle pattern. The MACD has reinforced the uptrend; thus, it is likely for XRP to make the breakout.
XRP/USD 4-hour hour chart
It is worth mentioning that if Ripple fails to hold above the immediate support provided by the 50 SMA and the 100 SMA, the breakout will be sabotaged. On the downside, the triangle may lead to a colossal breakout towards $0.24.