
- XRP is testing critical support in a longer-term bullish environment.
- Bulls need to get above daily resistance for prospects towards 39.356B.
The price action of Ripple has been volatile and huge with movements and ATR through the roof, for the highest levels again since late November to end of Dec 2020.
Daily ATR
The following is a top-down analysis that illustrates the recent price action and where the next opportunity might show up on the daily and 4-hour time frames:
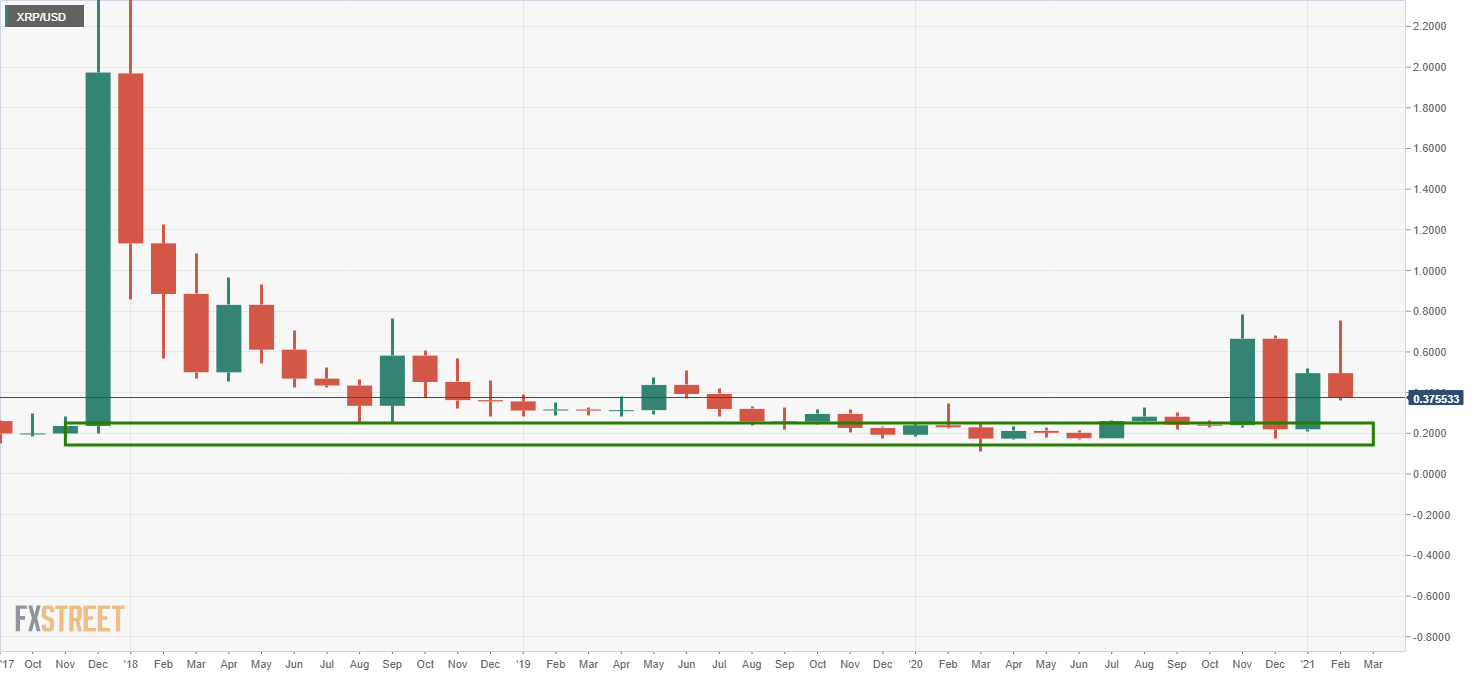
Monthly chart
It’s been getting busy in crypto again!
Weekly charts, 1
-637478172493586024.png)
The price has been volatile with huge price swings on a weekly basis.
The initial block of flow created an M-formation and the price respected the 38.2% Fibonacci retracement of the bearish impulse.
the price then pulled back and created a buying opportunity from support, subsequently rallying to test the neckline of the M0formation and thus leaving a new formation on the chart:
Weekly charts, 2
-637478174068779306.png)
The W-formation was created and following the impulse, a correction would be expected, again, to at least test the 38.2% Fibonacci retracement level.
Instead, as more than often happens, the neckline of the formation was tested where the price would now be expected to hold within the 61.8%and 50% Fibos.
Daily chart
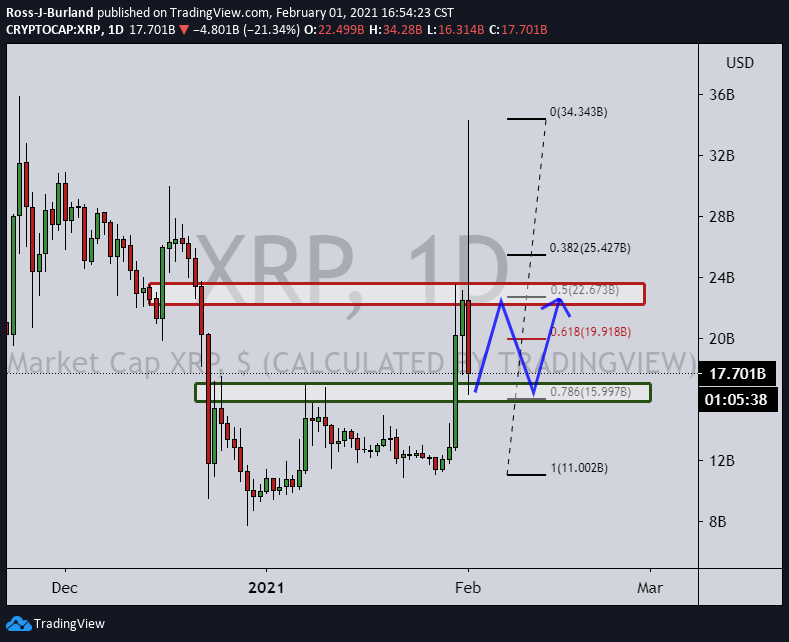
This leaves the outlook somewhat trapped between resistance and support on a daily basis.
4-hour charts, 1
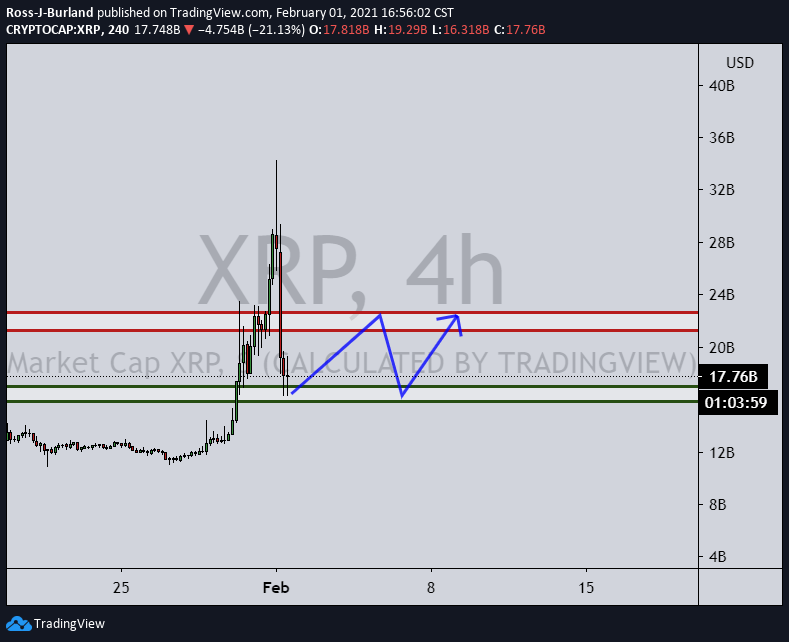
The 4-hour basis identifies the levels better.
4-hour charts, 2
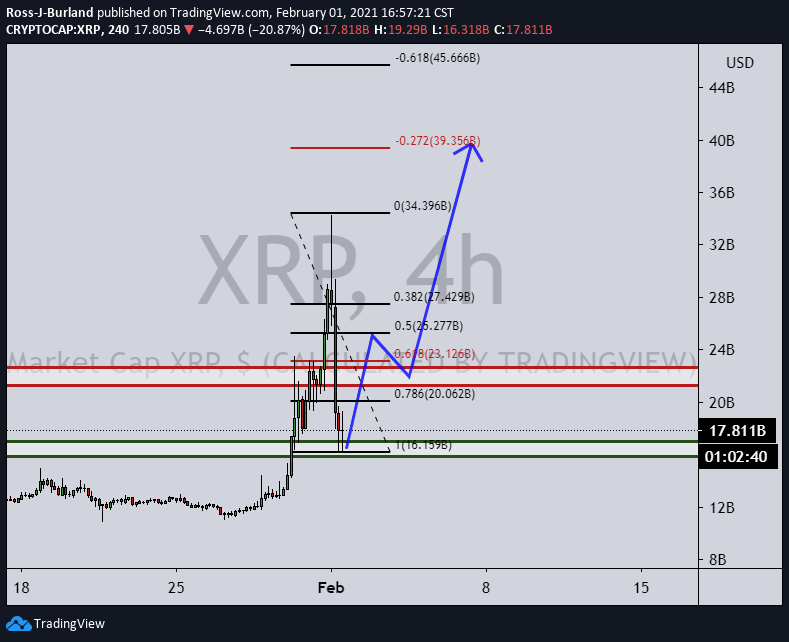
Given the bullish bias on the longer-term time frames, bulls will need to see price get above the resistance, where a restest of the structure would be probable.
An onwards rally to the -0.272% Fibo of the recent bearish correction’s range opens risk to 39.356B.