
- Litecoin price seems to be facing just one significant resistance barrier on the way up.
- The digital asset looks ready for a breakout above $230 into a new high at $280.
- However, LTC could see a significant pullback before a new leg up.
Litecoin faced a significant sell-off in the past 24 hours, like the rest of the market. Nonetheless, bulls bought most of the dip and aim for new highs as they only face one key resistance level before a massive breakout.
Litecoin price needs to crack $220 for a massive breakout
The In/Out of the Money Around Price (IOMAP) chart shows only one significant resistance area located between $217 and $223. Around 70,000 addresses purchased close to 2.2 million LTC here.
LTC IOMAP chart
A breakout above this point can push Litecoin price up to $280, which is the 127.2% Fibonacci level. A longer-term price target would be $338, the 161.8% fib level. The number of large holders with 10,000 to 100,000 LTC ($2,150,000 to $21,500,000) had a massive spike in the past 24 hours.
%20[16.40.25,%2015%20Feb,%202021]-637490006461426703.png)
LTC Holders Distribution chart
On February 14, this number was only 410 and has jumped to 421, which means 11 new large holders have entered the network in the past 24 hours, adding a lot of credence to the bullish outlook.
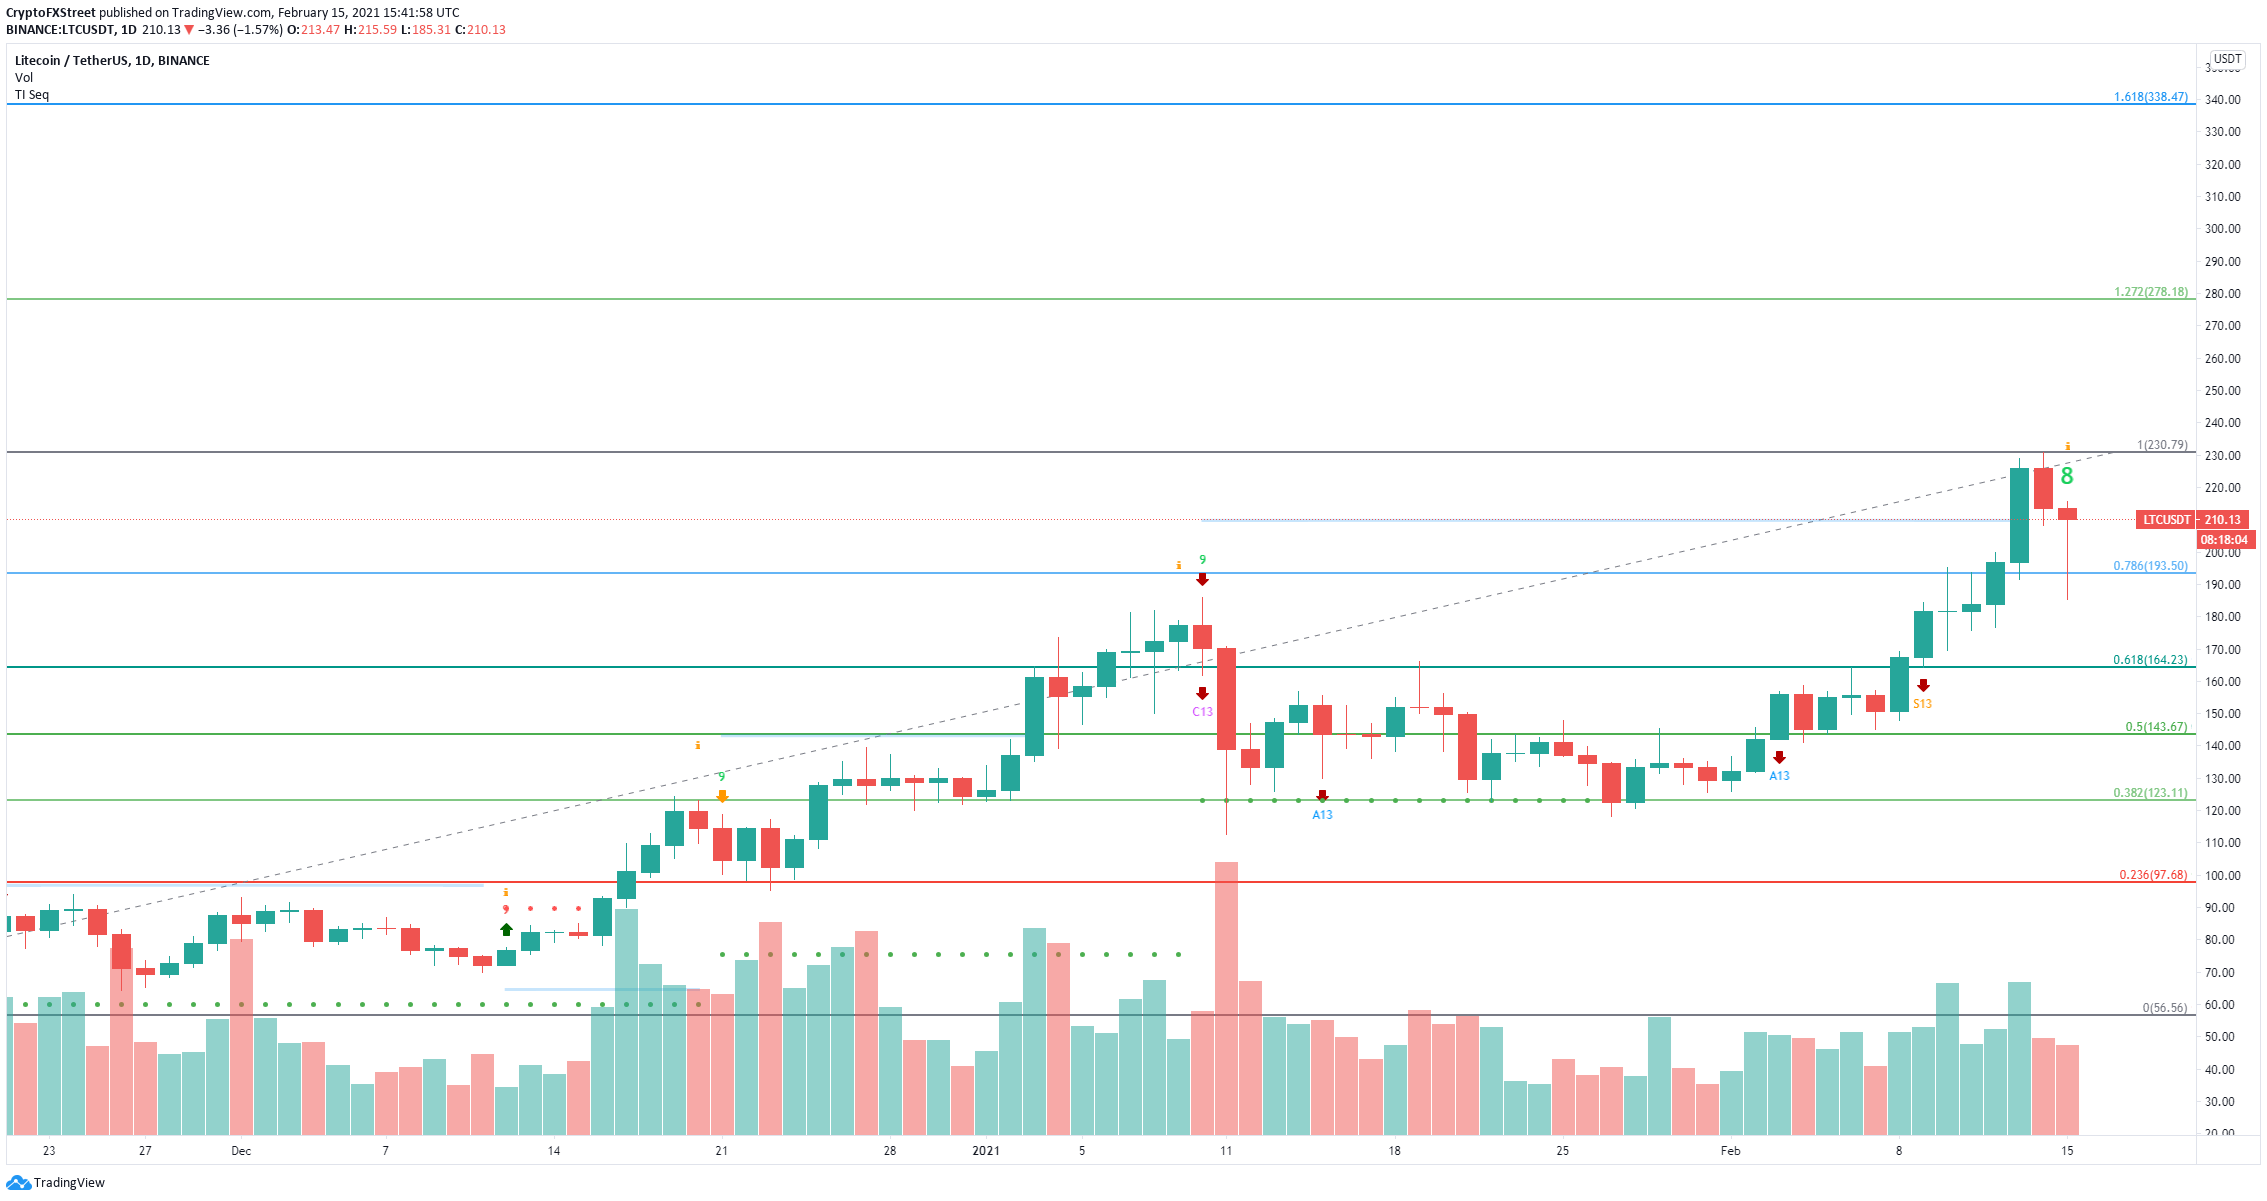
LTC/USD daily chart
However, on the daily chart, the TD Sequential indicator has presented a green ‘8’ candlestick which is usually followed by a sell signal. The IOMAP model shows less support on the way down. The most crucial area is located between $179 and $185. Losing this range can quickly push Litecoin price down to $164 at the 61.8% fib level.