

A Detailed Breakdown of Litecoin’s Four Year Cycles
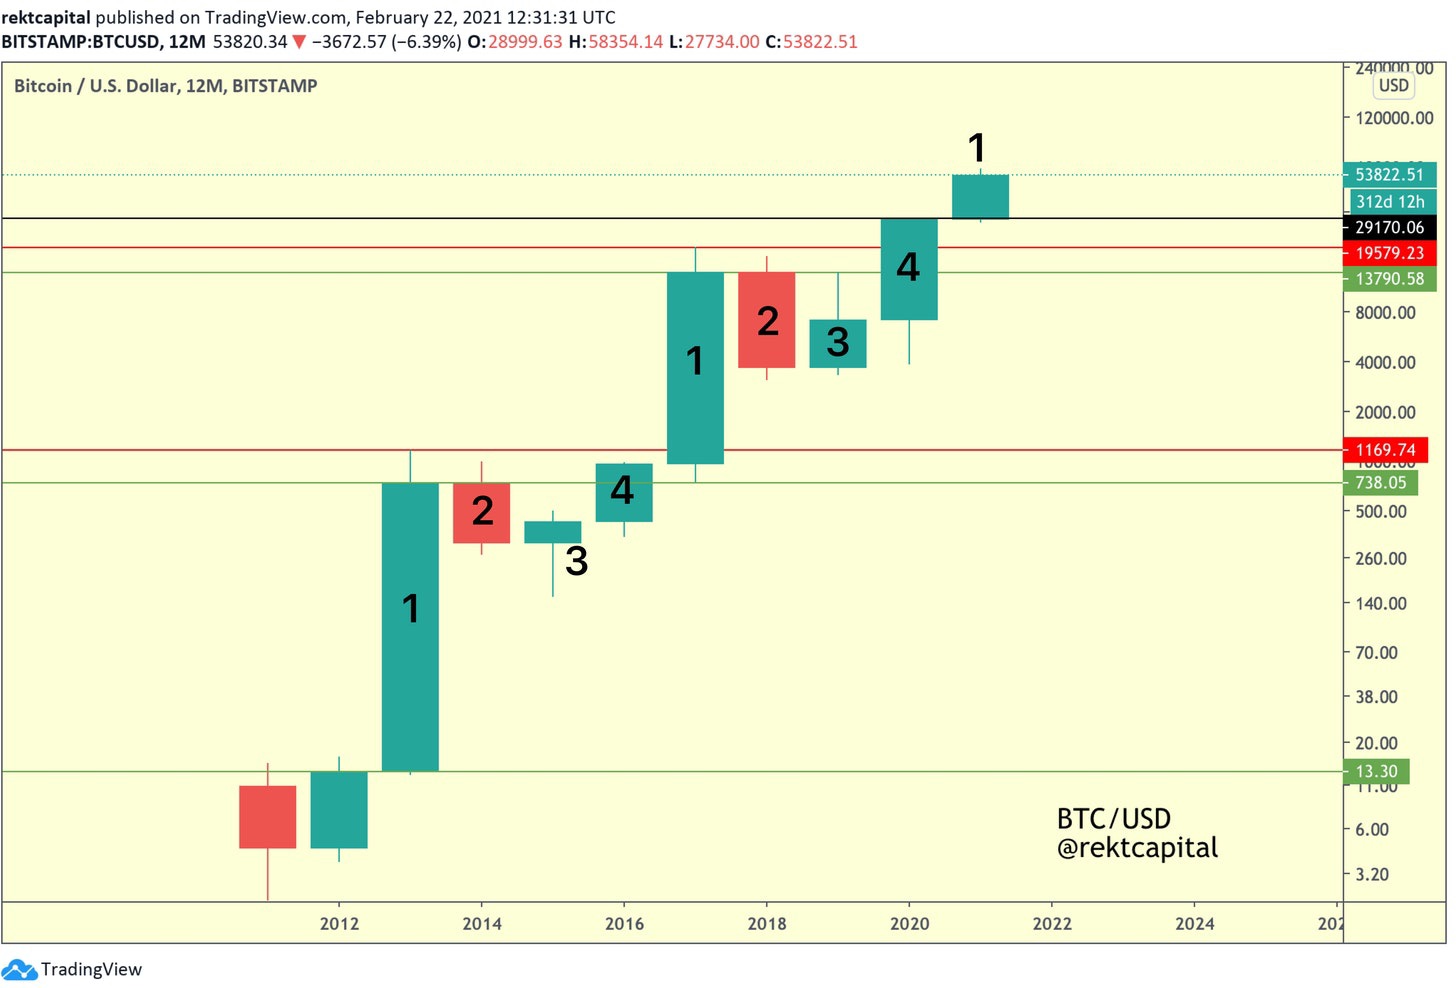
Here is the Bitcoin Four Year Cycle that I have discussed in previous newsletters:
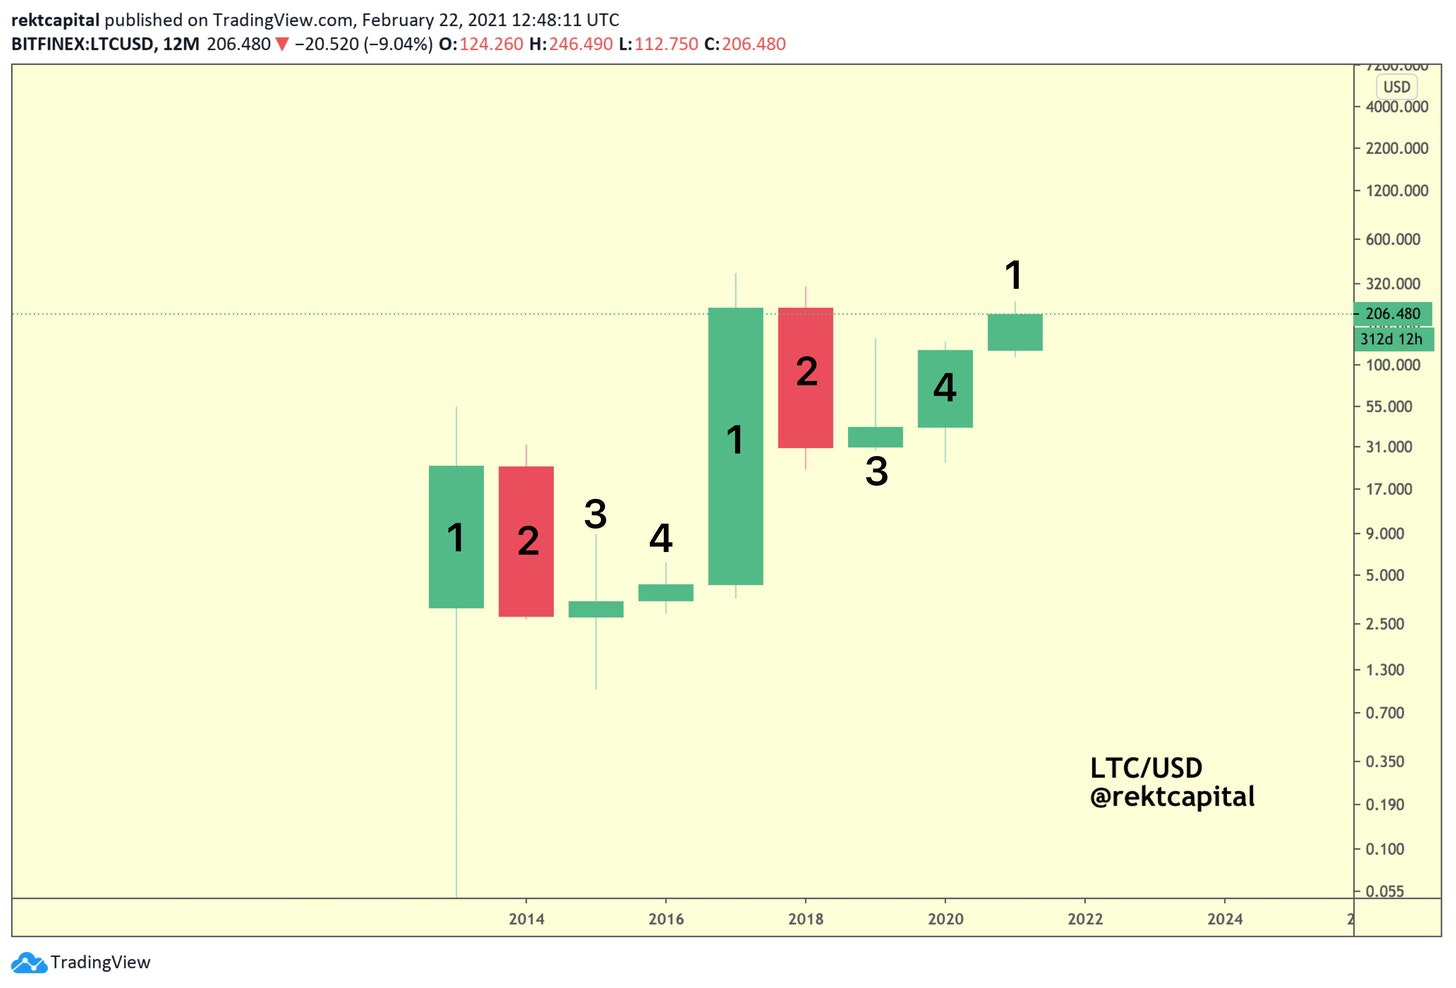
And if we zoom out to the twelve-month timeframe for Litecoin…
We’ll notice that the price chart is a spitting image of the Bitcoin 12 month chart.
Litecoin showcases a Four Year Cycle – just like Bitcoin.
And just like LTC/USD is lagging behind the price action of ETH/USD…
LTC/USD is actually also lagging behind Bitcoin in its own Four Year Cycle…
The Litecoin Four Year Cycle
Let’s dissect the Litecoin Four Year Cycle.
Candle 1 is arguably the most exponential phase in the Four Year Cycle where LTC/USD reaches a new All Time High.
Candle 1 is then followed by Candle 2 where a Bear Market correction occurs.
Interestingly, Candle 2 retraced -92% in both LTC 4-Year Cycles.
Candle 3 then follows which figures as the bottoming out candle.
Then comes Candle 4, which doesn’t eclipse Candle 3. In fact, Candle 4 forms a Lower High relative to Candle 3.
That said however, the bottom of the candle body of Candle 4 successfully turns the top of the candle body of Candle 3 into a new support to form a Higher Low.
This forms the very beginnings a of macro U-Shaped bullish reversal formation that precedes a new Candle 1 to begin a new Four Year Cycle for LTC.
The Multi-Year Downtrend…
Candle 1 plays a crucial role in the Four Year Cycle for Litecoin.
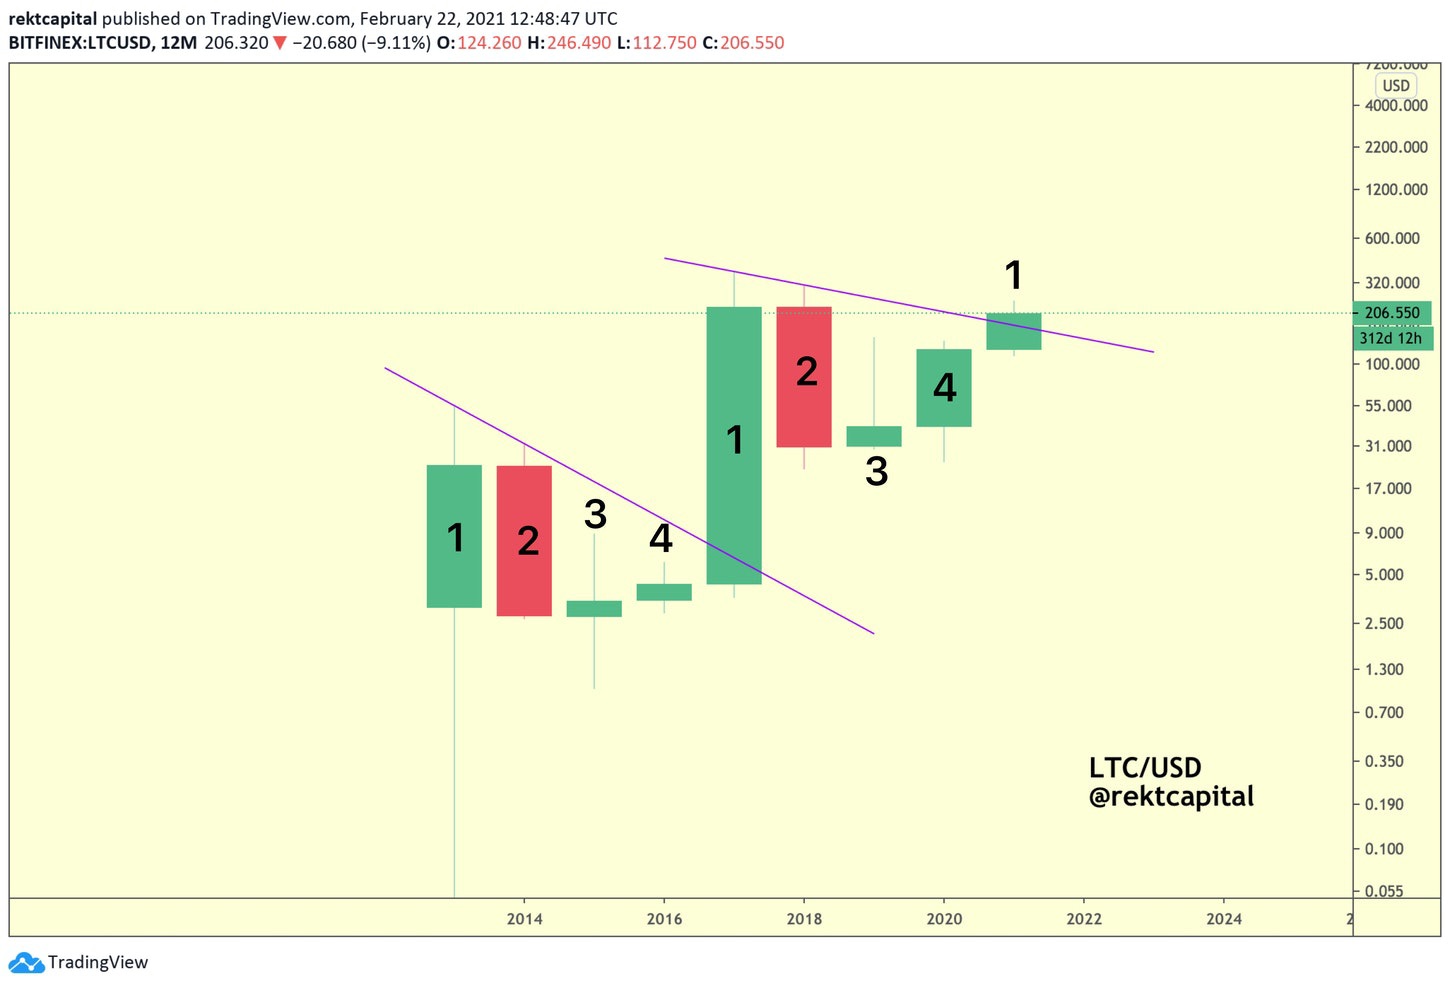
It is the first candle in four years to be able to break the multi-year diagonal resistances that has figured as a serious point of rejection for price.
This break of the multi-year trendline is what propels Litecoin to break its old All Time High (i.e. the ATH that was set in the previous Candle 1) and enter Price Discovery in search of a new All Time High.
Bitcoin also has a multi-year trendline resistance that consistently rejects price throughout its own Four Year Cycle:
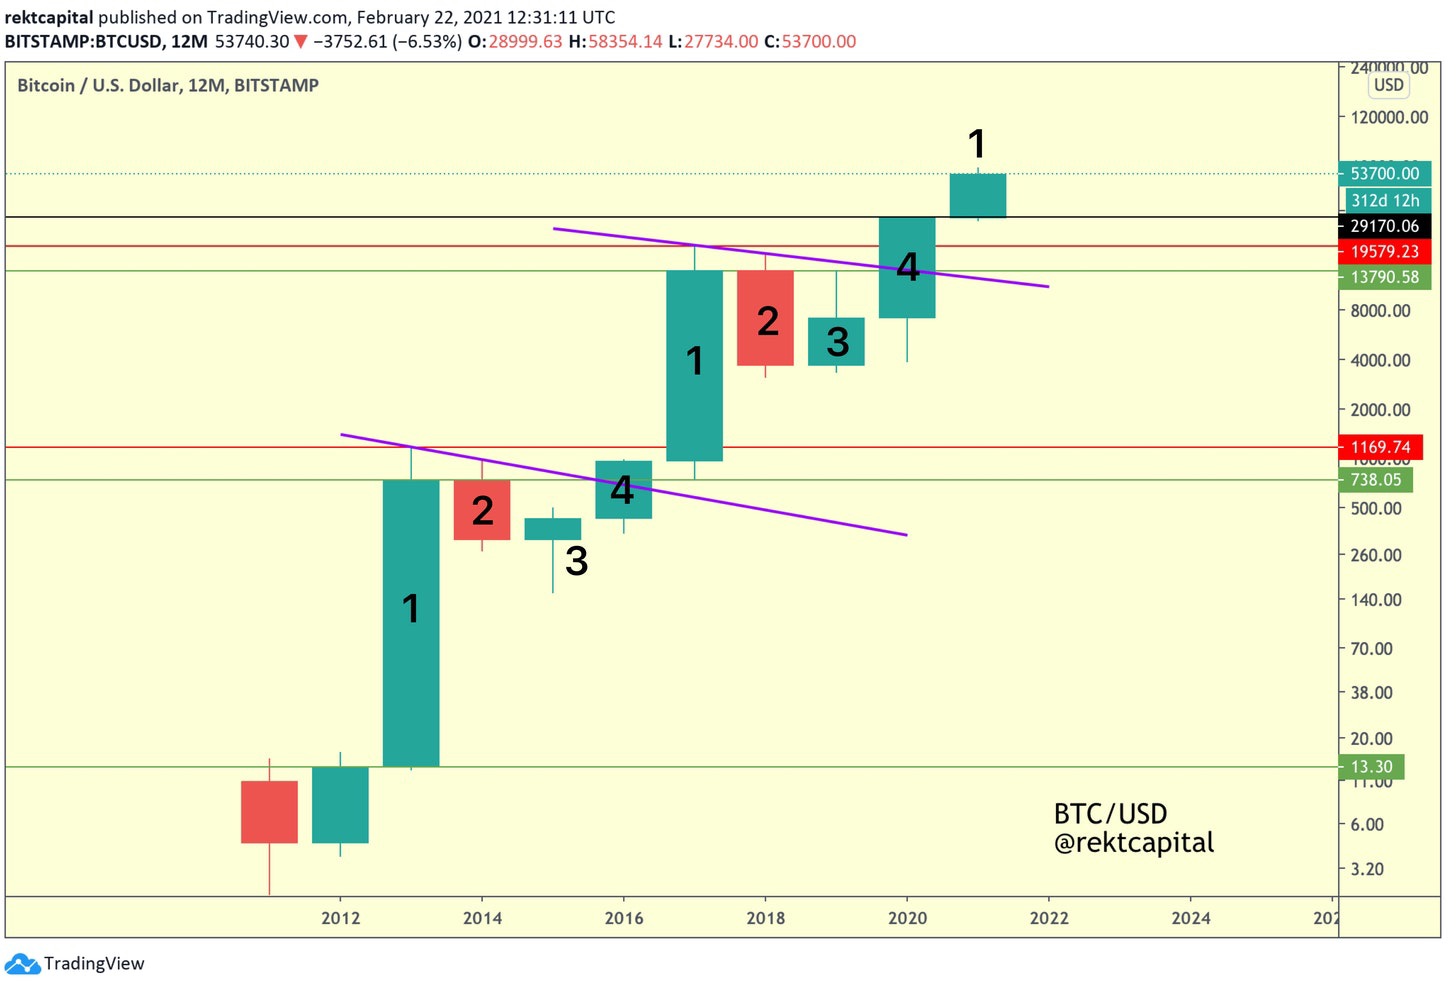
However the main difference here is that Bitcoin breaches this trendline much sooner than Litecoin does.
That is, this trendline acts as a resistance to Bitcoin’s price for three years, where Candle 4 is the candle that breaks the diagonal; for Litecoin, this trendline is broken after four years in Candle 1.
This a testament to Litecoin’s price-lag behind Bitcoin.
Key Four Year Cycle Levels for Litecoin

Let’s build on the insights mentioned earlier in the context of key Four Year Cycle price levels for Litecoin:
Throughout an entire Litecoin Four Year Cycle, price tends to maintain a consistent support (i.e. green level) throughout the years before finally taking off.
The First Litecoin Four Year Cycle (2013-2016)
For example, in the first Four Year Cycle for Litecoin, ~$2.70 figured as a pivotal support (green) which Candles 1, 2, and 3 maintained (though not without some downside volatility in the form of wicks).
Crucially, Candle 4 forms a Higher Low relative to the ~$2.70 support then turns the top of Candle 3 into new support upon the twelve-month candle close.
More, this Higher Low continues into Candle 1, whereby Candle 1 turns the top of Candle 4 into new support before spring-boarding into a new explosive uptrend.
The Second Litecoin Four Year Cycle (2017-2020)
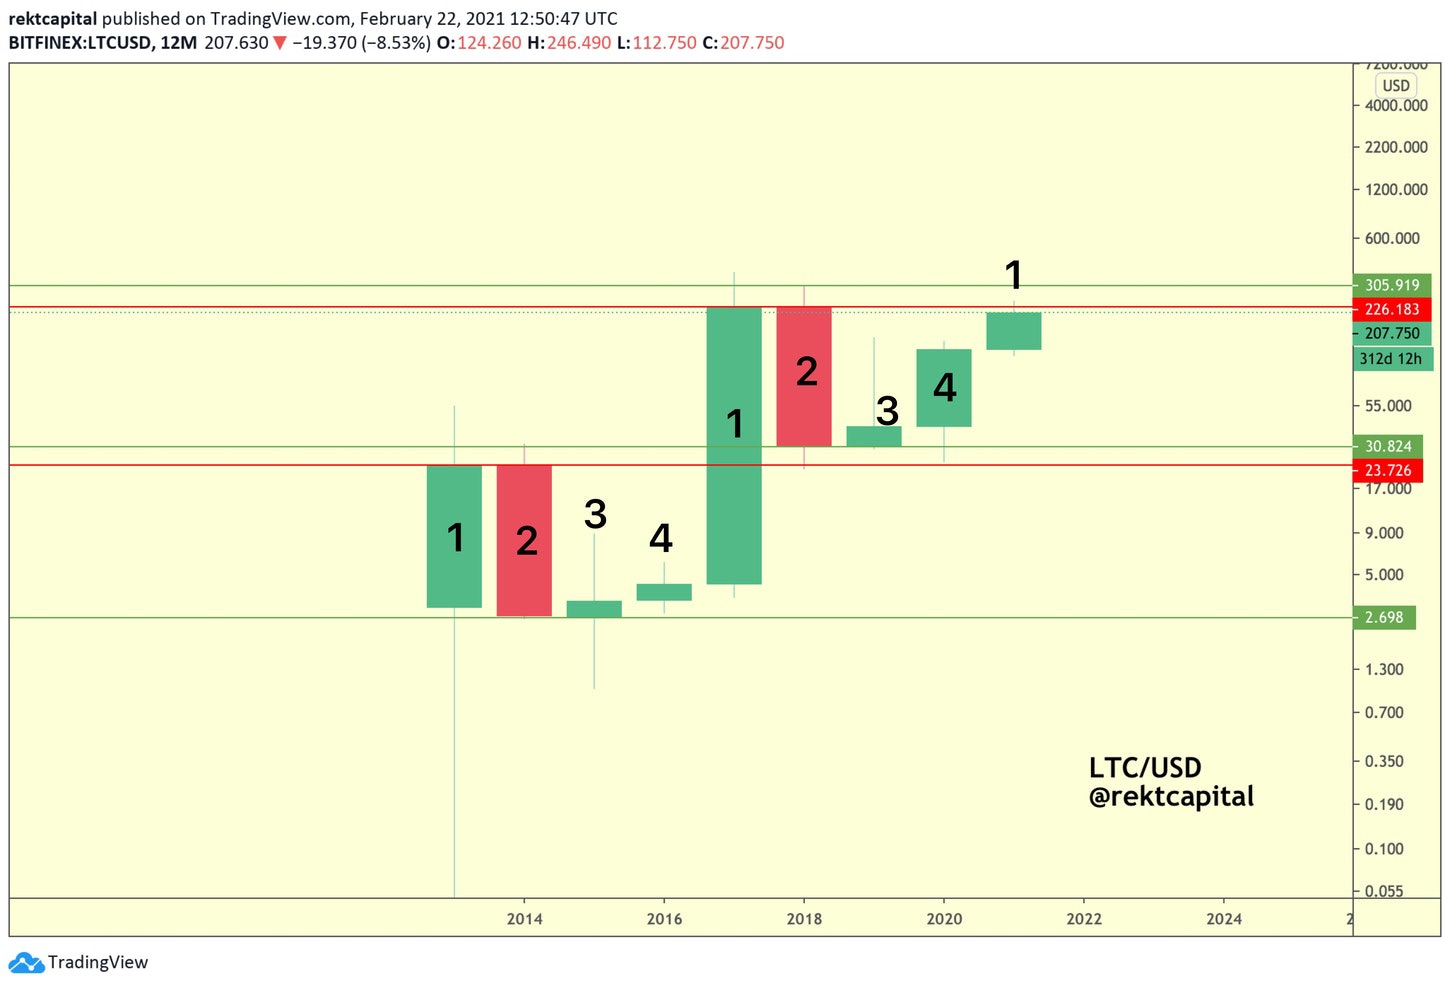
In the second Litecoin Four Year Cycle, price rallies to never-before-seen All Time Highs.
Candle 2 then forms and corrects -92%. In doing so, LTC produces a downside wick into the red horizontal level of ~$23.70 to turn this level into a new support.
After all, this very price level acted as a resistance in the 2013-2016 Four Year Cycle, specifically in Candles 1 & 2 of that cycle.
However, Candle 2 of the 2017-2020 cycle manages a candle close above the green horizontal level which was the previous resistance in Candle 2 of the previous 4-Year Cycle.
In sum – a new Candle 2 turns the top of an old Candle 2 into new support.
And in fact – the Candles 3 and 4 that follow continue to hold this new support (whereby the candle-body of a Candle 3 is of a similar size in every cycle).
Fundamentally, the old resistance of ~$23.70 that rejected the old Candle 1 and Candle 2 is successfully turned into a new multi-year support in the new Candles 2, 3, and 4.
Key Insights – Summary:
- Candle 1 rallies to new All Time Highs.
- Candle 2 then forms a Lower High relative to Candle 1 and begins a Bear Market.
- Candle 2 tends to retrace -92%.
- A new Candle 2 tends to turn the top of the old Candle 2 into a new support.
- This support is then respected by the ensuing Candles 3 and 4.
- Candle 3 wicks towards the upside to confirm the continuation of the multi-year diagonal resistance.
- Candle 4 turns the top of Candle 3 into support but forms a Lower High relative to Candle 3.
- Candle 1 turns the top of Candle 4 into new support.
- Candle 1 breaks the multi-year diagonal resistance.
- Candle 1 rallies to new All Time Highs.
- Steps 2 to 10 repeat.
The New Litecoin Four Year Cycle
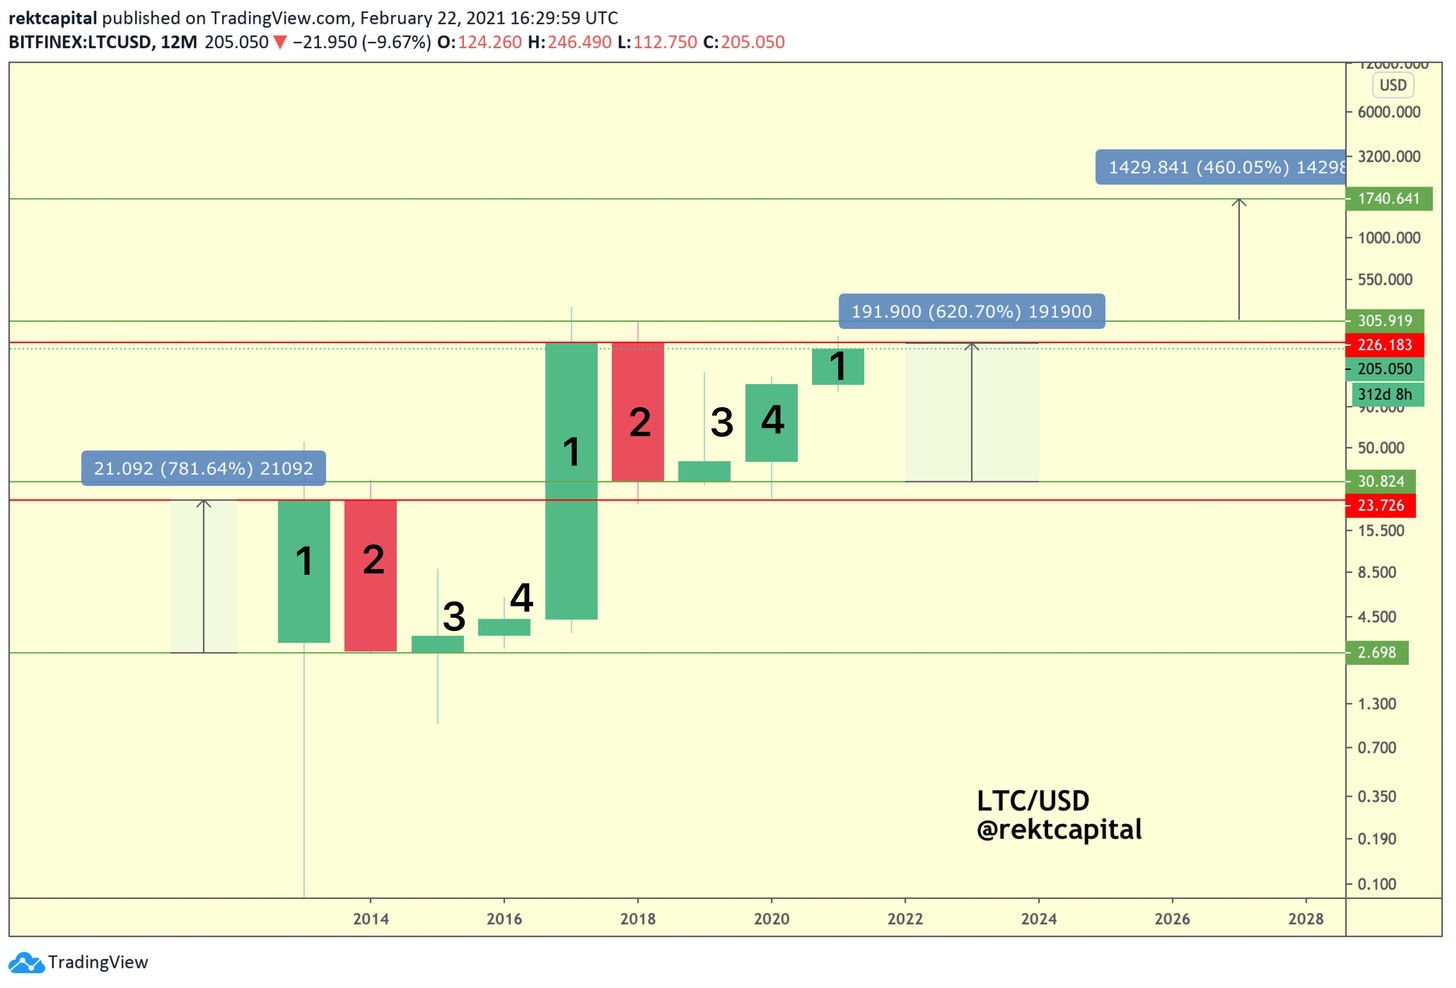
What could the next Litecoin Four Year Cycle look like?
Assessing the peak for Litecoin’s explosive Candle 1 uptrend in 2021 goes beyond the scope of this newsletter.
Instead, this final part of the newsletter is about what sort of price movement we might expect from Litecoin over the coming years.
But for the sake of discourse, let’s look to the only recurring constant in Litecoin’s Four Year Cycle – the Candle 2.
Each Candle 2 throughout history has retraced -92%.
Based on this insight, Litecoin therefore forms a green-red range that spans the entire candle-body of Candle 2.
In the first 4-Year Cycle, Litecoin rallied +781% from the bottom of the range (green) to the top (red).
In the second 4-Year Cycle, Litecoin rallied +620% from the bottom of the range (green) to the top (red).
So for the sake of discussion, let’s assume a diminishing rate of return by -160% (i.e. 780% – 620% = 160%).
If the Candle 1 were to rally +460% (i.e. 620% – 160% = 460%) then this sort of extrapolation would suggest a LTC Candle 1 peak in 2021 of around ~$1700 (not accounting for upside volatility/wicks).
So from then onwards – here’s what the Litecoin Four Year Cycle could look like, based on the key recurring technical price tendencies discussed throughout the newsletter thus far:
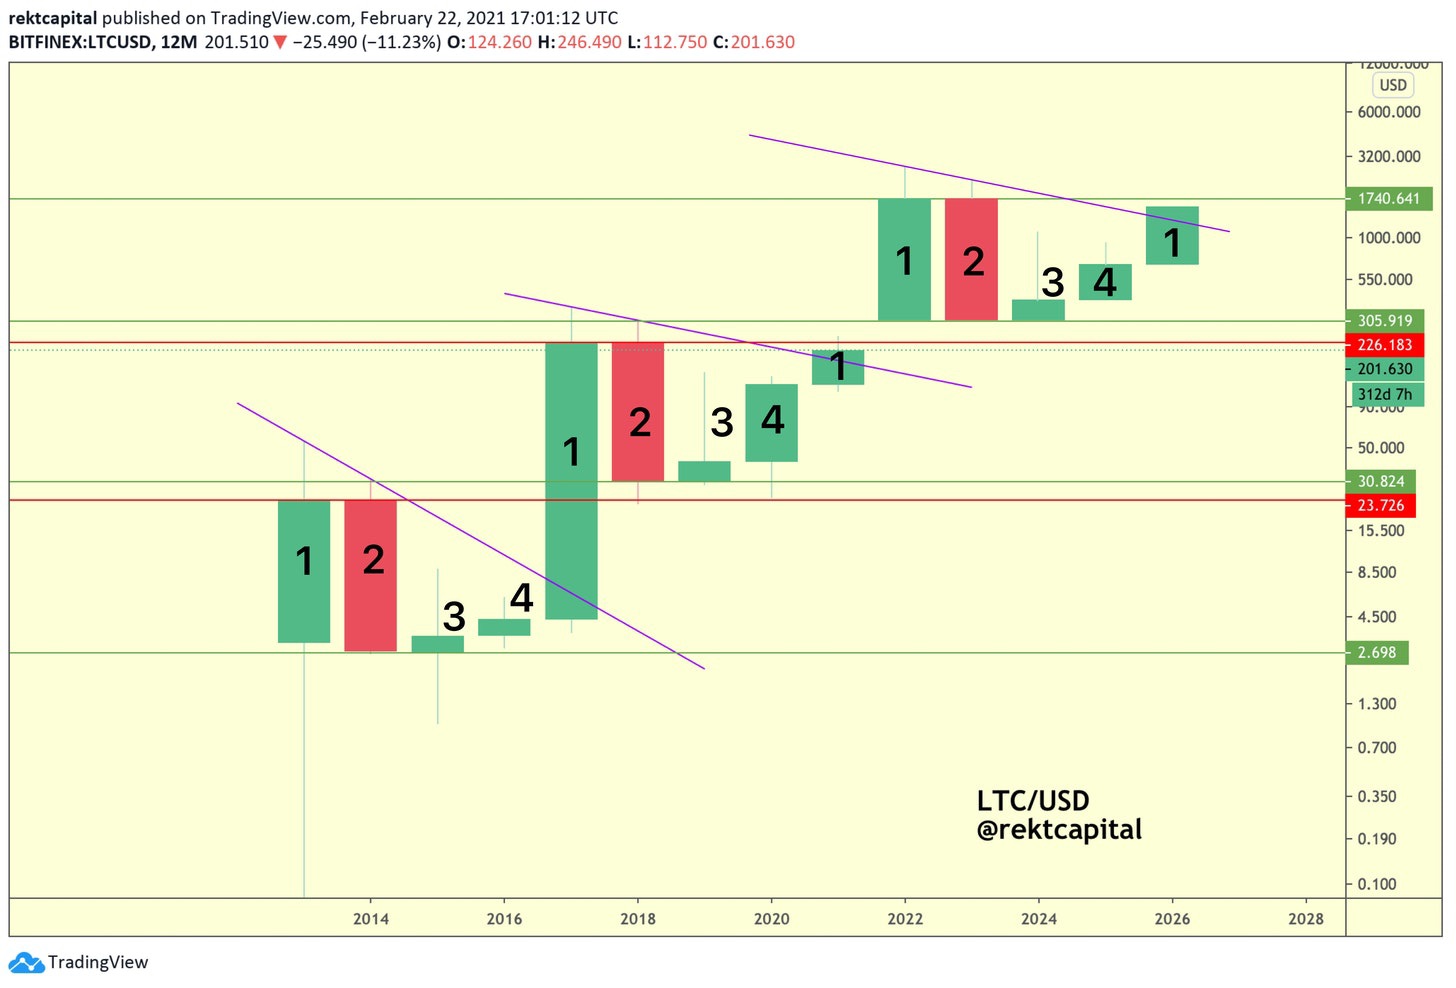
Wherever the explosive Candle 1 in the new Four Year Cycle peaks, Litecoin would likely form a new Candle 2 where the upside wick of this candle would form a Lower High to the upside wick in Candle 1. This Lower High would figure as a resistance for the next few years.
In the new Candle 2, LTC would experience a new Bear Market, where price could retrace up to -92%.
Wherever the new Candle 2 manages a full-bodied twelve-month candle close, the bottom of said candle would figure as a key support for the years ahead.
The new Candle 3 would experience lots of volatility, but end up as a relatively small candle upon twelve-month close.
The new Candle 4 would turn the top of the new Candle 3 into support, but ultimately form a Lower High to the upside wick produced by the new Candle 3.
And lastly, the Candle 1 of yet another new Four Year Cycle would break the purple multi-year resistance to confirm the beginning of a new macro uptrend.
Overall, this extrapolation may be useful as a visual guide on what to expect from Litecoin’s price action for the upcoming years in its new Four Year Cycle.
Thank you for reading.
Previously published here
Tags
Create your free account to unlock your custom reading experience.