
- Litecoin price has received resistance from 200% Fibonacci levels
- Litecoin price breaching subsequent supports at $232 and $215
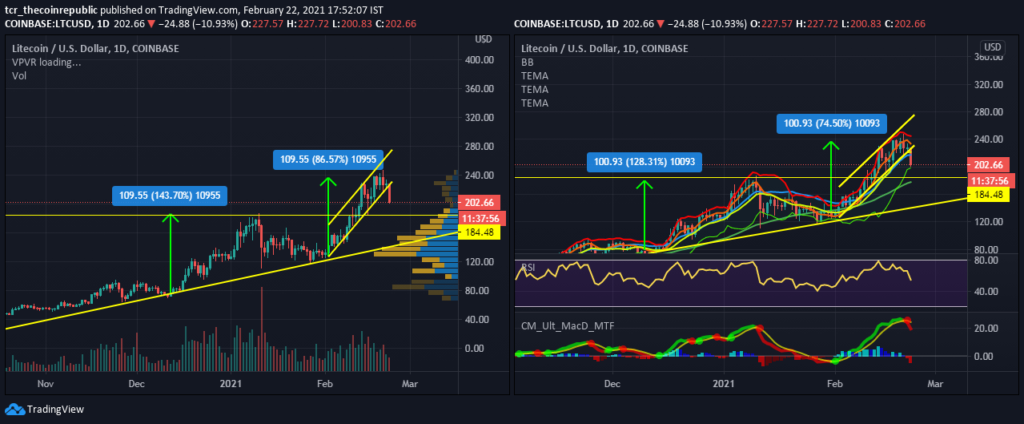
Litecoin price has breached the upward channel’s support and declined by 10% approximately in the current session. The volume analysis suggests that the bears have taken over the coin as the declining prices saw an increase in volumes, and the selling volume surged over the buying volume as per the range analysis. The market cap and 24-hour volume are $13,572,366,936 and $1,774,089,249 respectively.
Cause Of The fall In Litecoin price? Target Achieved, Needed A Breather
Litecoin price has declined in the current session after achieving its previously set target of $235-$237, which was measured based on the role of the flag and pole pattern it broke. Now the coin is making a bearish engulfing candle that has wiped up the past few sessions’ gains in a day. The crucial resistance can be $255, $232 and $215, while support may exist at $185(Previous top) or $160.
The right image indicators show that the price has declined below the 10EMA, 20EMA and 50EMA; these EMAs will start acting as resistance now; their current levels are $222, $235 and $217, respectively. 200 EMA is the crucial support now, which is buzzing at $180 levels.
The Bollinger bands now favour the bears, as the upper band has started declining while the lower band is falling; this indicates one-sided movement. The lower band has provided support to the price today, at $200, while the resistance and median (10EMA) are resistance at $244 and $222, respectively.
RSI levels are 56.5, and the support is expected at 37-45 zones. The cause of the decline also lies with RSI, which made a lower top while the price made similar tops; this proved as a negative divergence and brought in profit booking due to the declining in strength.
MACD(8,21,5) made a bearish crossover and at the levels of the previous top. The current levels are 26.5-27 but can find supports along 13-14 and 9-10 levels.
Conclusion –
Litecoin price has reversed with all the confirmations, which involves volume analysis, EMA and a triplet of indicators -Bollinger Bands, RSI and MACD. Reversal can only be expected at $185 levels, with strong support made by the previous top of the coin.
Support: $200(lower BB), $185(previous top) and $160(78.65 Fibonacci level)
Resistance: $215(27.2% Fibonacci Level), $232(141.4% – Fibonacci Level) and $254(Last Top)
Get this news hand-delivered to you on Telegram. Join our Telegram for similar News and Information related to CRYPTOCURRENCY, BITCOIN, BLOCKCHAIN NEWS, and price prediction.