
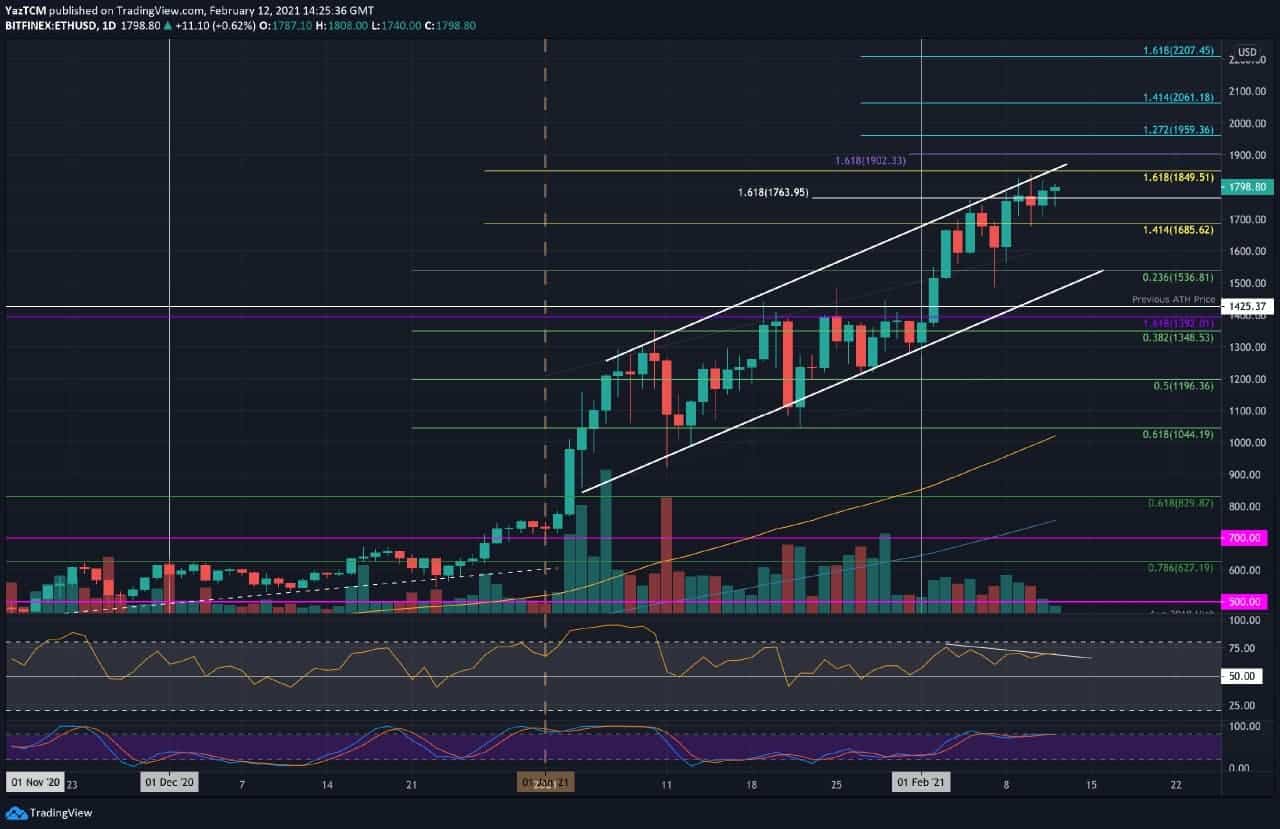
ETH/USD – Hints Of Bearish Divergence Showing
Key Support Levels: $1685, $1600, $1536.
Key Resistance Levels: $1800, $1850, $1900.
Ethereum has now established another ascending price channel as it trades near the upper boundary. It had rebounded from $1300 at the start of the month and pushed higher to reach a new ATH at $1839 this week.
Over the past four days, Ethereum seems to be struggling to penetrate the resistance at $1800 as it couldn’t close a daily candle above it. For this bullish leg to continue, ETH must break $1800 and breach the ascending price channel’s upper boundary at around $1850.
ETH-USD Short Term Price Prediction
Looking ahead, the first resistance lies at $1800. This is followed by $1850 (1.618 Fib Extension – Yellow & upper boundary of the channel), $1900, and $1960 (1.272 Fib Extension). Added resistance above $2000 lies at $2060 (1.414 Fib Extension) and $2200.
On the other side, the first support lies at $1685. This is followed by $1600, $1536 (.236 Fib & lower boundary of the channel), $1425 (previous ATH), and $1350 (.382 Fib).
The RSI is showing hints of bearish divergence as it starts to head lower in February while the price has been grinding higher. If this plays out, ETH could see a drop toward the ascending price channel’s lower boundary.
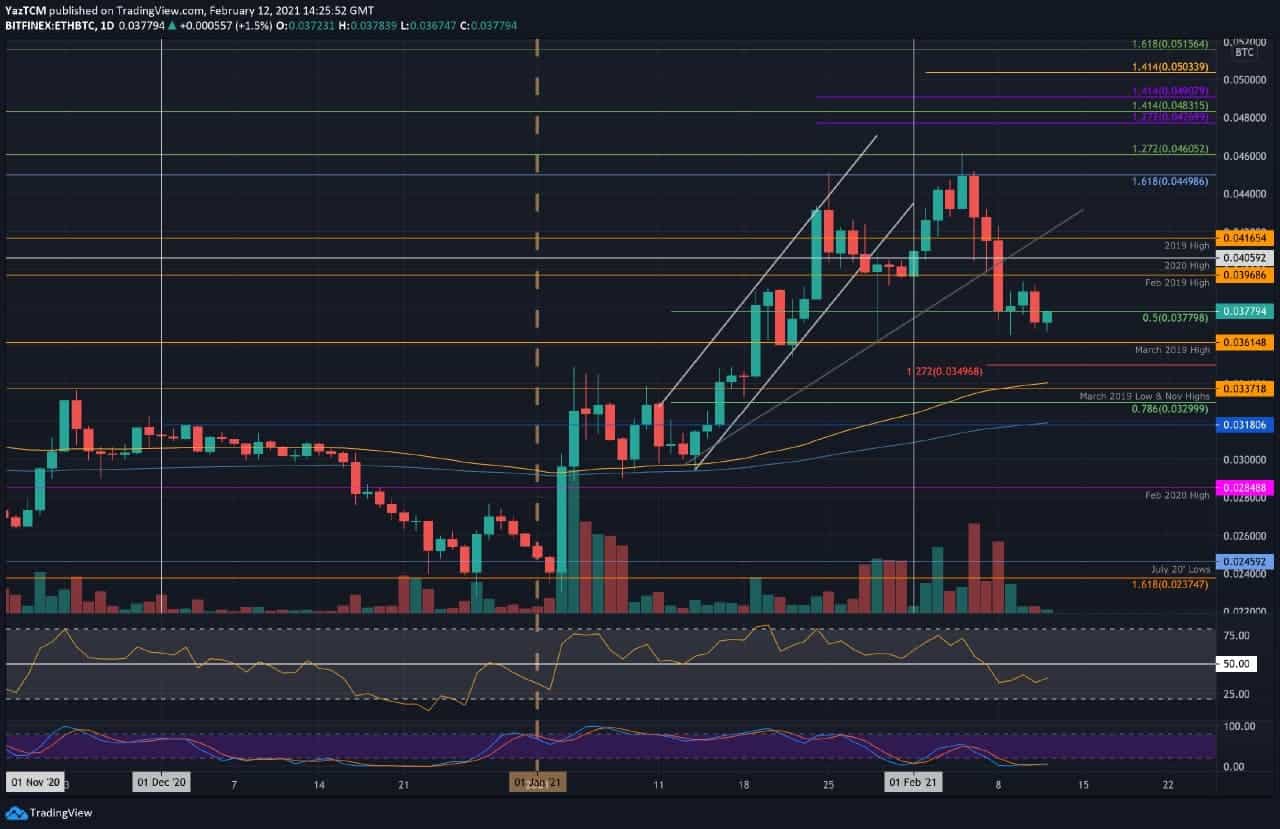
ETH/BTC – Market Falls 20% From Feb Highs
Key Support Levels: 0.0361 BTC, 0.0349 BTC, 0.0337 BTC.
Key Resistance Levels: 0.038 BTC, 0.0396 BTC, 0.0405 BTC.
Against Bitcoin, Ethereum is starting to show signs of weakness after dropping almost 20% from the Feb high of 0.046 BTC. It penetrated beneath an ascending trend line earlier in the week and continue to plummet from there.
The coin had been defending the support at 0.0377 BTC (.5 Fib) but crashed beneath this yesterday to reach the current 0.037 BTC level.
ETH-BTC Short Term Price Prediction
Looking ahead, the first support lies at 0.0361 BTC (March 2019 High). This is followed by 0.0349 BTC (downside 1.272 Fib Extension), 0.0337 BTC (Nov 2020 Highs & 100-day EMA), and 0.0329 BTC (.786 Fib).
On the other side, the first resistance lies at 0.038 BTC. This is followed by 0.0396 BTC (Feb 2019 High), 0.0405 BTC (2020 High), and 0.0416 BTC (2019 High).
The RSI has also plummeted beneath the 50 level, indicating the bears are in control of the market momentum right now. There is some hope with the Stocahstic RSI already in oversold conditions, and it is primed for a bullish crossover signal.
PrimeXBT Special Offer: Use this link to register & enter CRYPTOPOTATO35 code to get 35% free bonus on any deposit up to 1 BTC.
Disclaimer: Information found on CryptoPotato is those of writers quoted. It does not represent the opinions of CryptoPotato on whether to buy, sell, or hold any investments. You are advised to conduct your own research before making any investment decisions. Use provided information at your own risk. See Disclaimer for more information.
Cryptocurrency charts by TradingView.