
– Identify future Ethereum price levels of importance.
– A collection of Gartley Patterns show a cluster of resistance levels ahead.
– How do you determine future resistance levels when those prices have never been traded?
One of the peculiar technical analysis methods is the projection of future price levels as support or resistance. What makes this method even odder is we sometimes the price levels we project are price levels that have never been traded. It’s one thing to use a price level that has been traded at least once; it’s another to find one that has never been traded. I did a video today regarding Ethereum’s future price levels utilizing Fibonacci expansions. I want to compliment that video with some further analysis using Gartley Patterns. Before we get into those patterns, know that we should probably call them ‘Carney Patterns’ because Scott Carney is the man responsible for discovering these patterns.
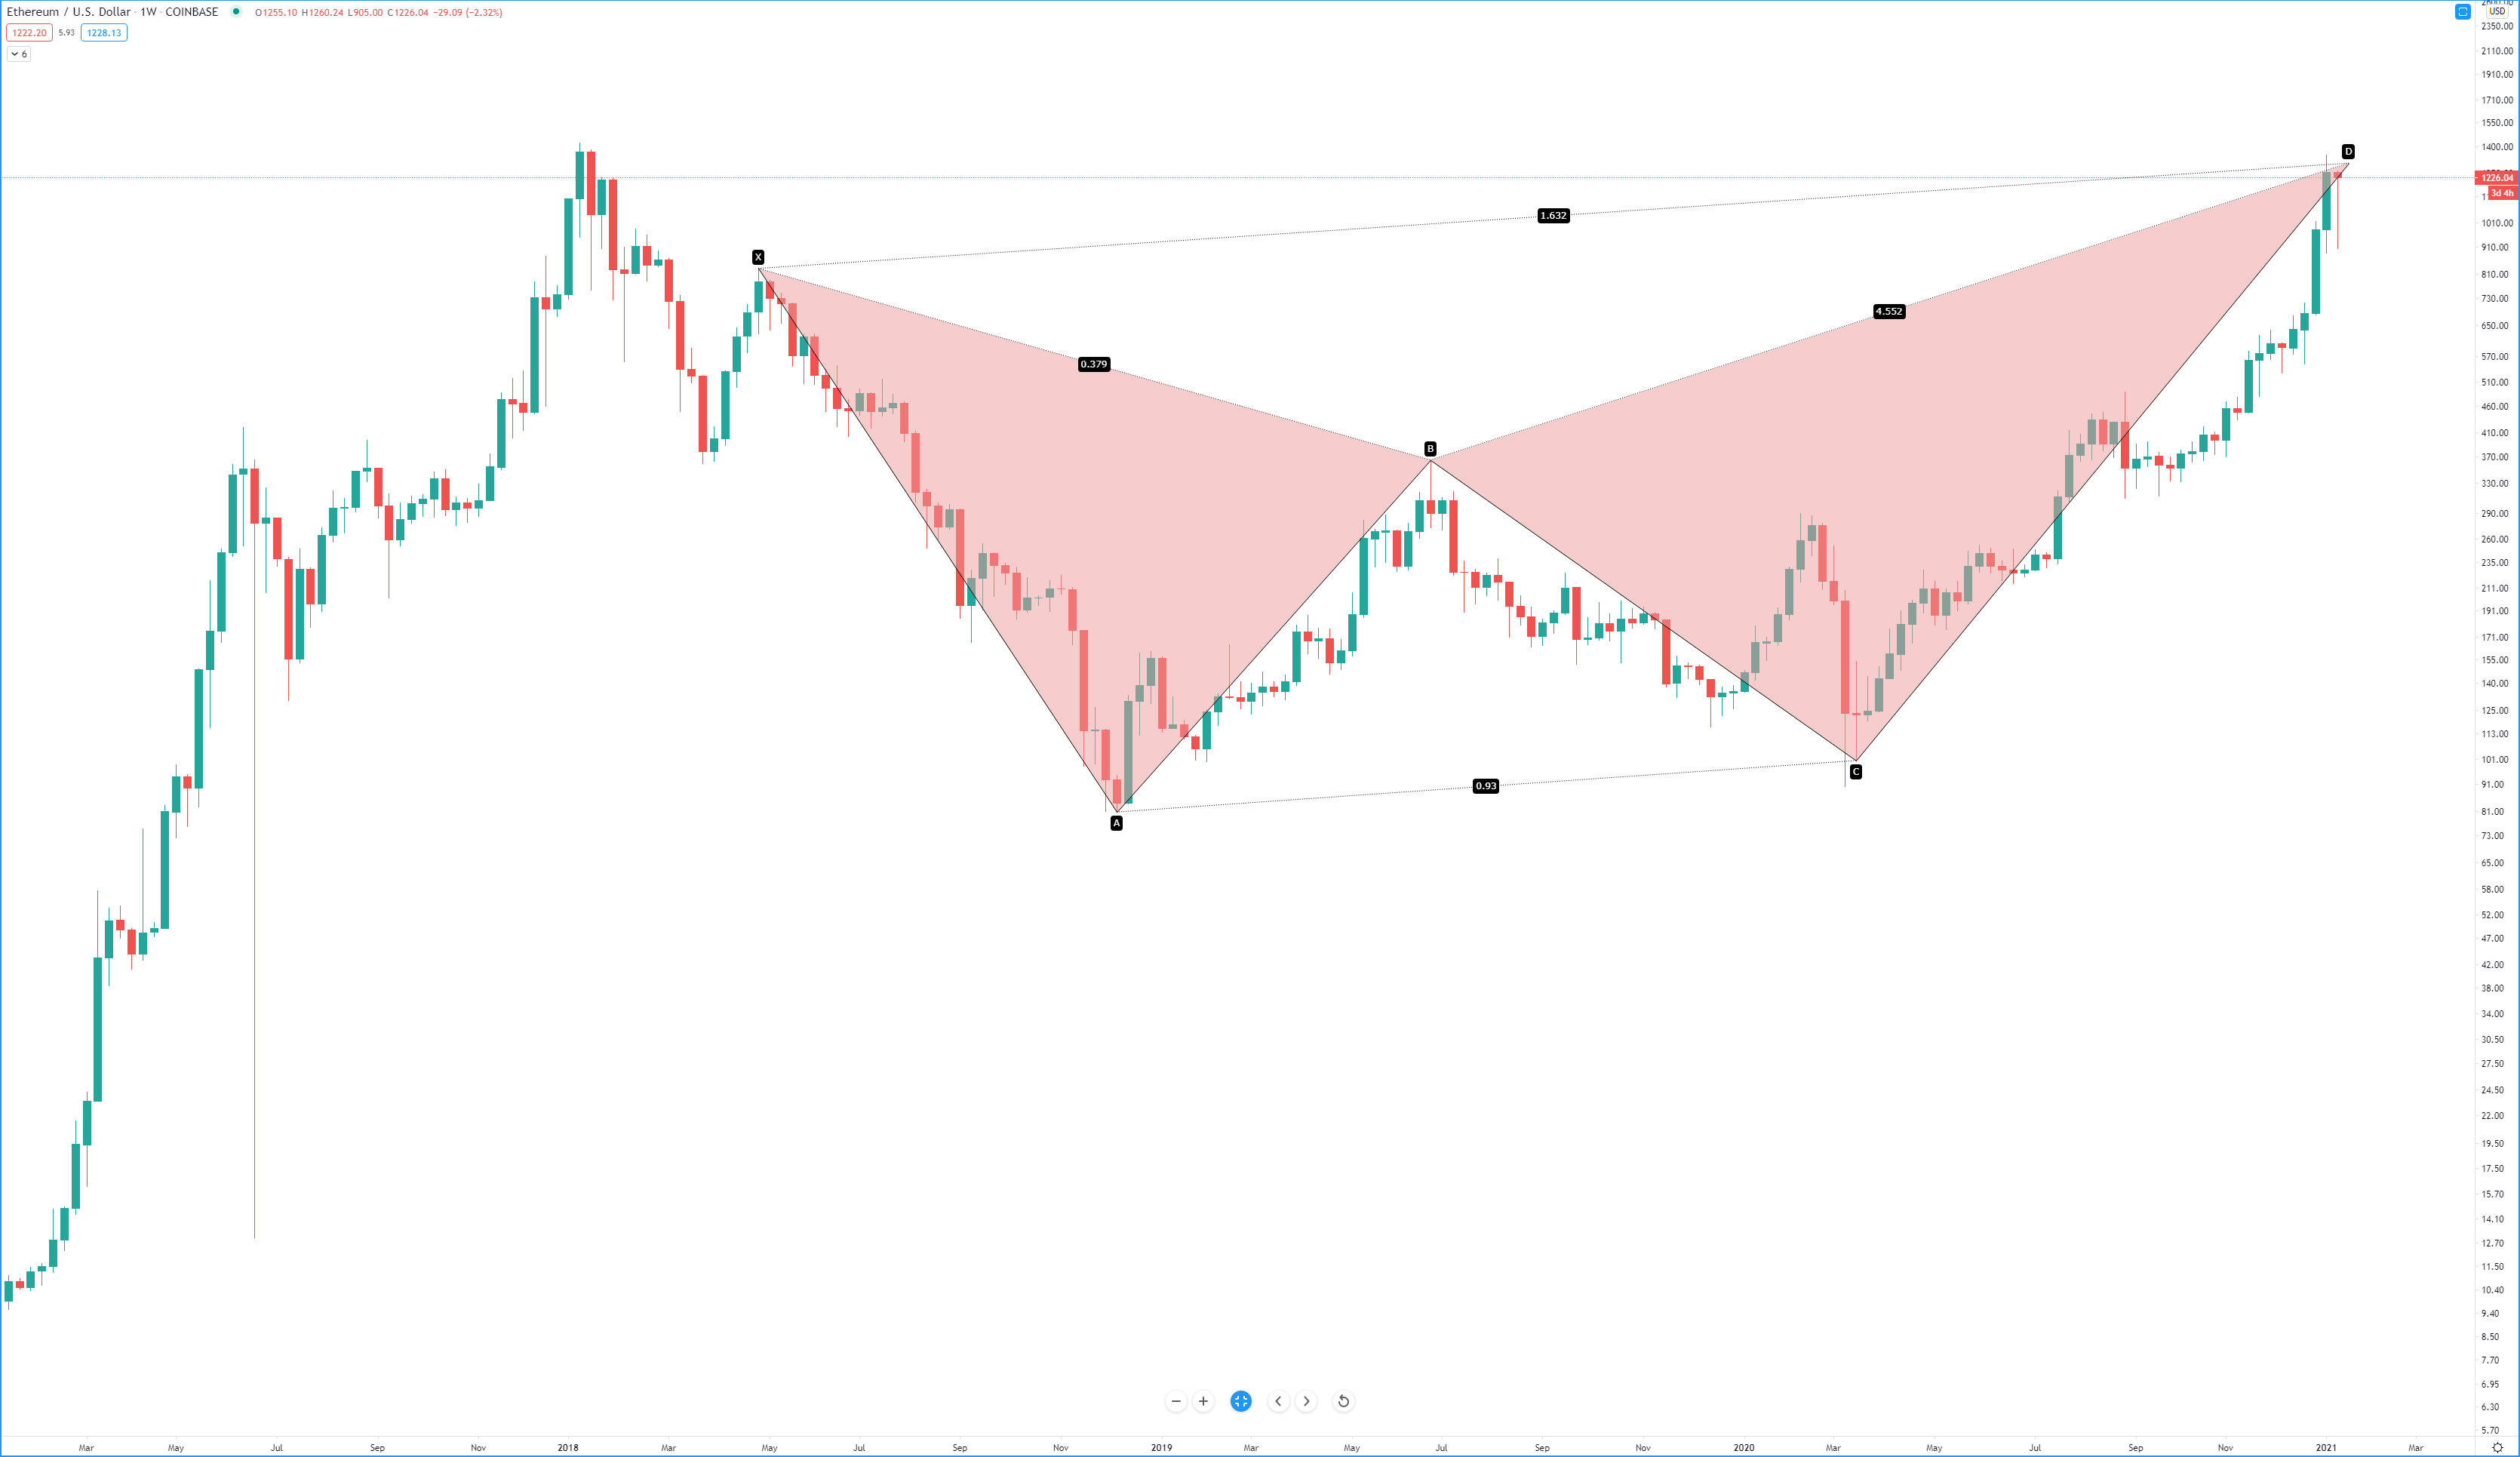
Bearish Shark
Above: Monthly Ethereum Chart – Bearish Shark Pattern
The first pattern we’re looking at is when the PRZ (Potential Reversal Zone) is the closest to the current traded price. The Bearish Shark pattern is exact and how we interpret it is one where reversals occur almost immediately. The price level of that PRZ is between 1299.19 and 1561.13. While this pattern is a strong one, I am not a huge proponent of this pattern on this chart. While the pattern is technically correct, the time horizon is too extended. Notice that points A, B, and C all occur within a similar range, but the distance between C and D (the PRZ) is substantial and more than double the entire distance between X (the beginning) and C. Nevertheless, the price level is valid.
Bearish Crab

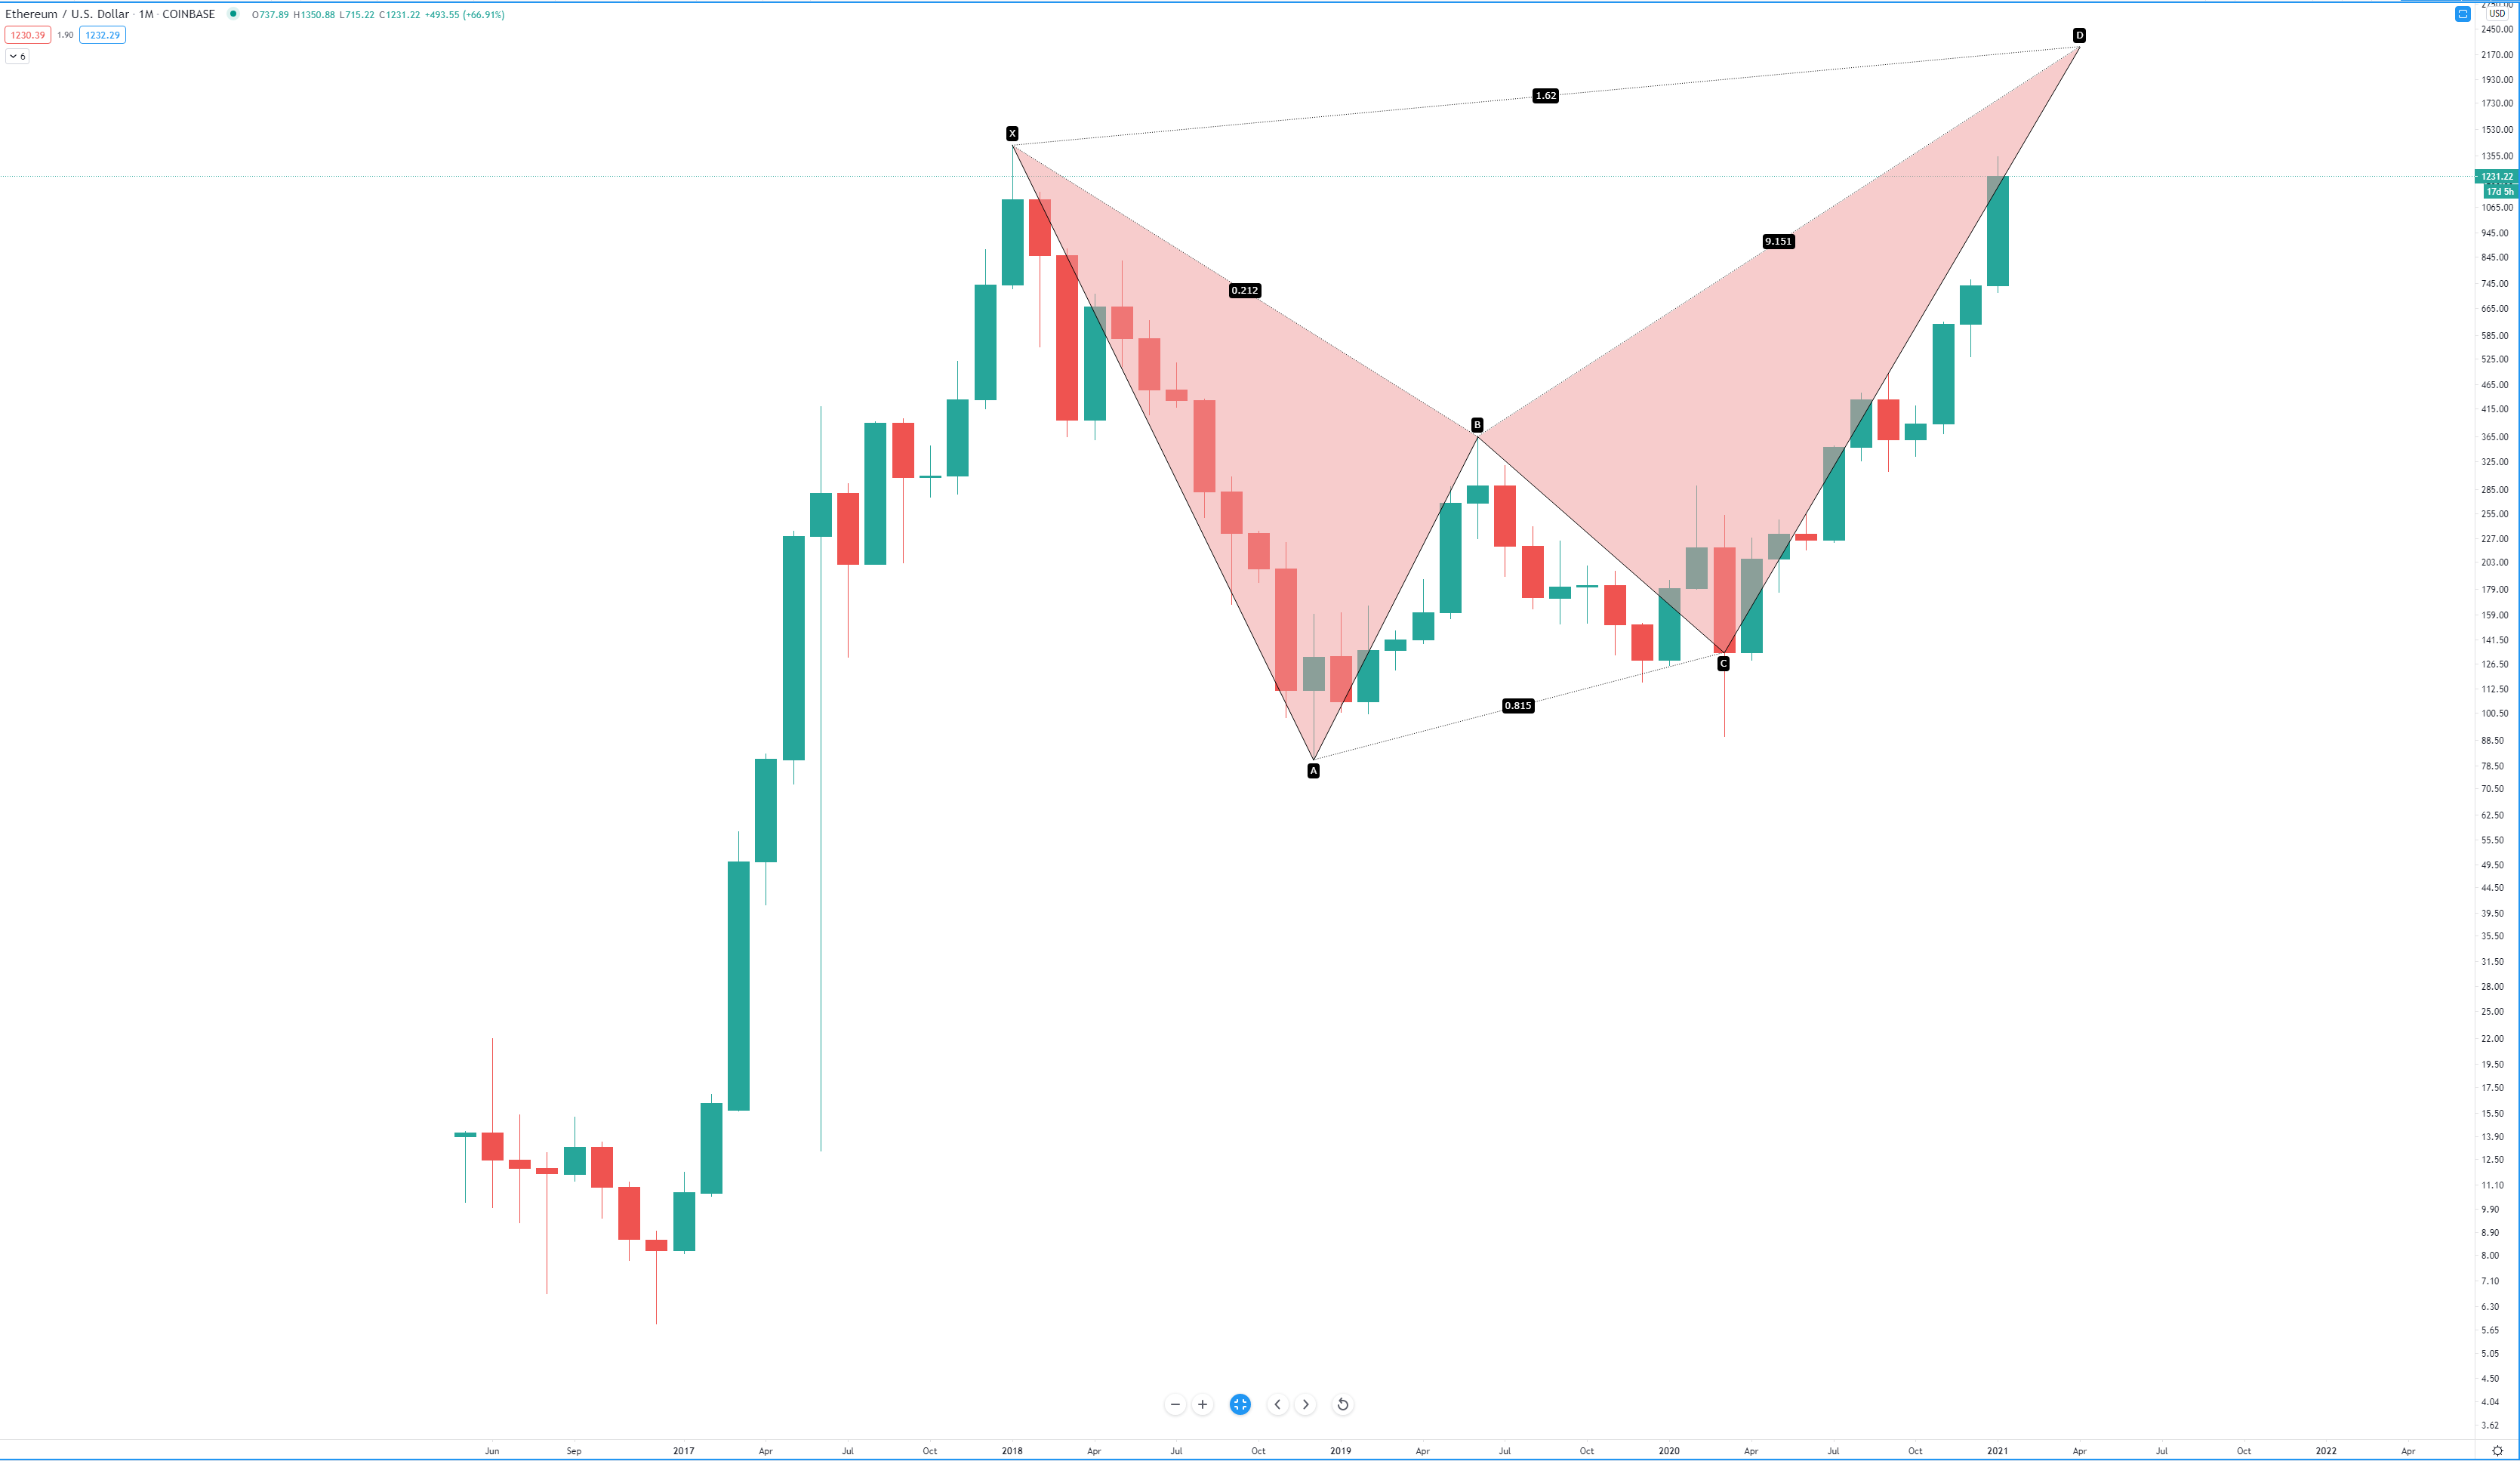
Above: Monthly Ethereum Chart – Bearish Crab Pattern
Of all the harmonic patterns that Carney has discovered, the Crab Pattern is my number one favorite pattern. Probably because I am an avid trader of wedge patterns, without getting into too many details about the Crab pattern, know that it defines two things: extreme moves and overdone moves. The PRZ for this pattern is up at 2250.70. That’s an 83% move from the present value area. Compared to the Bearish Shark above, the Bearish Crab’s pattern has a more evenly distributed range between each point.
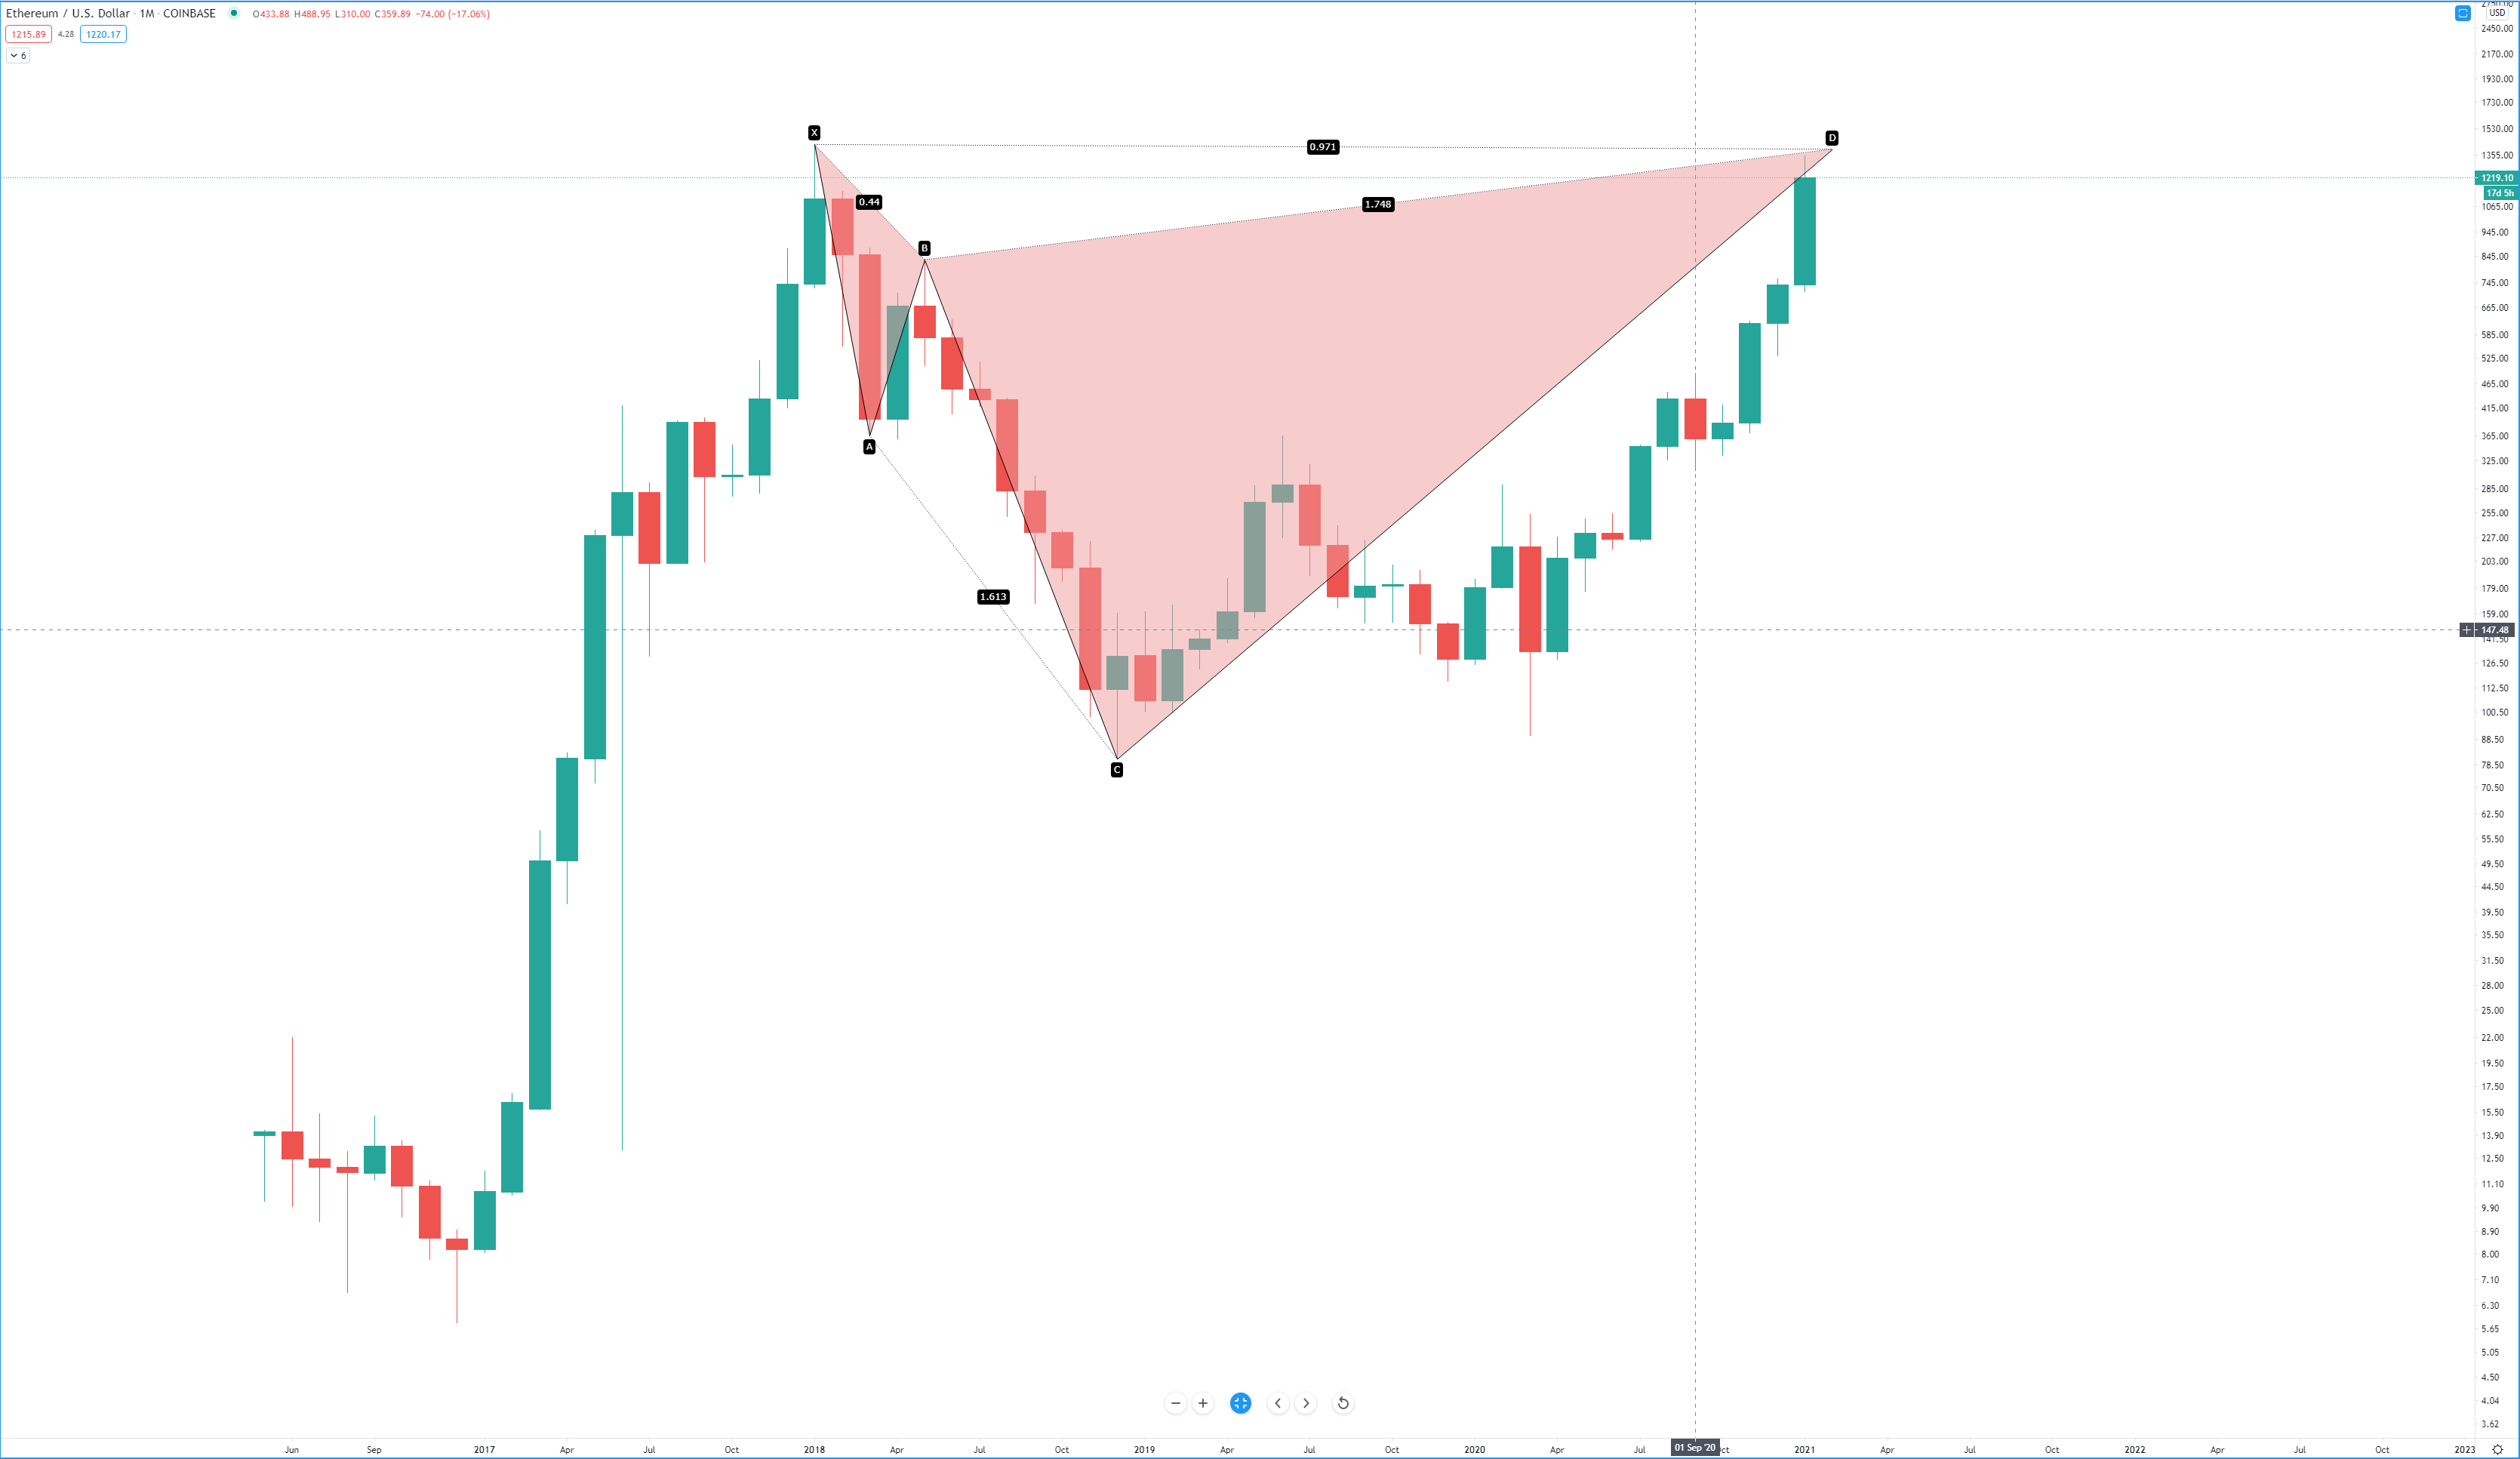
Bearish Bat
Above: Monthly Ethereum Chart – Bearish Bat Pattern
This pattern makes me the most apprehensive about any further upside potential in the short term for Ethereum – but it also would confirm the probability of higher highs if price doesn’t respond to this pattern. The Bat pattern, like the Shark, often experiences immediate and violent reversals. The PRZ for this Bat pattern is in the same zone as the Shark: 1229. It’s not surprising that we’ve seen Ethereum hang around this price level and face difficulty moving above it.
In summary, the short term outlook is very precarious given the existence of overlapping resistance levels. But be aware that when price fails to respond to PRZs, we often see a rapid continuation move. If the shared resistance level at 1299 fails to cause a corrective move in Ethereum, definitely look for an extended move to the PRZ in the Crab pattern at 2250.70.
See live ETH/USD exchange rate data, charts and historical cryptocurrency exchange rate comparisions.
Advertisement
Save money on your currency transfers with TorFX, voted International Money Transfer Provider of the Year 2016, 2017 and 2018. Their goal is to connect clients with ultra competitive exchange rates and a uniquely dedicated service whether they choose to trade online or over the telephone.
Find out more here.