
Litecoin – Litecoin Analysis: LTC price Encounters Powerful Resistance of $175, Will It Plunge?
- Litecoin(LTC) examines first major resistance of $175; plunges by -20%
- Litecoin(LTC) price is currently trading at $140 with an intraday gain of +3.59%
- The LTC/BTC pair is also performing well; it trades at 0.004261 BTC with a gain of +2.49%
Litecoin (LTC) experienced a bullish rally; however, it dropped nearly -25% after testing a high of $185. LTC has support levels at $100, while $65 can be considered a strong support level for the asset. Similarly, resistance on the higher side is placed at $175 and $220. Presently, Litecoin is trading above all the major Exponential Moving Averages (EMA) of 20,50 and 200-Day. It produced a Bullish momentum after a positive crossover of 20 and 50-EMA over 200-EMA. The raised volume supports the breakout in the first half of January 2021, which confirms the breakout.
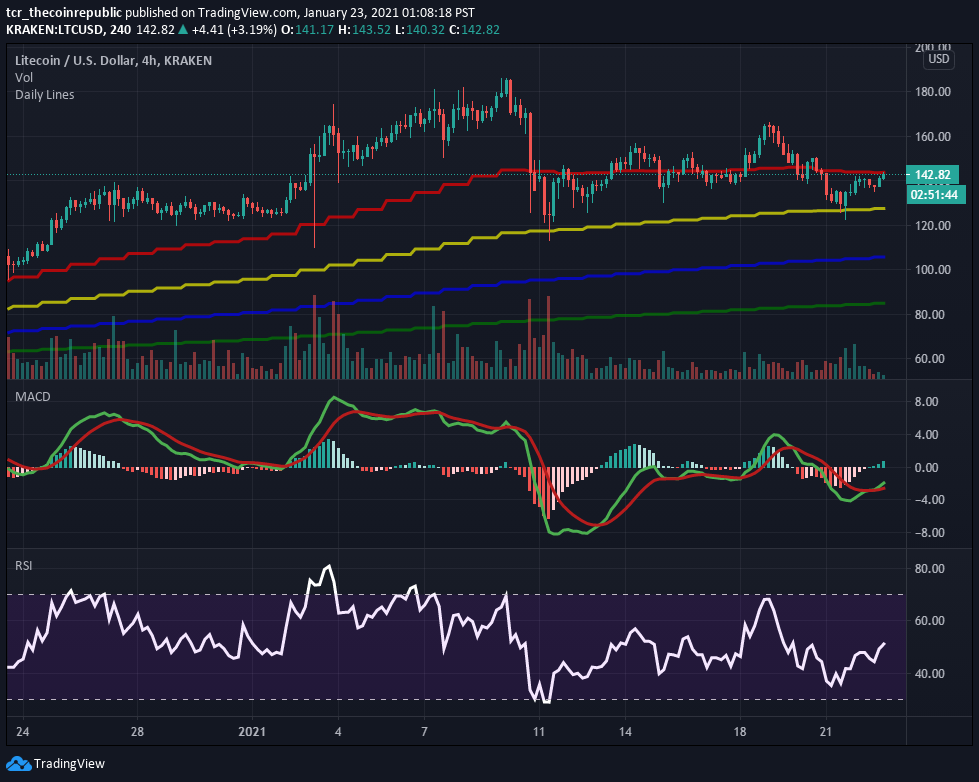
Litecoin daily chart (4-h) is trading flat after correction from higher levels and CMP at $140 with intraday gains of +3.59% in the last 24-hour time frame. The coin is placed under the Daily Moving Average(DMA) of 20-Day ($145). However, it successfully holds the levels of 50,100 and 200, which indicates that LTC may showcase positive momentum in the future. Volume of $7,303,425,625 recorded in the last 24-hour dropped over -28.21%, similarly the market capitalization standing at $7,303,425,625 which jumped over +3.16% in intraday. Support is placed at $125 for the short term; likewise, resistance can be considered at $165 and $185.
Relative Strength Index (Bullish) indicates a Bullish momentum while trading at 49.65. It is currently heading towards the overbought zone after recovering from lower levels.
Moving Average Convergence Divergence (Bullish) currently indicates a Bullish trend on the daily chart as it gives a positive crossover with the significance of buying signal line (green) over sellers line(red).
Support levels: $125
Resistance levels: $165 and $185
Get this news hand-delivered to you on Telegram. Join our Telegram for similar News and Information related to CRYPTOCURRENCY, BITCOIN, BLOCKCHAIN NEWS, and price prediction.