
ETH/USD – Ethereum Creates New ATH At $1480
Key Support Levels: $1392, $1350, $1300.
Key Resistance Levels: $1425, $1480, $1530.
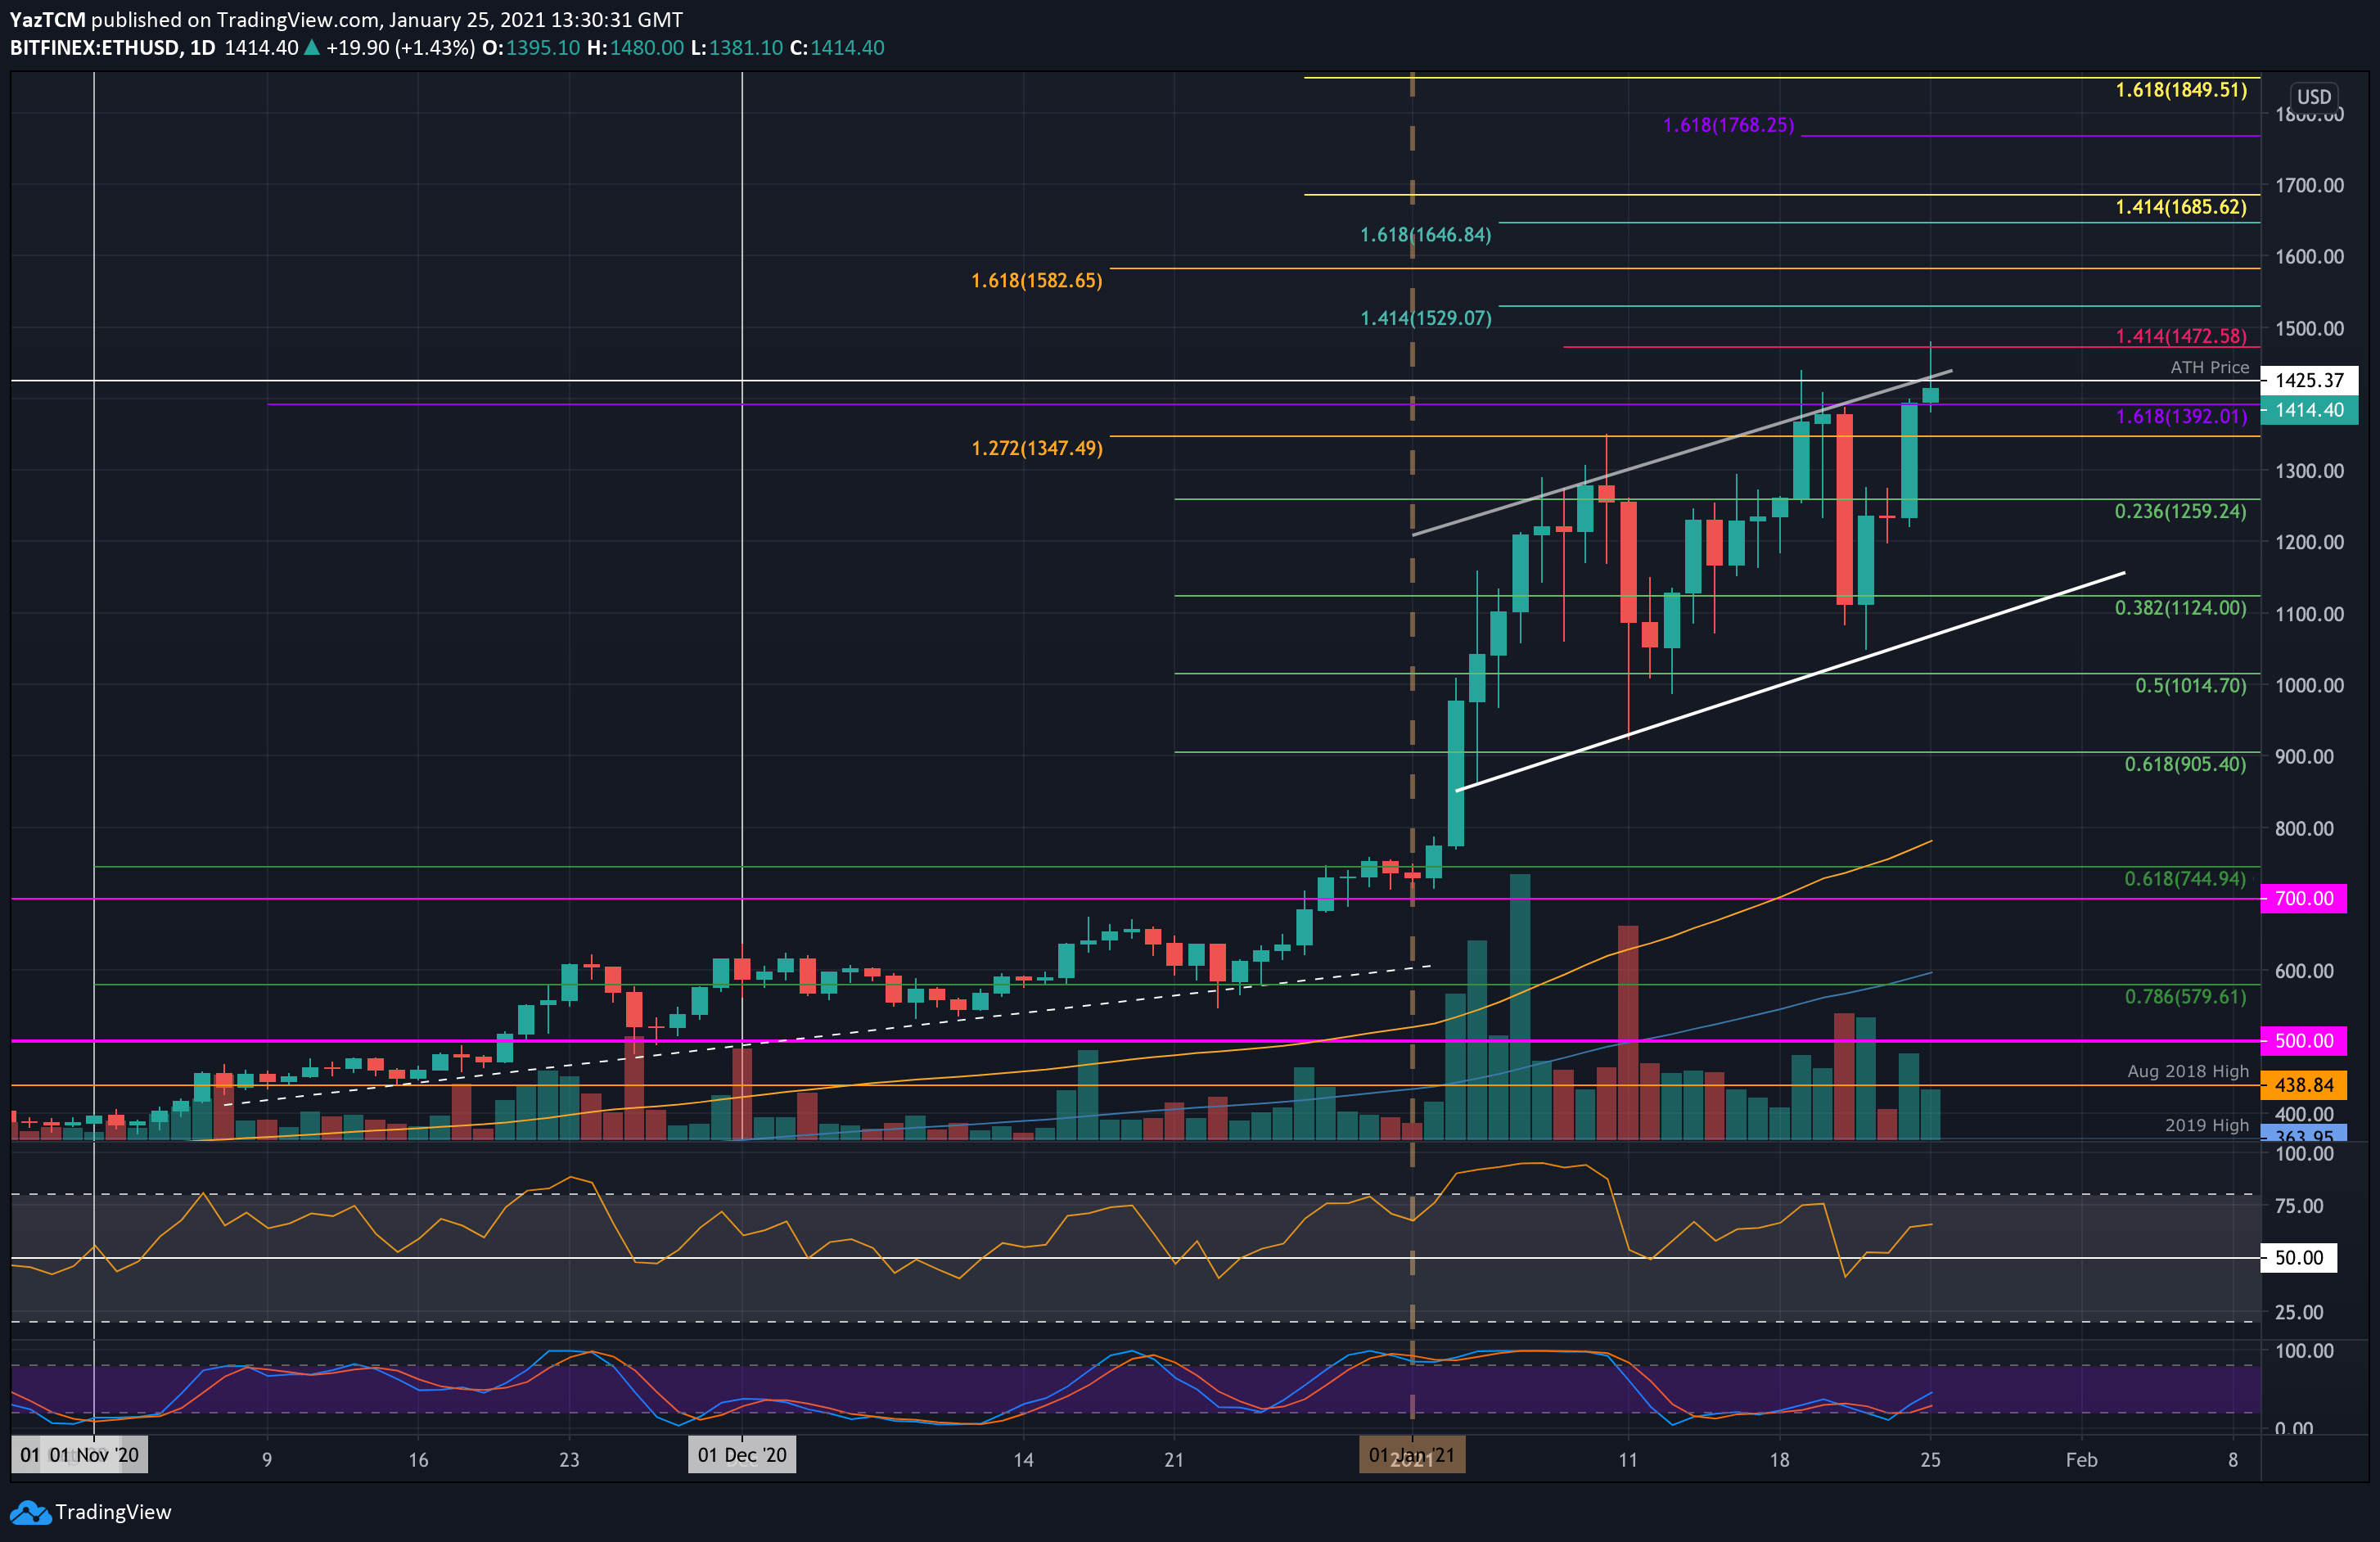
Ethereum saw a 6.5% price climb today as the coin trades near $1415. The coin had rebounded from $1100 on Friday as it started to surge over the weekend to close yesterday’s candle at $1392 (1.618 Fib Extension).
The cryptocurrency is trading within a broad rising price channel and is contesting the upper boundary today.
ETH had spiked higher earlier in the day to break this channel and set a new ATH price at $1480. It has since rolled over to return beneath the previous ATH price at $1425.
ETH-USD Short Term Price Prediction
Looking ahead, the first level of resistance lies at $1425. The new ATH follows this at $1480, then $1530 (1.414 Fib Extension), and $1582. Beyond $1600, added resistance lies at $1647, $1686 (1.414 Fib Extension – yellow), $1700, and $1768 (1.618 Fib extension – purple).
On the other side, the first level of support lies at $1392. This is followed by $1350, $1300, $1260 (.236 Fib), $1200, and $1125 (.382 Fib).
The RSI is showing signs of bearish divergence as the price makes higher highs while the RSI makes lower highs. This could signal an incoming short-term reversal back to the lower boundary of the price channel.
ETH/BTC – Bulls Retreat From Today’s 0.045 BTC High
Key Support Levels: 0.0405 BTC, 0.0396 BTC, 0.0390 BTC.
Key Resistance Levels: 0.0416 BTC, 0.0424 BTC, 0.0435 BTC.
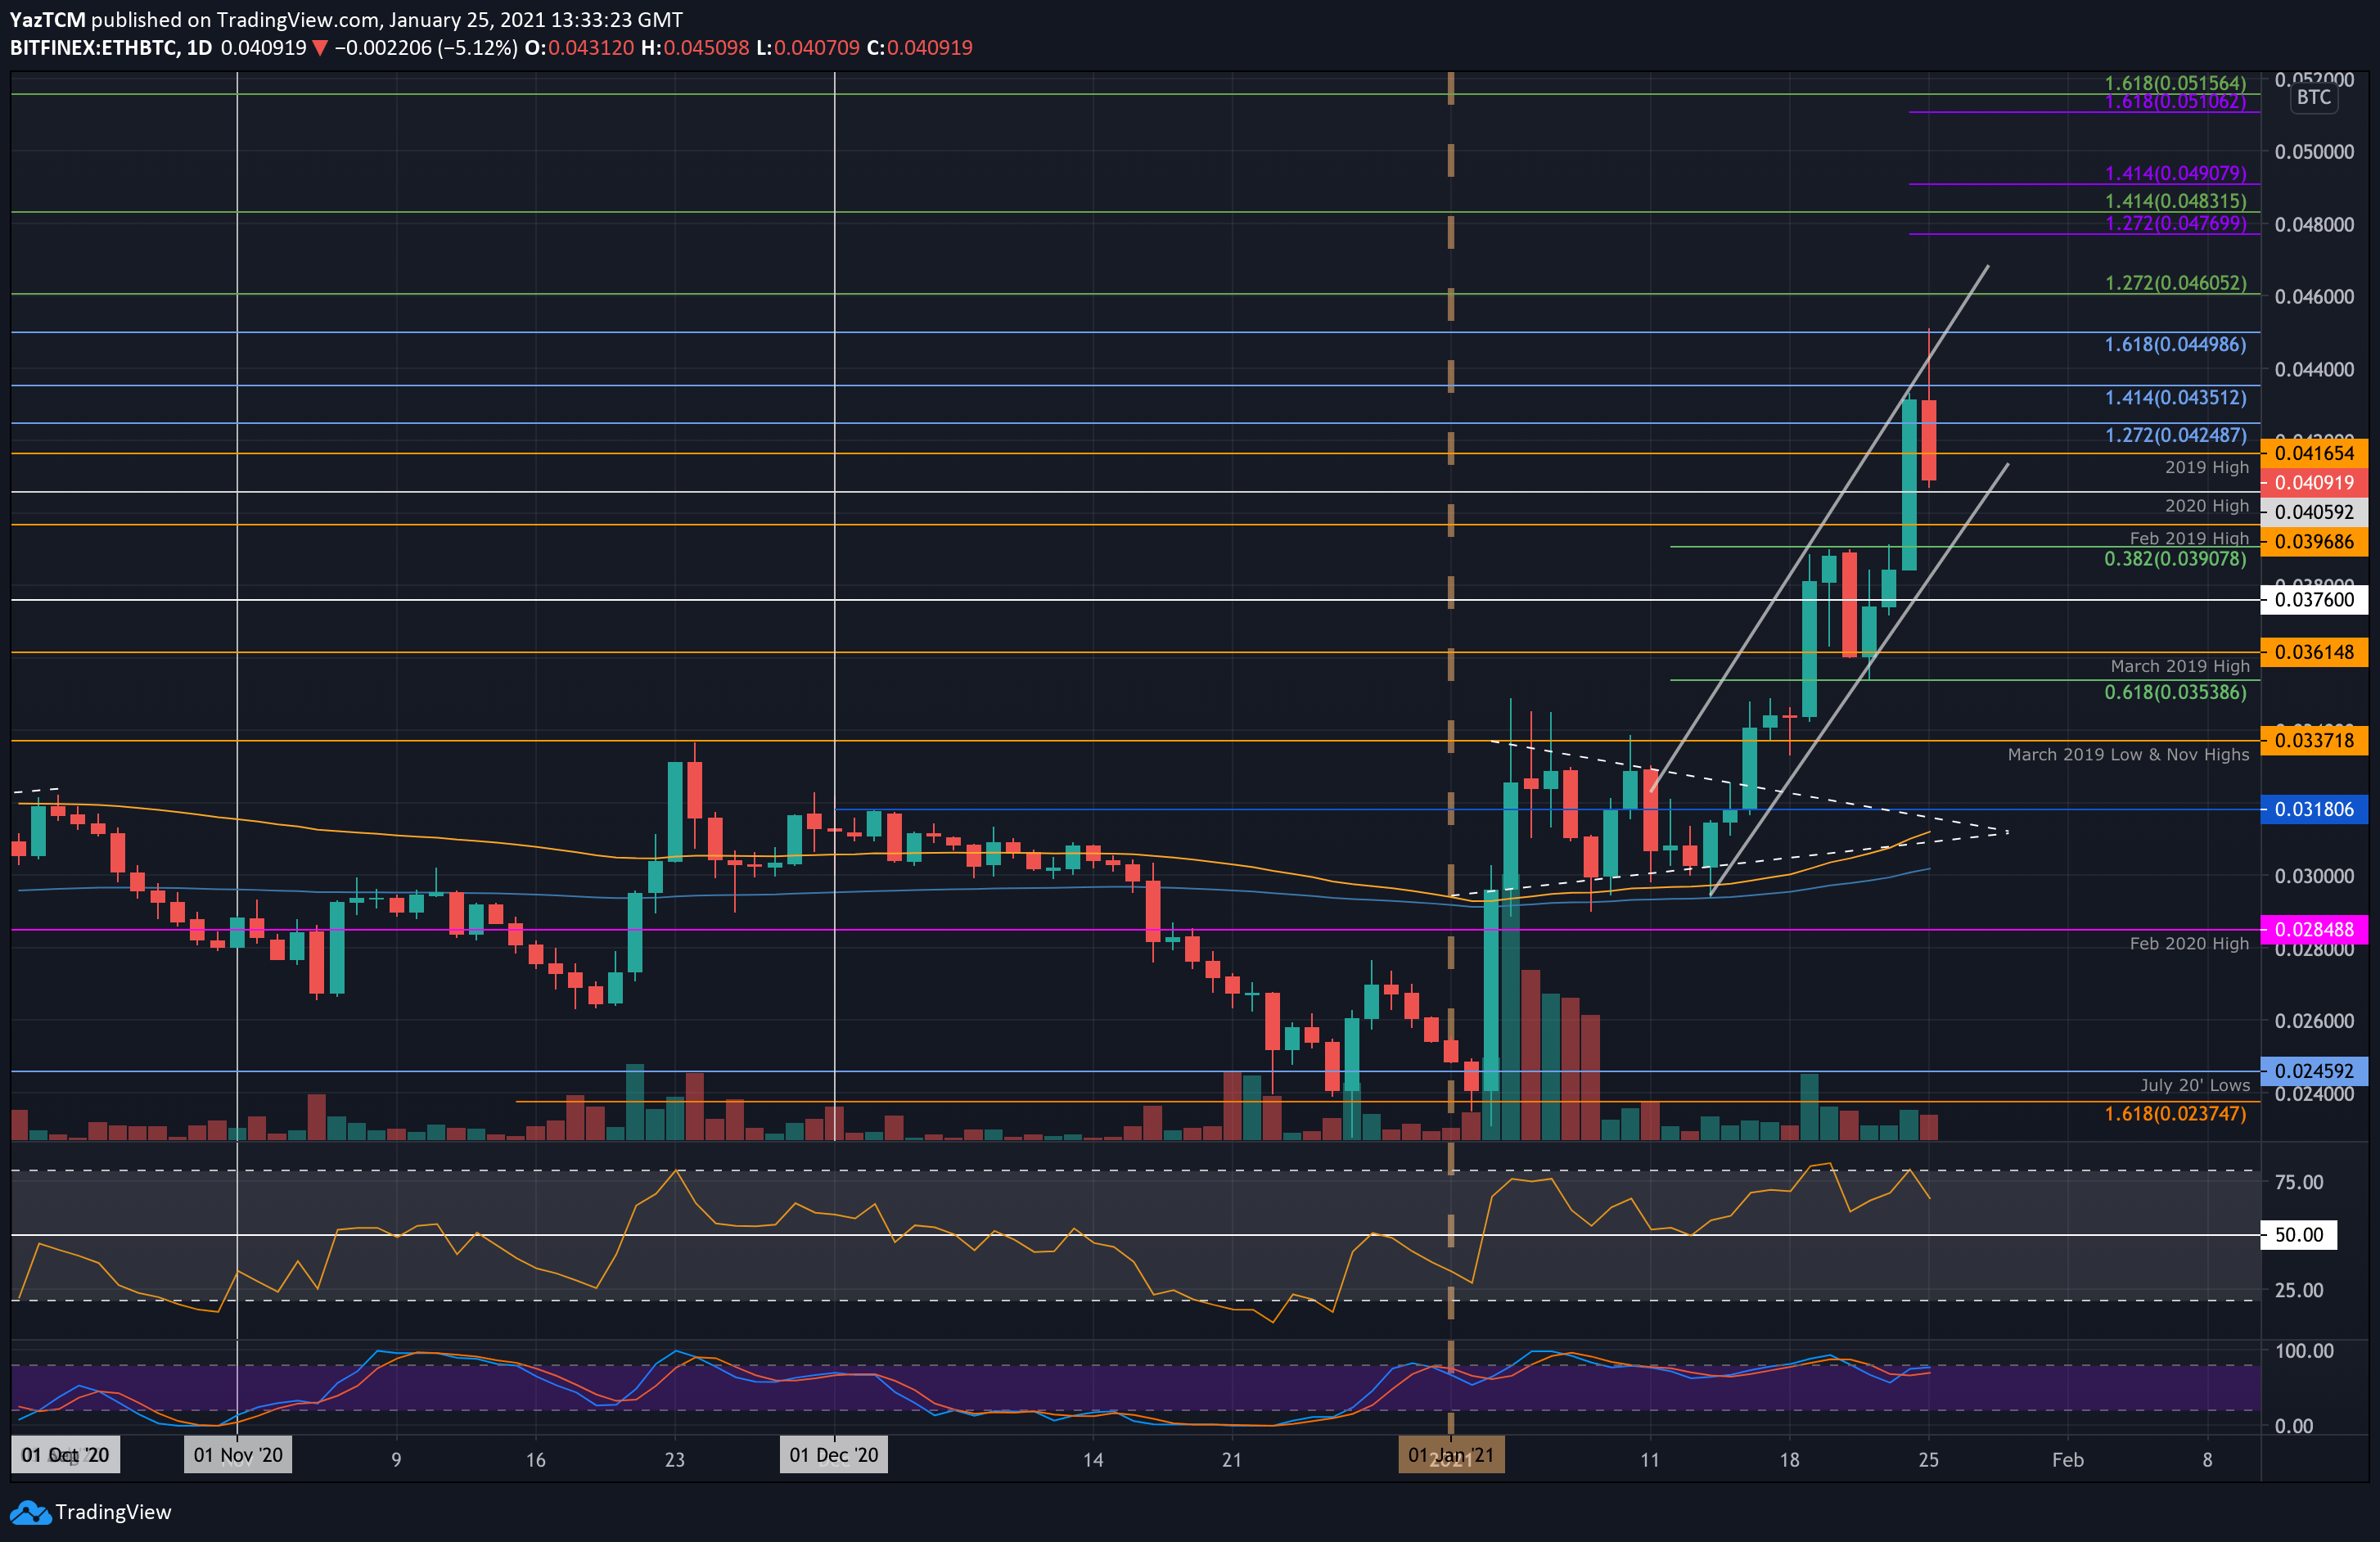
Against Bitcoin, ETH exploded from 0.038 BTC yesterday to reach as high as 0.0435 BTC by the end of the day. The coin is now trading within a steep rising price channel.
Earlier in the day, it attempted to spike above this channel as it reached as high as 0.045 BTC (1.618 Fib Extension) but has since rolled over to trade at the current 0.0409 BTC level.
ETH-BTC Short Term Price Prediction
Looking ahead, the first level of support lies at 0.0405 BTC (2020 Highs). This is followed by 0.0396 BTC (Feb 2019 Highs) and 0.0390 BTC (.382 Fib & lower boundary of the rising channel). Beneath the channel, support lies at 0.038 BTC, 0.0376 BTC, and 0.0361 BTC (MArch 2019 Highs).
On the other side, the first level of resistance lies at 0.0416 BTC. This is followed by 0.0424 BTC (1.272 Fib Extension), 0.0435 BTC (1.414 Fib Extension), 0.044 BTC, and 0.045 BTC (1.618 Fib Extension).
Additional resistance lies at 0.046 BTC, 0.0476 BTC, and 0.0482 BTC.
Likewise, the RSI here shows signs of bearish divergence, which could suggest a sharp reversal is on the way.
PrimeXBT Special Offer: Use this link to register & enter CRYPTOPOTATO35 code to get 35% free bonus on any deposit up to 1 BTC.
Disclaimer: Information found on CryptoPotato is those of writers quoted. It does not represent the opinions of CryptoPotato on whether to buy, sell, or hold any investments. You are advised to conduct your own research before making any investment decisions. Use provided information at your own risk. See Disclaimer for more information.
Cryptocurrency charts by TradingView.