
ETH/USD – Ethereum Retreats From Yesterday’s ATH
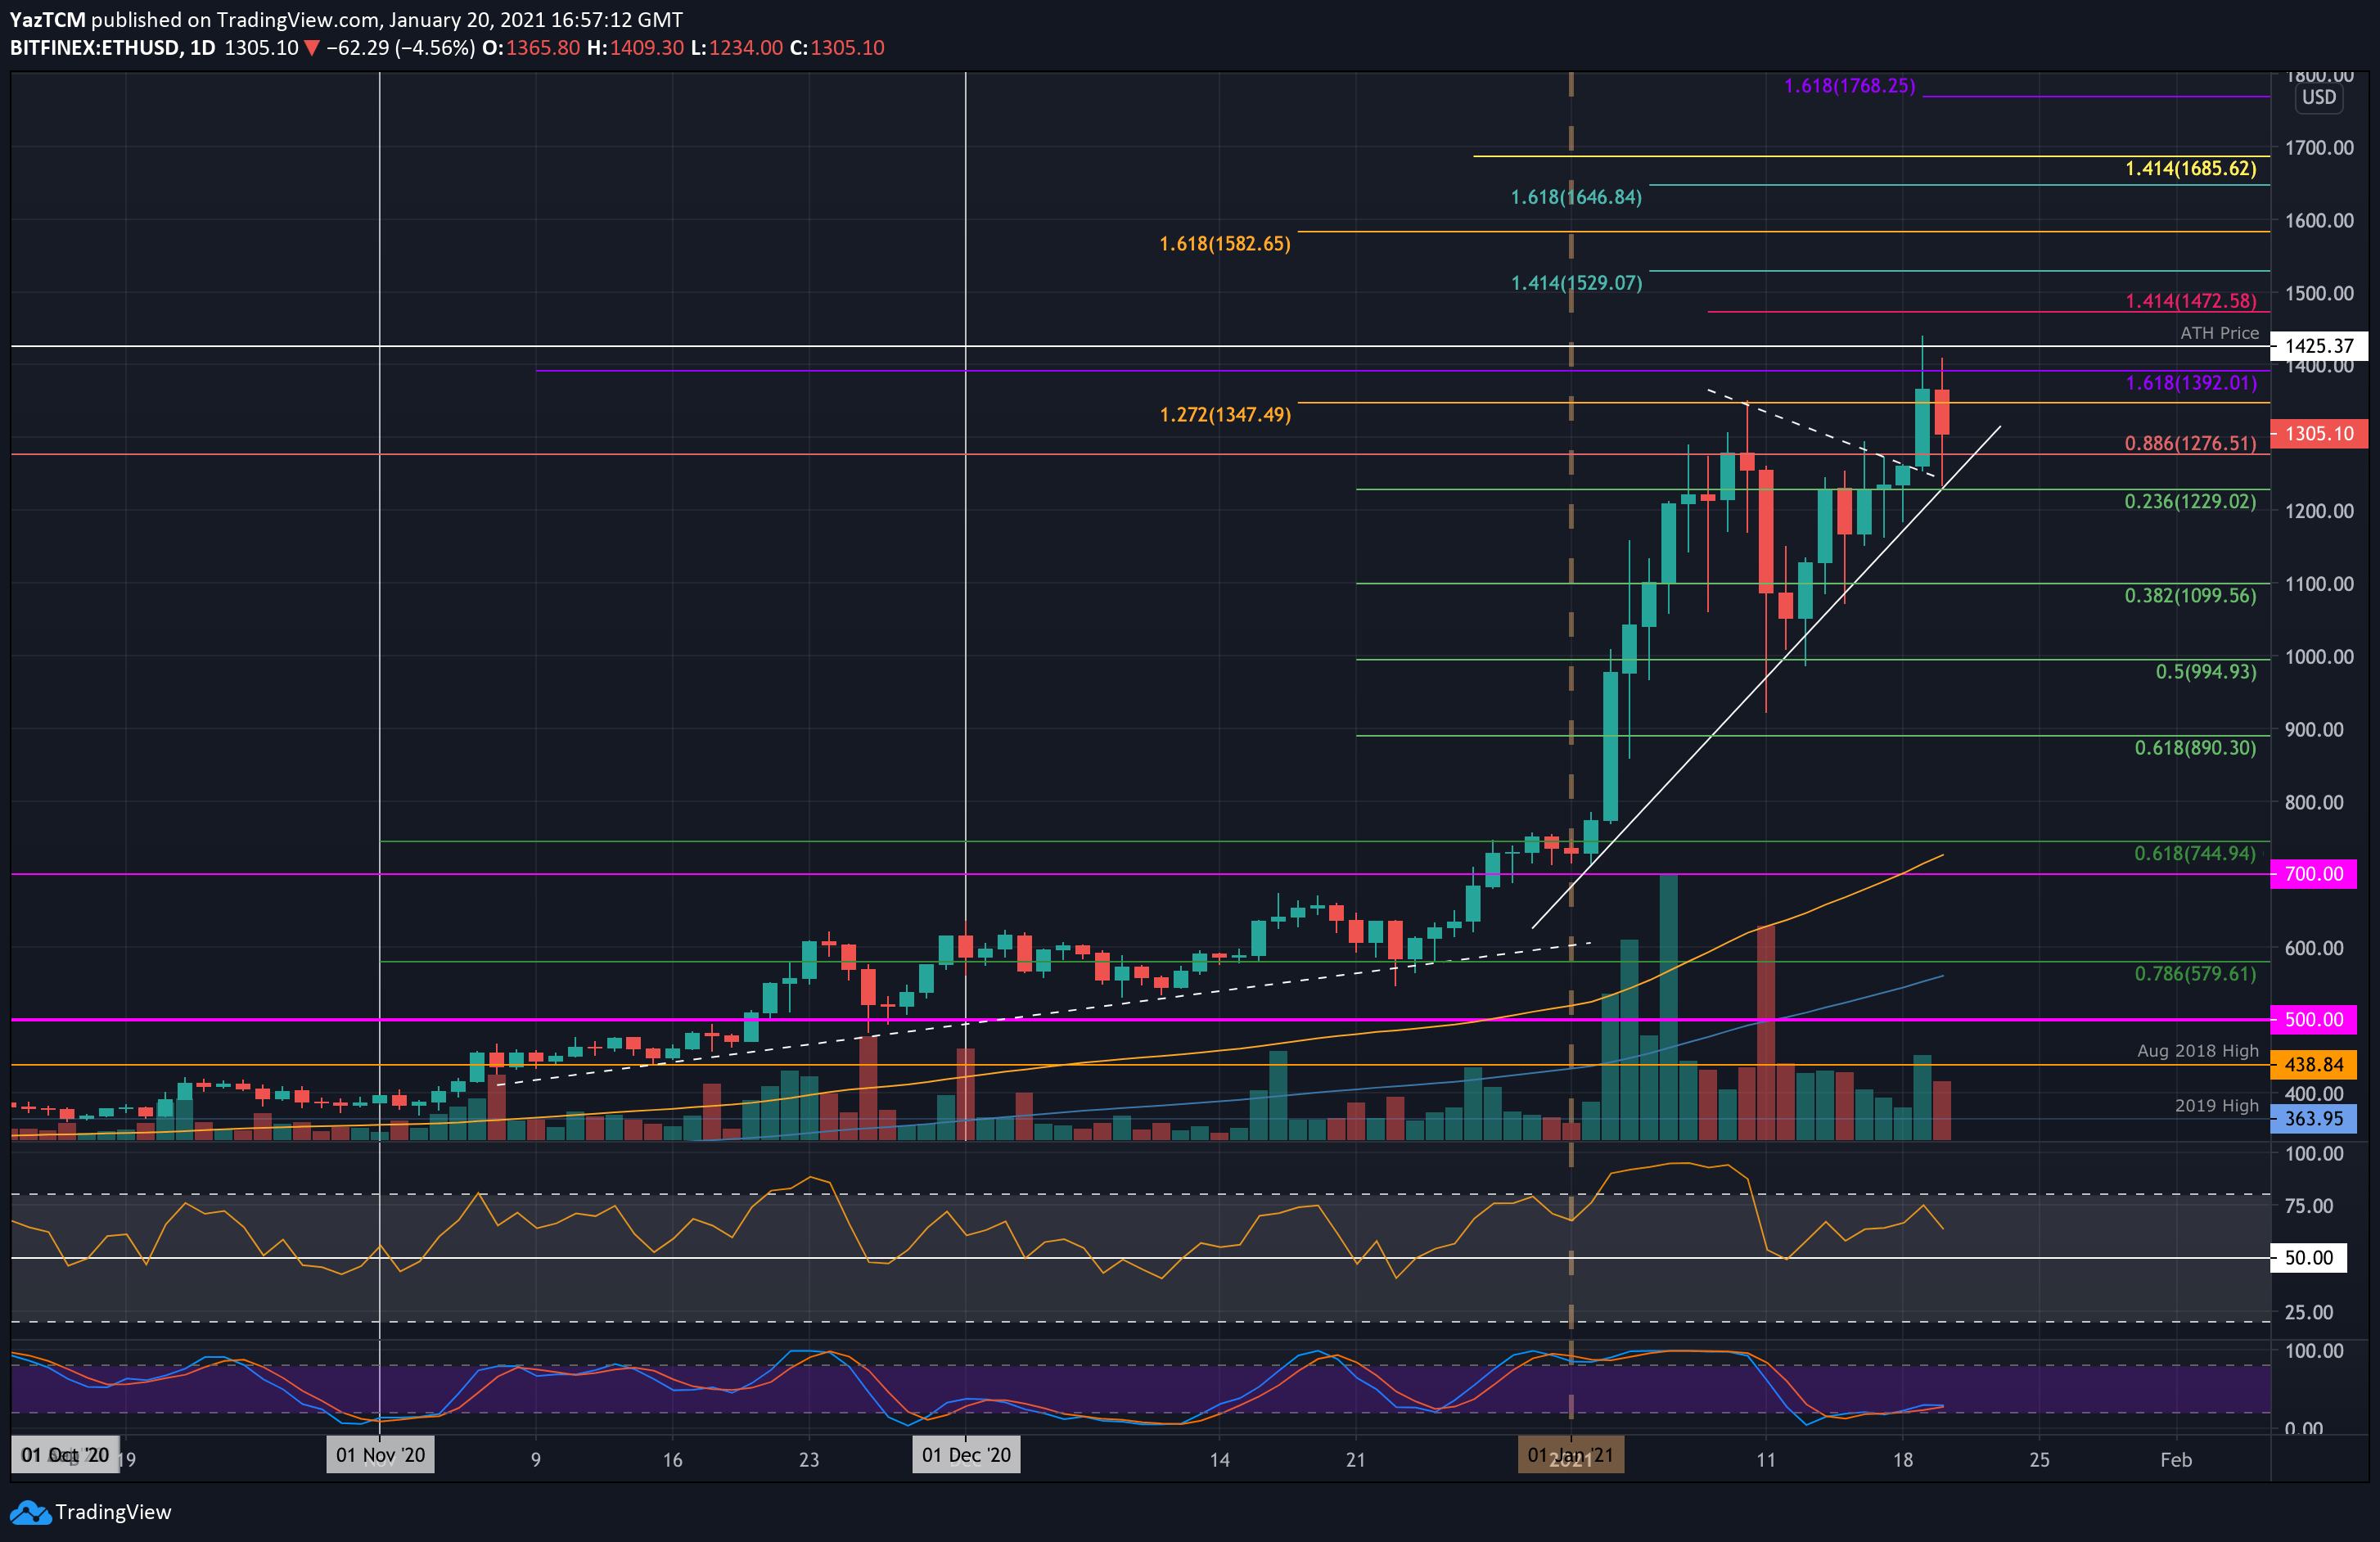
Key Support Levels: $1275, $1230, $1200.
Key Resistance Levels: $1350, $1400, $1424.
Yesterday, ETH surged by a strong 12%, which allowed it to climb above a consolidation pattern and hit the previous ATH price. It even set a new ATH marginally higher, around $1439, before coming back down to close the day at about $1380.
Today, Ethereum retreated and dropped by 8%. This was largely caused by a sharp drop in the price of Bitcoin, which also fell by around 8%.
The Bitcoin-driven price drop caused ETH to spike as low as $1230, where it found combined support at a rising trend line and the .236 Fib Retracement level. It has since rebounded and attempts to break back above $1300.
ETH-USD Short Term Price Prediction
Looking ahead, the first level of resistance above $1300 lies at $1350 (1.272 Fib Extension). This is followed by resistance at $1400, $1424 (previous ATH), and $1472 (1.414 Fib Extension). Added resistance lies at $1500, $1530, and $1582.
On the other side, the first level of support lies at $1276. This is followed by $1230 (.236 Fib & rising trend line), $1200, $1100 (.382 Fib), and $995 (.5 Fib).
The RSI is showing signs of strong bearish divergence, which could lead to a large rollover if it plays out.
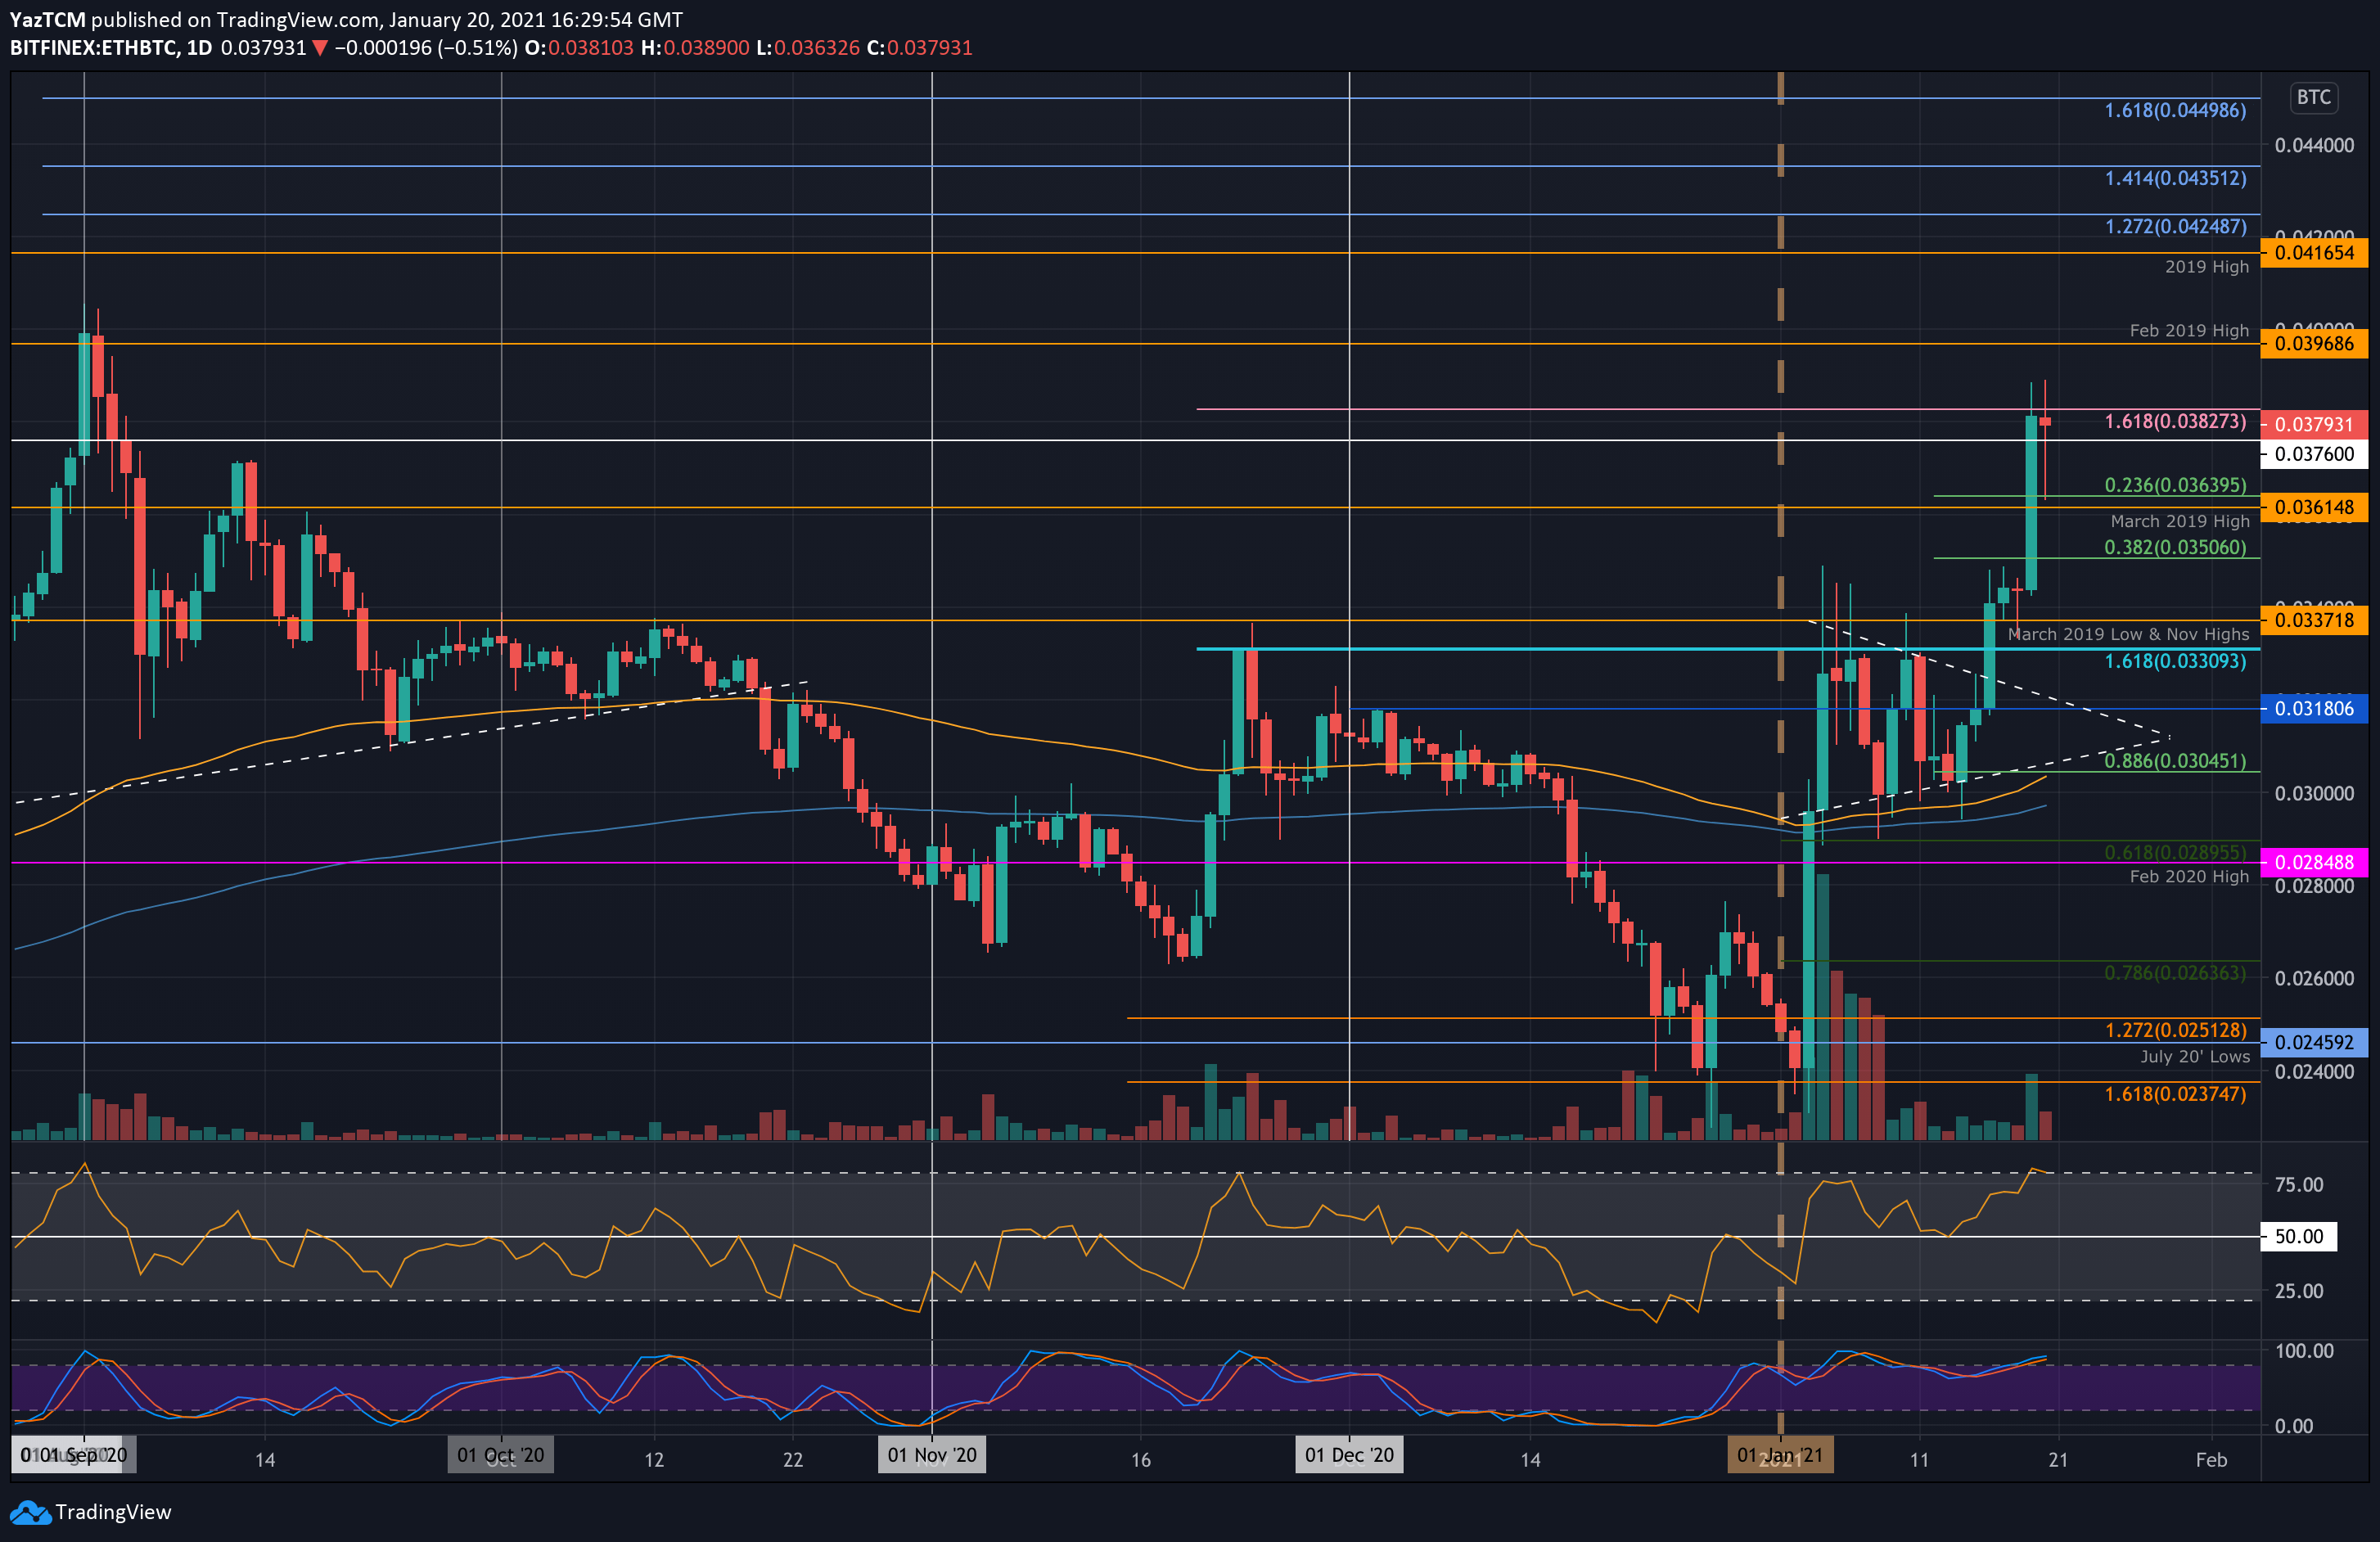
ETH/BTC – Bulls Holding At 4-Month Highs
Key Support Levels: 0.0363 BTC, 0.0361 BTC, 0.035 BTC.
Key Resistance Levels: 0.0382 BTC, 0.0396 BTC, 0.0416 BTC.
Against Bitcoin, Ethereum had surged higher from 0.034 BTC to reach the resistance at 0.0382 BTC yesterday. It stalled at this resistance, provided by a 1.618 Fib Extension, but is doing well to hold near the level at 0.0379 BTC.
The cryptocurrency had spiked lower against Bitcoin earlier today but managed to find support at 0.0363 BTC (.236 Fib) and rebounded from there.
ETH-BTC Short Term Price Prediction
Looking ahead, the first level of resistance lies at 0.0382 BTC. This is followed by resistance at 0.0396 BTC (Feb 2020 High), 0.0416 BTC, and 0.0424 BTC (1.272 Fib Extension).
On the other side, the first level of support lies at 0.0363 BTC (.236 Fib). This is closely followed by support at 0.0361 BTC (March 2019 highs), 0.035 BTC (.382 Fib), and 0.0337 BTC (Nov 2020 Highs).
The RSI has reached extremely overbought conditions here, suggesting the market might need a pullback before being able to continue higher.
PrimeXBT Special Offer: Use this link to register & enter CRYPTOPOTATO35 code to get 35% free bonus on any deposit up to 1 BTC.
Disclaimer: Information found on CryptoPotato is those of writers quoted. It does not represent the opinions of CryptoPotato on whether to buy, sell, or hold any investments. You are advised to conduct your own research before making any investment decisions. Use provided information at your own risk. See Disclaimer for more information.
Cryptocurrency charts by TradingView.