
Bitcoin (BTC/USD) and Ethereum (ETH/USD) Price, Analysis and Chart:
- Bitcoin (BTC) just misses trading at $36,000
- Ethereum building an impressive series of higher lows.
- FCA ban on cryptocurrency derivatives comes into force today.

Recommended by Nick Cawley
Get Your Free Introduction To Bitcoin Trading
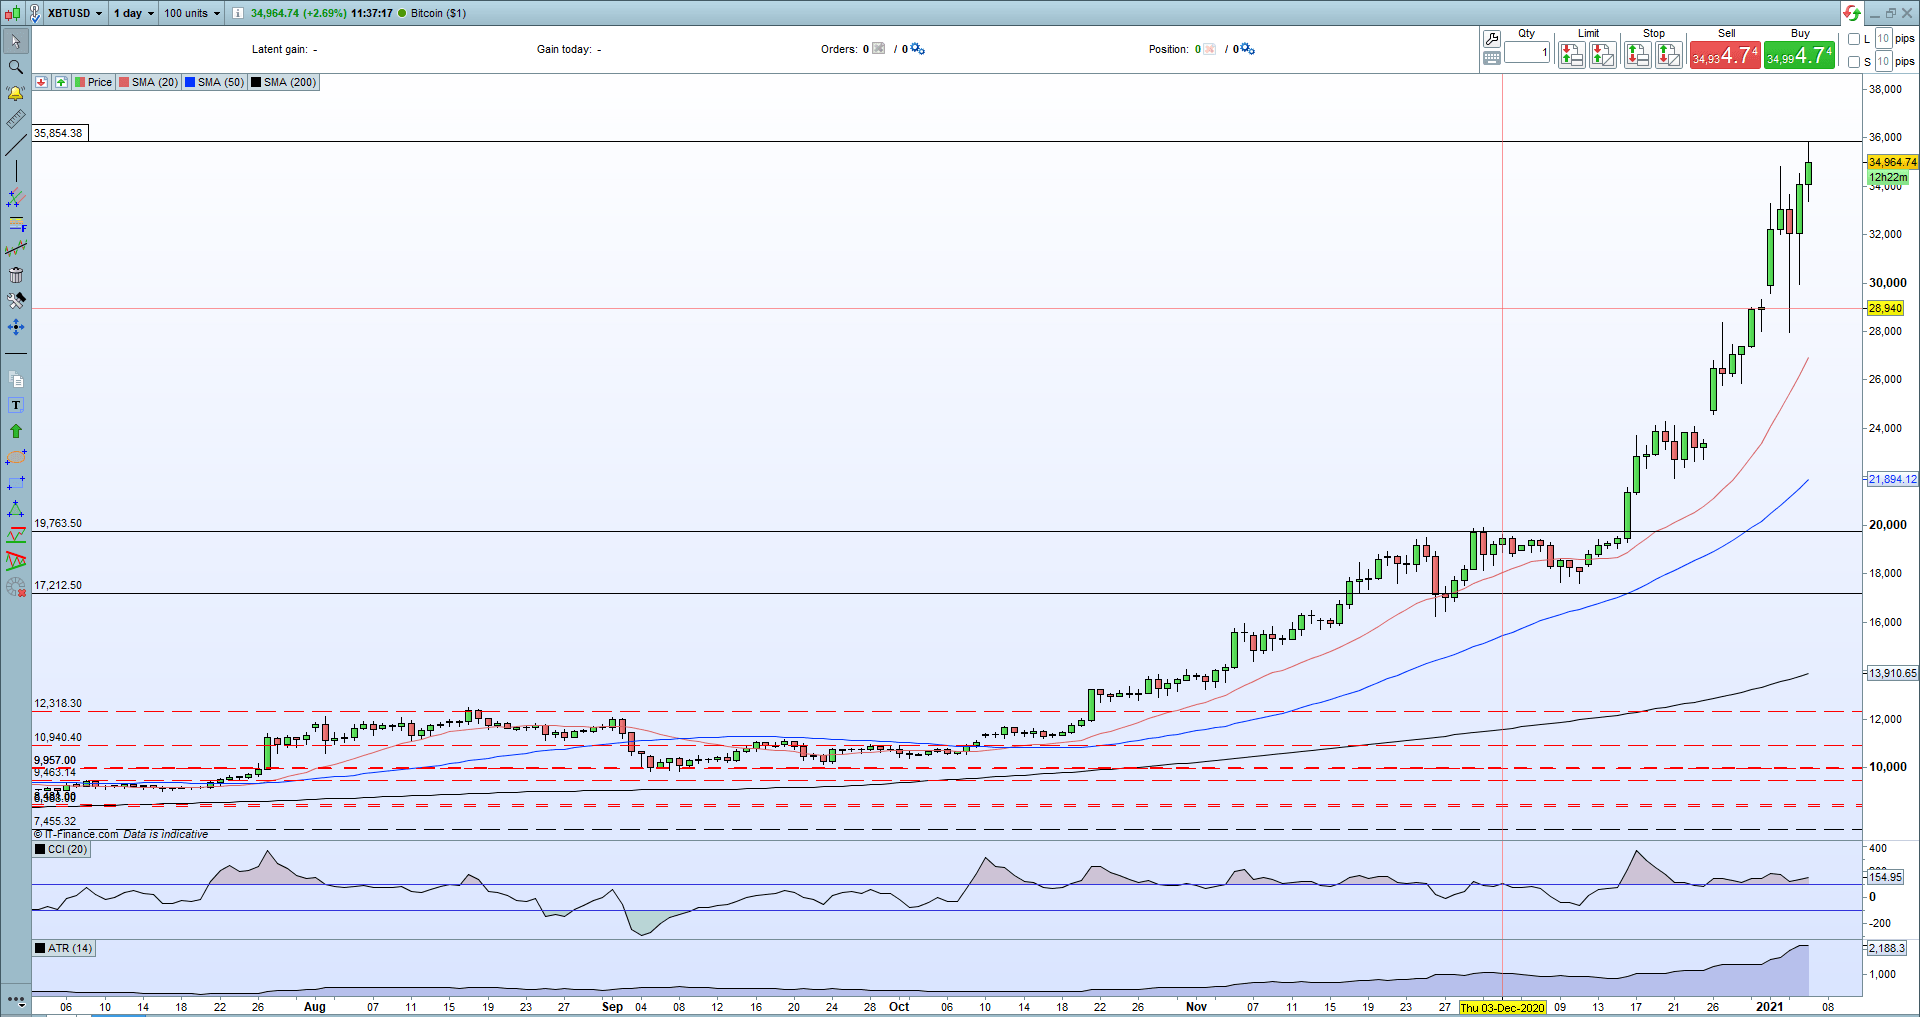
Bitcoin printed a fresh all-time high of $35,854 earlier in the session before slipping back below $35,000. Volume in the last 24 hours is just over $68 billion, according to data from CoinMarketCap, which also recorded a higher high of $36,361 as prices between different trading venues splinter. Market volatility, as measured by the ATR indicator, is now at its highest level on record, with a current reading of just under $2,200 on a 14-day basis. With buying interest continuing to drive the market, any sell-offs of set-backs will be seen as another opportunity to enter a market that, at the moment, is pushing relentlessly higher. As always with the crypto space, care should be taken, especially with volatility at its current extreme level.
Bitcoin (BTC/USD) Daily Price Chart (June – January 6, 2021)

Recommended by Nick Cawley
Improve your trading with IG Client Sentiment Data
Retail trader data show 75.72% of traders are net-long with the ratio of traders long to short at 3.12 to 1. We typically take a contrarian view to crowd sentiment, and the fact traders are net-long suggests Bitcoin prices may continue to fall.Positioning is less net-long than yesterday but more net-long from last week. The combination of current sentiment and recent changes gives us a further mixed Bitcoin trading bias.
Traders of all levels and abilities will find something to help them make more informed decisions in the new and improved DailyFX Trading Education Centre
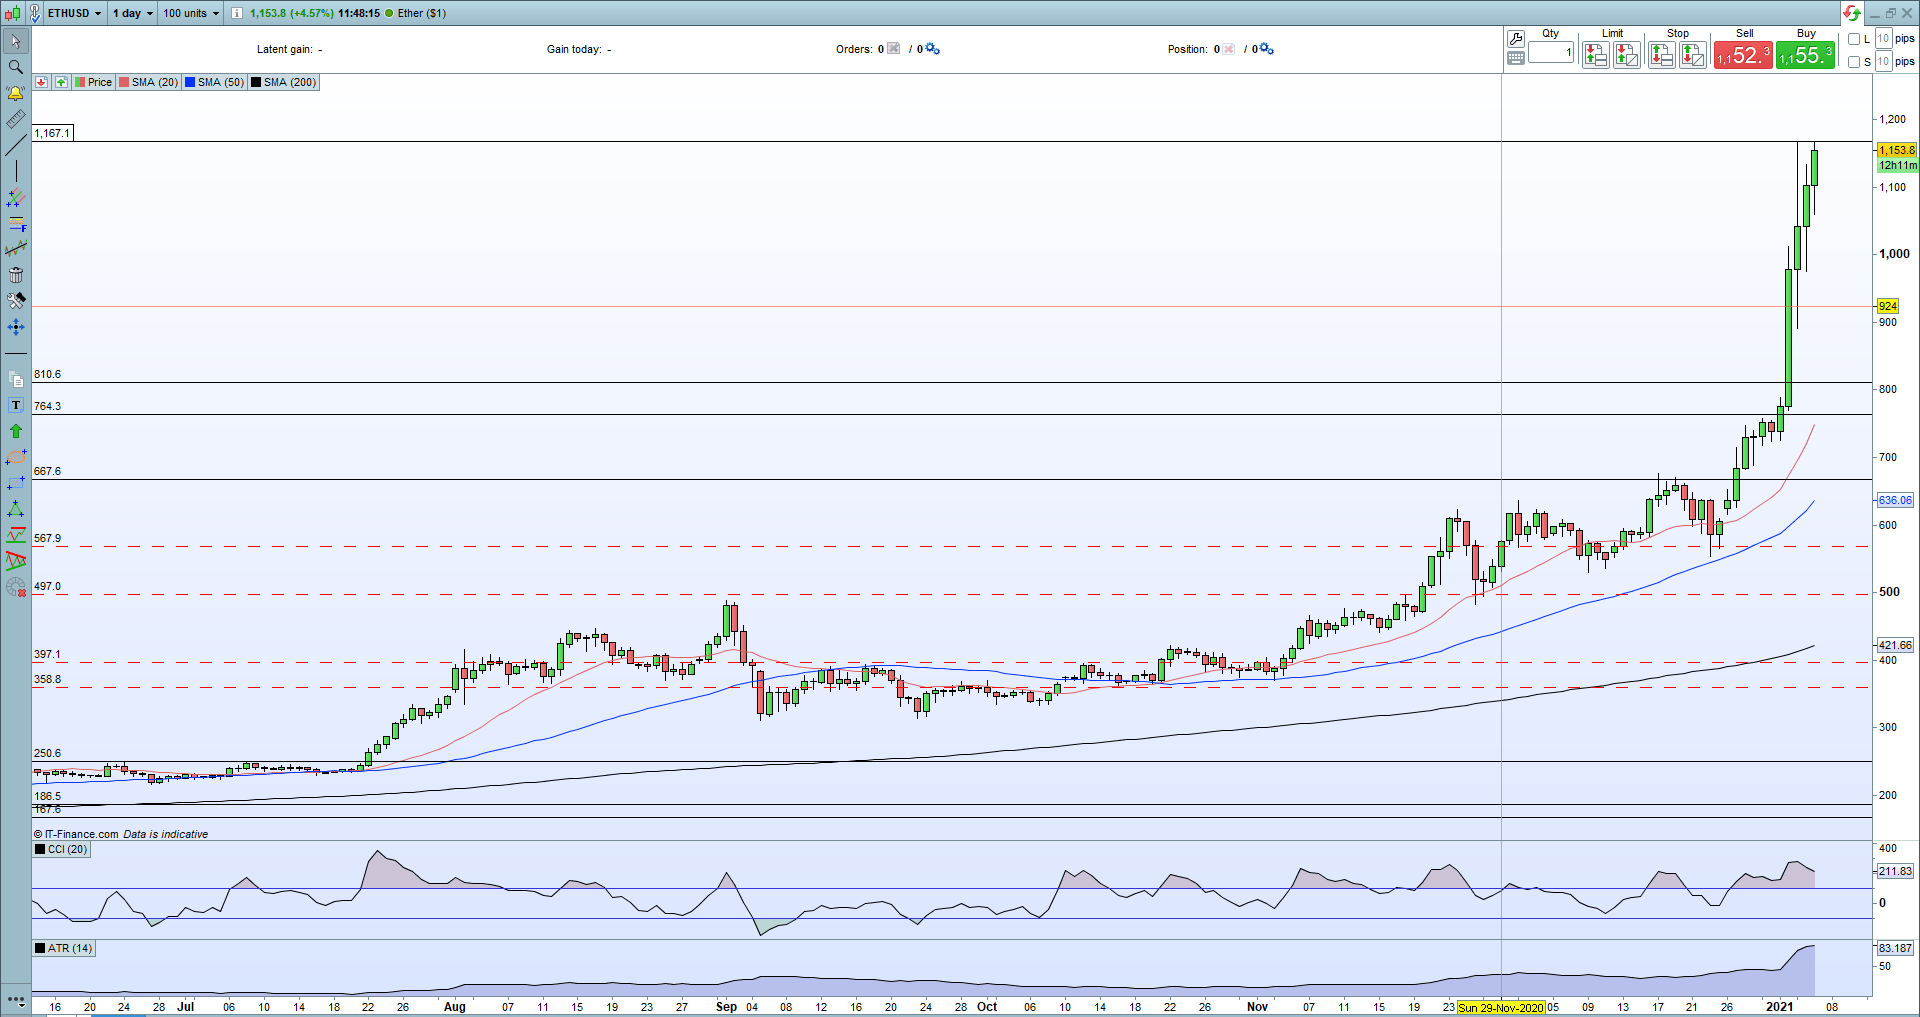
Ethereum continues to ride the wave higher and a break and close above Monday’s $1,167 high will open the door for a potential re-test of the January 2018 high of $1,420. Again volatility is at extreme levels, using ATR, but as long as the recent series of higher lows remain in place, as with Bitcoin, any set-backs/sell-offs should be carefully considered.
Ethereum Daily Price Chart (June 2020 – January 6, 2021)
| Change in | Longs | Shorts | OI |
| Daily | 6% | 0% | 5% |
| Weekly | 37% | 32% | 36% |
Retail trader data show 89.87% of traders are net-long with the ratio of traders long to short at 8.87 to 1. We typically take a contrarian view to crowd sentiment, and the fact traders are net-long suggests Ethereum prices may continue to fall.Positioning is more net-long than yesterday but less net-long from last week. The combination of current sentiment and recent changes gives us a further mixed Ethereum trading bias.
Last October, the UK Financial Conduct Authority (FCA) published final rules ‘banning the sale of derivatives and exchange traded notes (ETNs) that reference certain types of cryptoassets to retail consumers’. These rules come into force today and effectively ban any retail trader from opening a new position, while pre-existing positions can be kept until closed. These rules do not apply to professional traders.
FCA Bans the Sale of Crypto-Derivatives to Retail Consumers
What are your views on Bitcoin (BTC) and Ethereum (ETH) – bullish or bearish?? You can let us know via the form at the end of this piece or you can contact the author via Twitter @nickcawley1.