
ETH/USD – Ethereum Continues To Set Multi-Year Highs
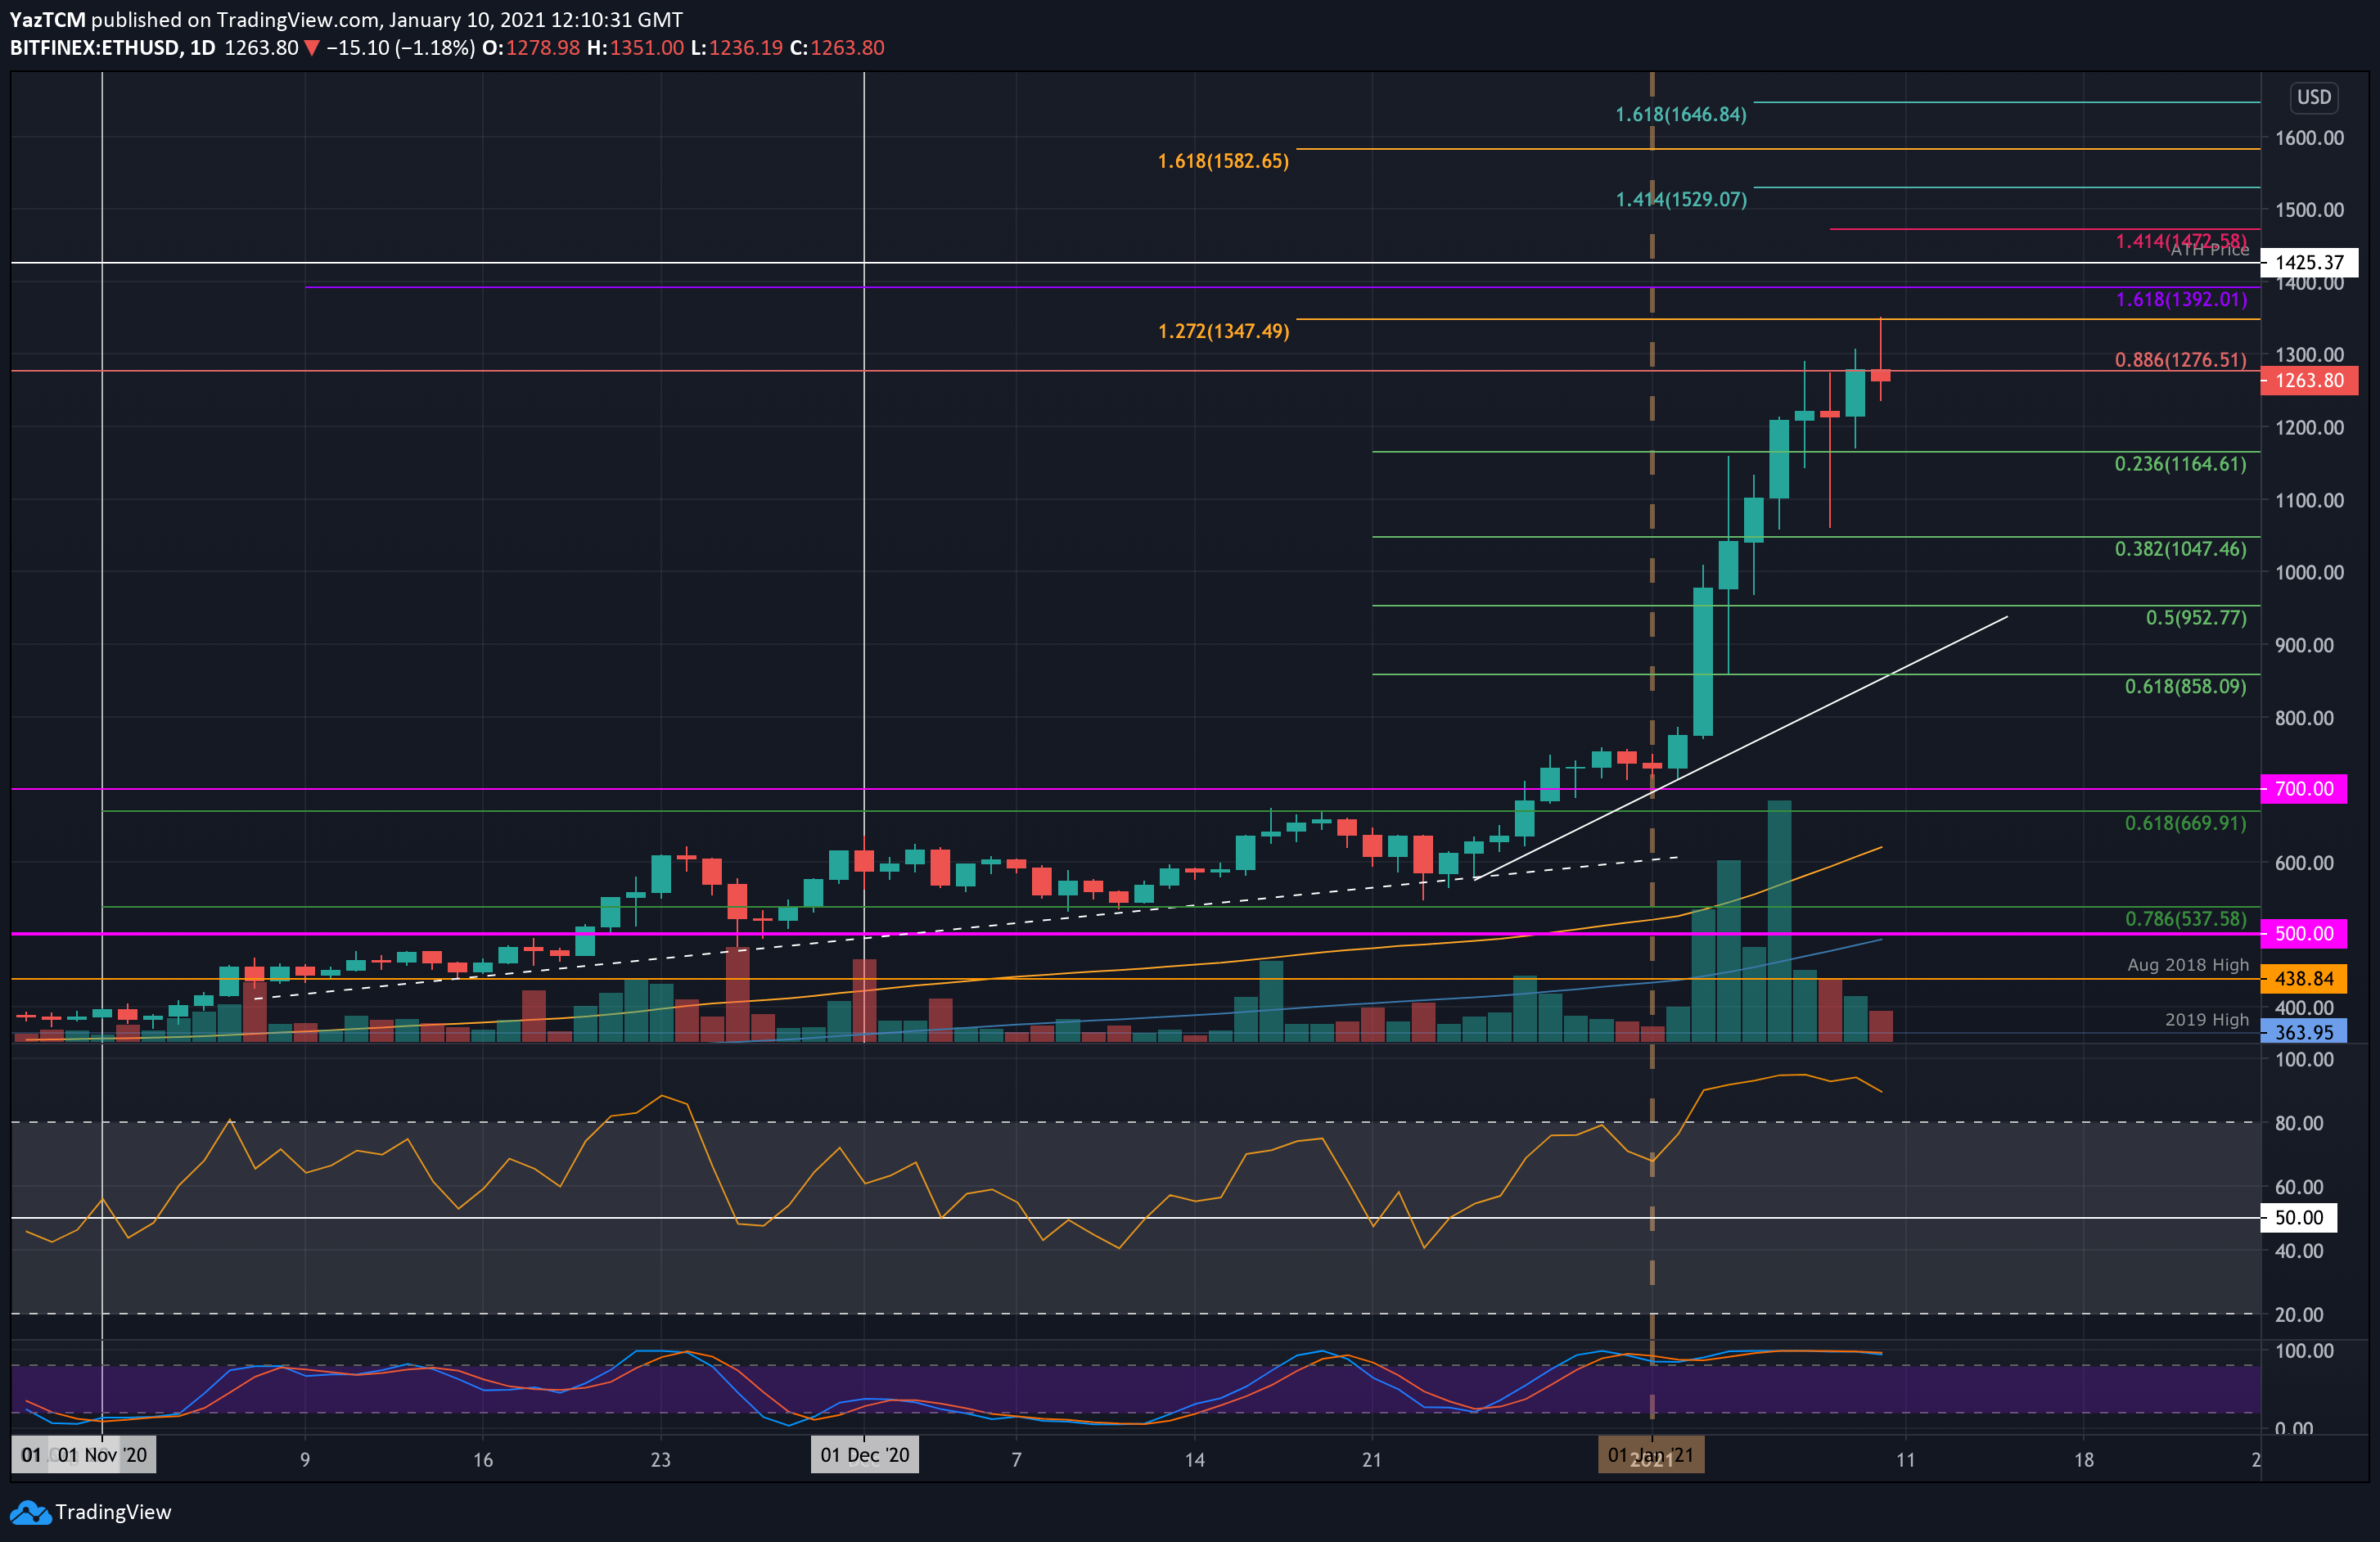
Key Support Levels: $1275, $1200, $1165.
Key Resistance Levels: $1350, $1390, $1425.
This past week, Etheruem surged higher from $800 to reach the resistance at $1275 on Friday, provided by a bearish .886 Fib Retracement. It stalled here for a couple of days as it traded along with the support of $1165 (.236 Fib Retracement).
Today, Ethereum managed to push above the resistance at $1275 to climb higher towards $1350 (current daily high and current 3-year high), provided by a 1.272 Fibonacci Extension level.
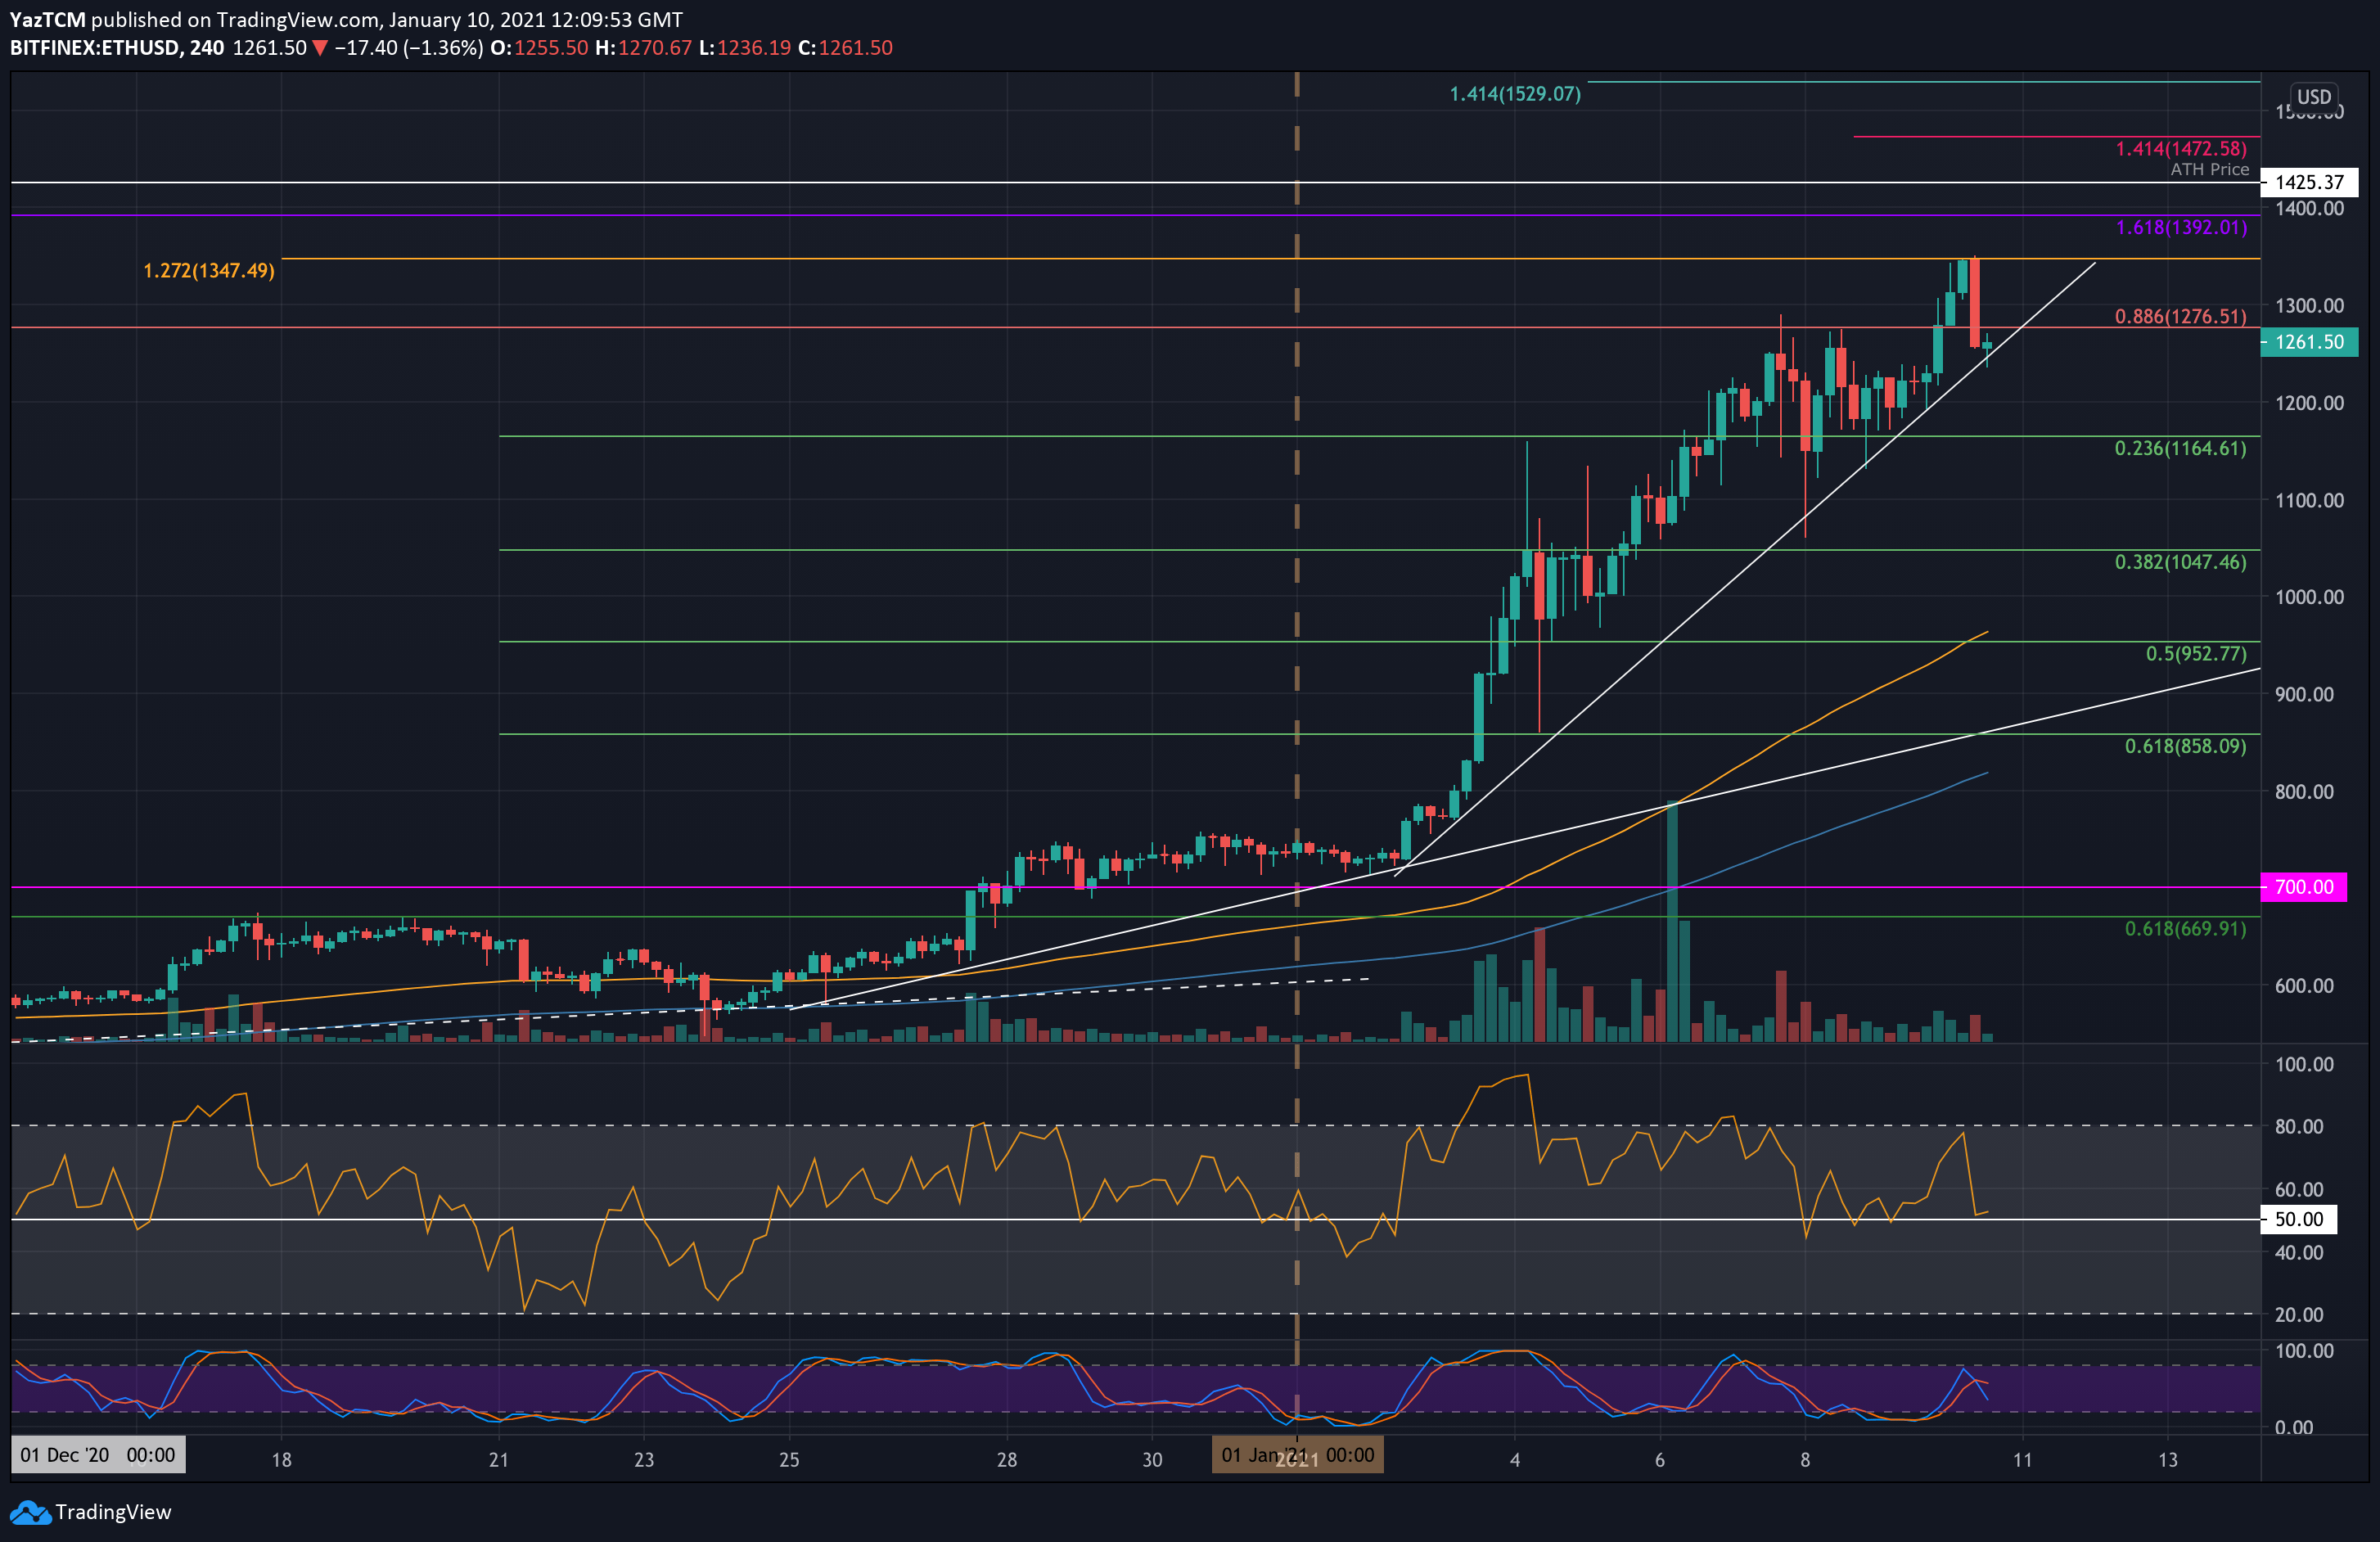
It has since dropped sharply more than $100, along with Bitcoin’s correcting below $39K. As of writing these words, ETH was able to find support by a mid-term ascending trend-line (as marked on the 4-hour’s chart) and recovered half of the drop.
ETH-USD Short Term Price Prediction
Looking ahead, the first level of resistance lies at $1350 (1.272 Fib Extension). This is followed by $1390 (long term 1.618 Fib Extension – purple), $1425 (ATH Price), and $1470 (short term 1.414 Fib Extension).
If the bulls continue beyond $1500, added resistance is found at $1530, $1582, and $1645.
On the other side, the first level of support lies at $1275 (previous bearish .886 Fib & rising trend line). This is followed by added support at $1200, $1165 (.236 Fib), $1100, and $1050 (.382 Fib).
On the daily time frame, the RSI is extremely overbought and is showing hints of bearish divergence.
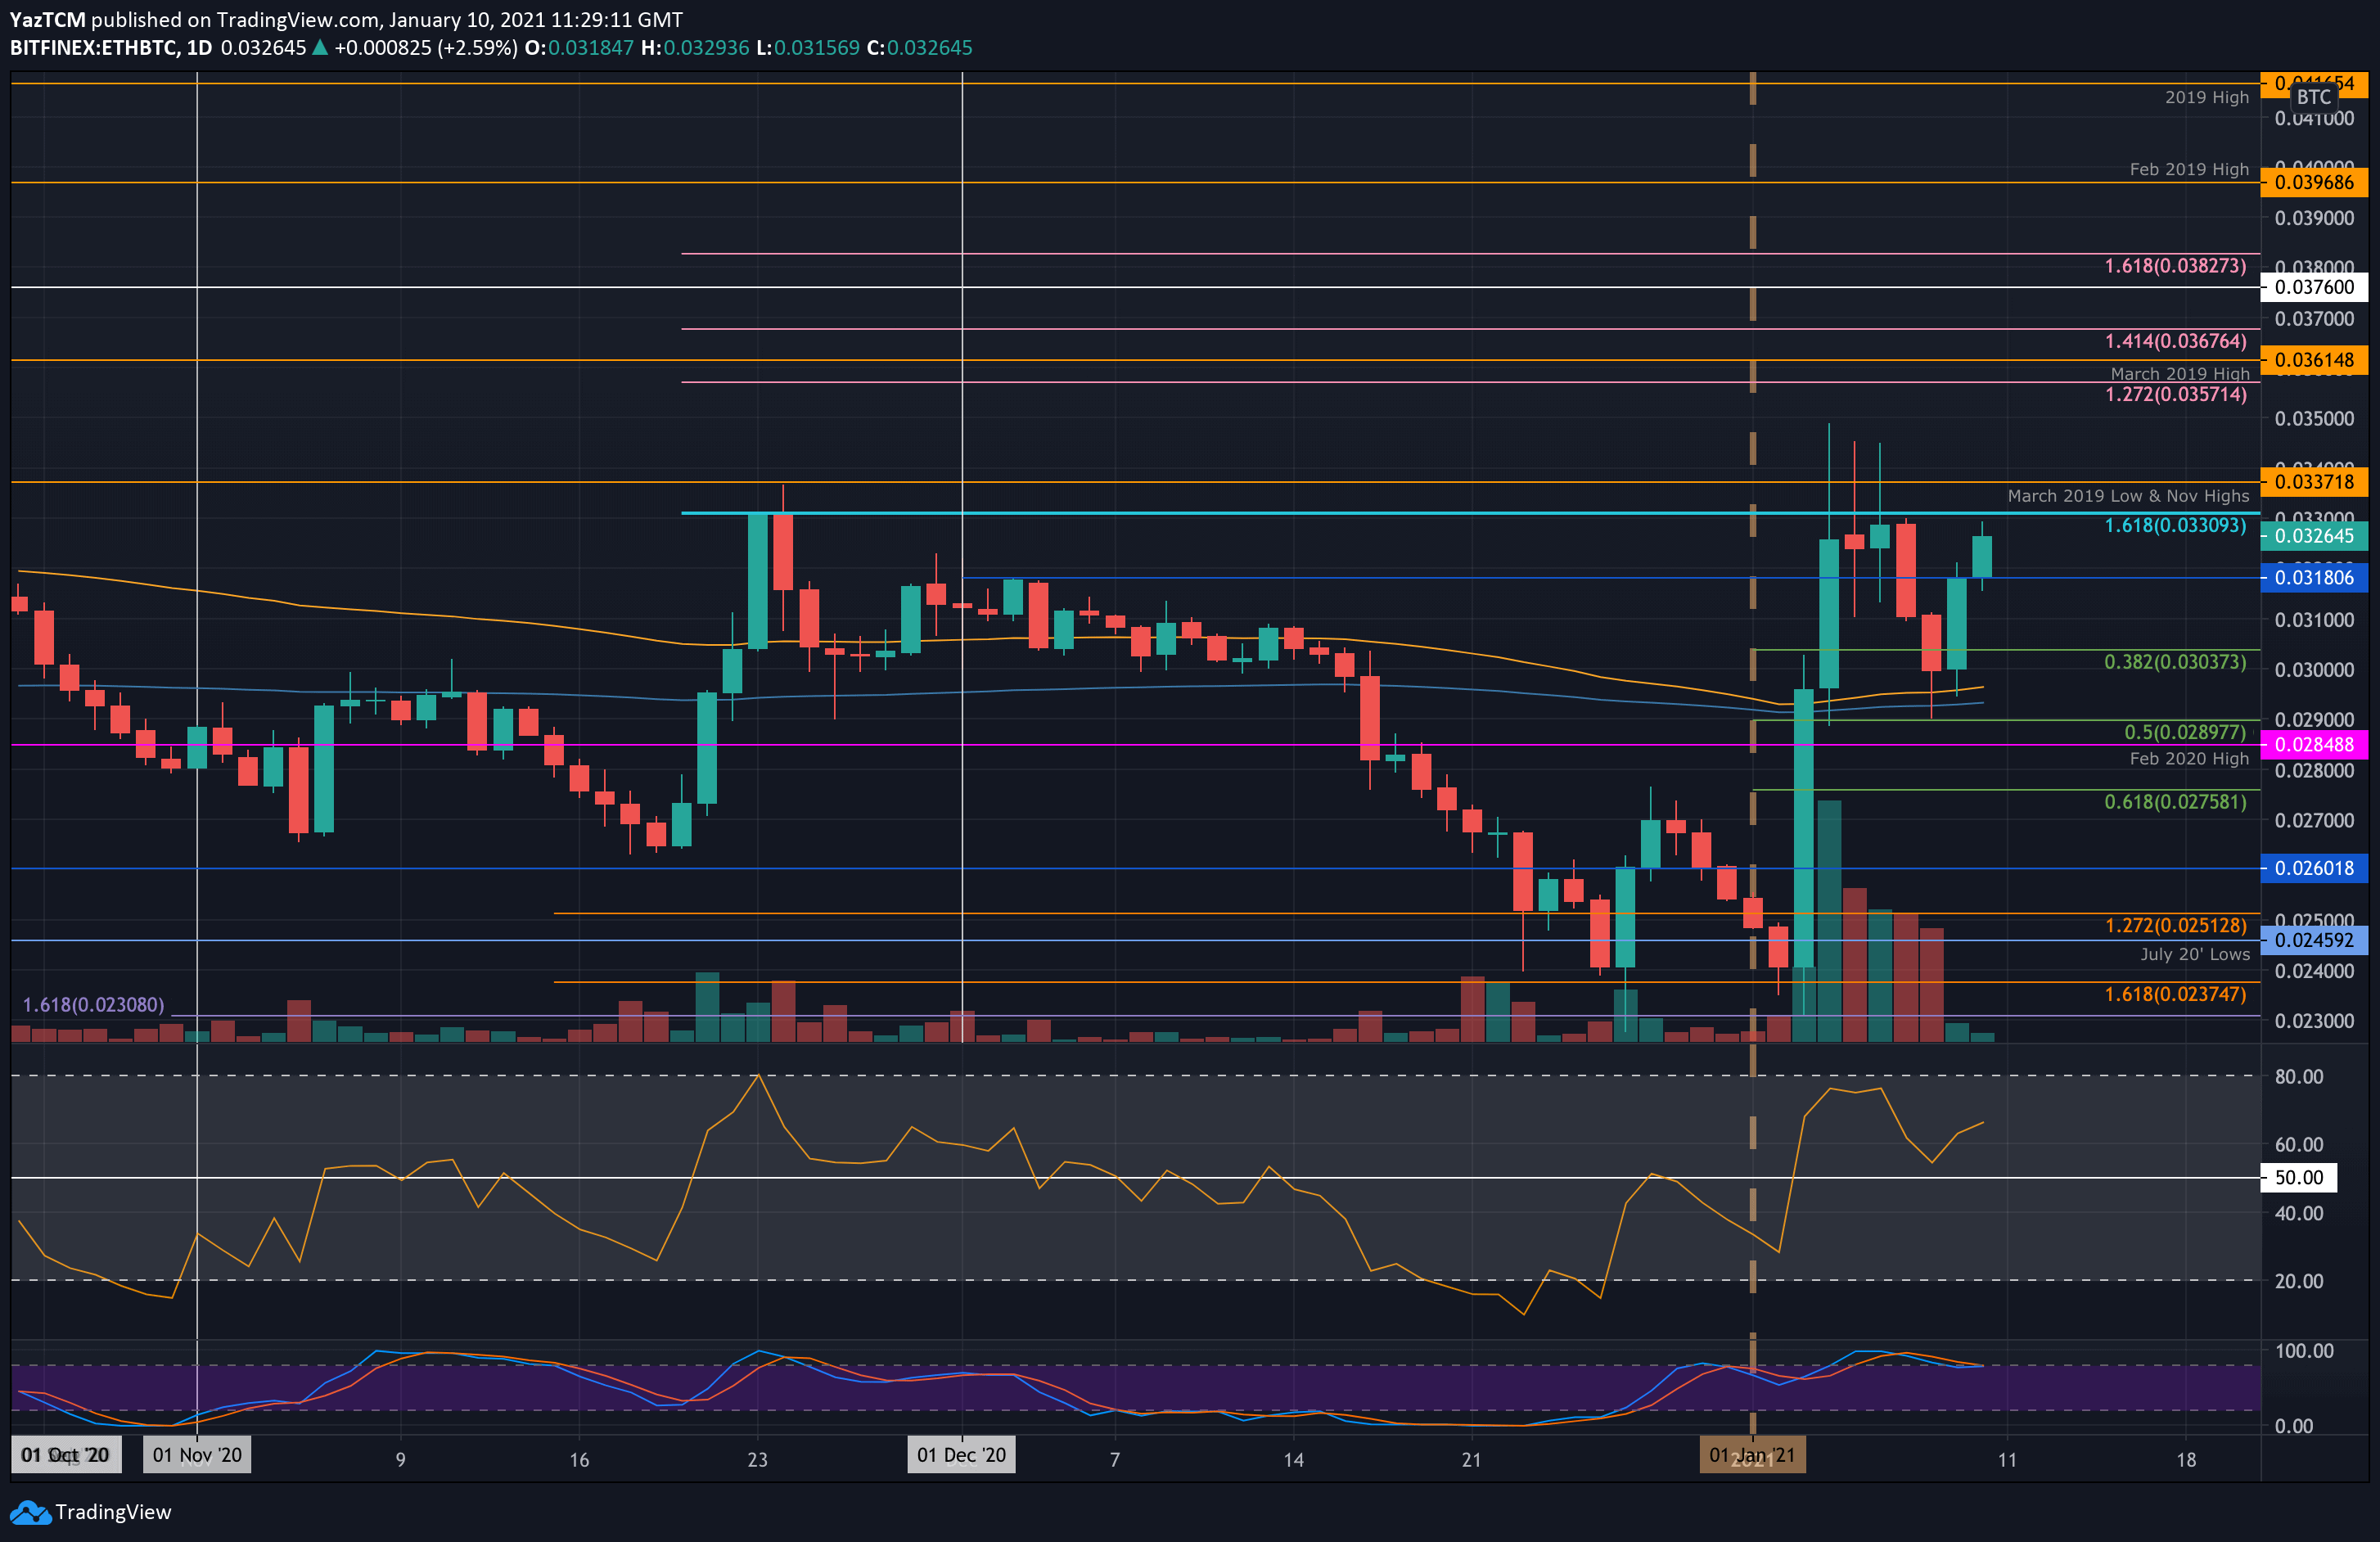
ETH/BTC – Bulls Edge Back Toward 0.033 BTC
Key Support Levels: 0.0318 BTC, 0.031 BTC, 0.0303 BTC
Key Resistance Levels: 0.033 BTC, 0.0337 BTC, 0.0361 BTC.
Against Bitcoin, ETH had surged higher into resistance at 0.033 BTC (Nov High-Day Closing Price) this past week. It could not break this resistance, which caused it to head lower into support at 0.0289 BTC (.5 Fib Retracement).
It has since bounced higher from there to meet resistance at 0.0318 BTC (Dec 2020 Highs) yesterday. Today, it continued to hit 0.0326 BTC.
ETH-BTC Short Term Price Prediction
Looking ahead, the first resistance lies at 0.033 BTC. This is followed by resistance at the November highs around 0.0337 BTC. Additional resistance is found at 0.035 BTC and 0.0361 BTC (March 2019 Highs).
On the other side, the first support level lies at 0.0318 BTC (Dec 2020 highs). This is followed by 0.031 BTC, 0.0303 BTC (.382 Fib), 0.0292 BTC (200-days EMA), and 0.0287 BTC (.5 Fib).
The RSI dropped from overbought conditions earlier in the month and is still not overbought after rebounding.
PrimeXBT Special Offer: Use this link to register & enter CRYPTOPOTATO35 code to get 35% free bonus on any deposit up to 1 BTC.
Disclaimer: Information found on CryptoPotato is those of writers quoted. It does not represent the opinions of CryptoPotato on whether to buy, sell, or hold any investments. You are advised to conduct your own research before making any investment decisions. Use provided information at your own risk. See Disclaimer for more information.
Cryptocurrency charts by TradingView.