
The Monero (XMR) price has been moving downwards since it was rejected by a long-term resistance area on Oct 26.
While a short-term increase could occur, it is likely that the longer-term trend is bearish.
XMR Approaches Support
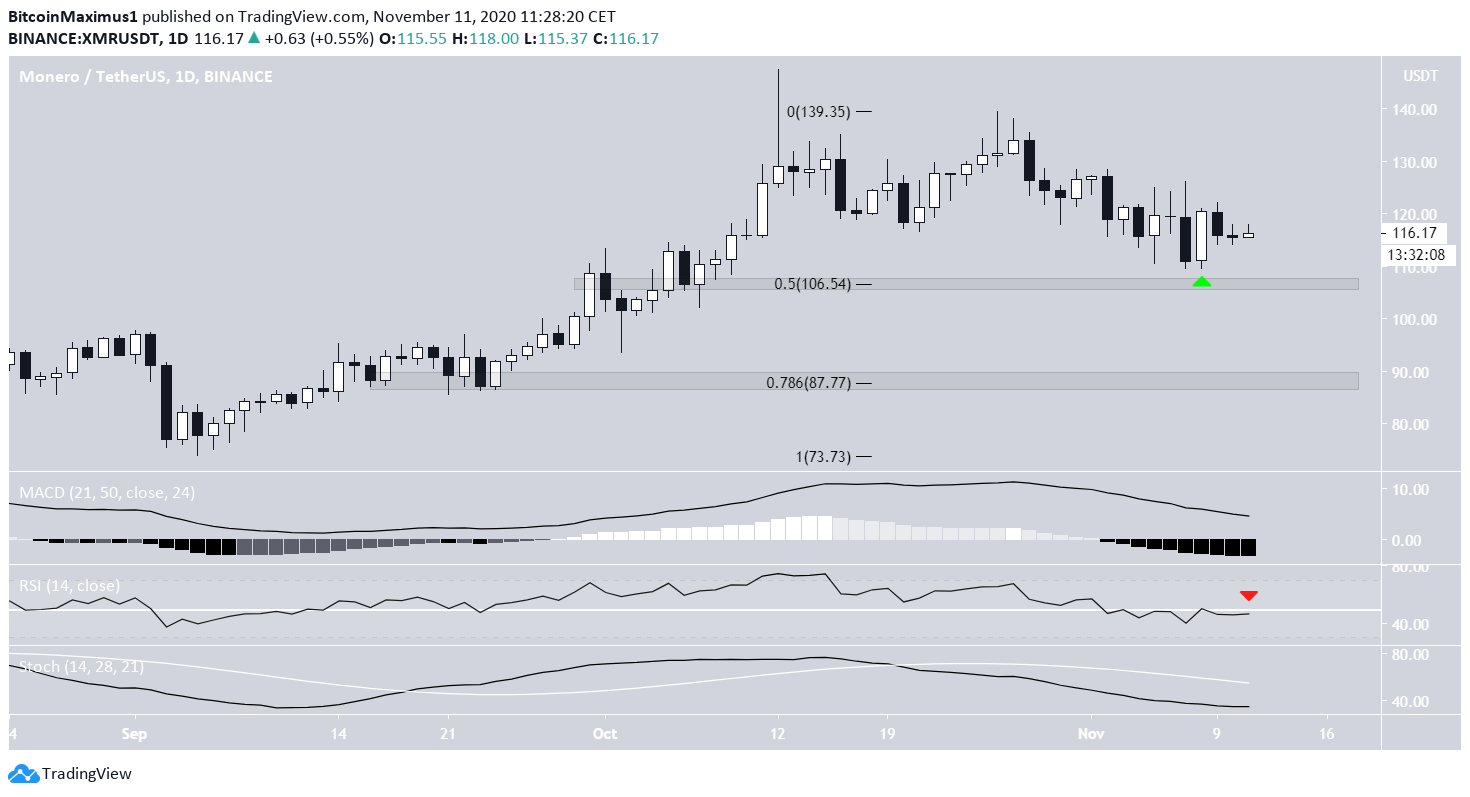
The XMR price has been decreasing since a two-and-a-half-year high of $140.65 was reached on Oct 26. The decrease has been gradual and the price has nearly reached the $106.50 support area, which is the 0.5 Fib level of the entire upward move.
If the price were to break down, the next closest horizontal and Fib support level would be found at $88.
On Nov 8, the XMR price created a bullish engulfing candlestick, a sign of a trend reversal. Despite this, technical indicators are bearish as the MACD, RSI, and Stochastic oscillator are decreasing. The MACD is currently below 0 and the RSI is below 50.
Possible Breakout
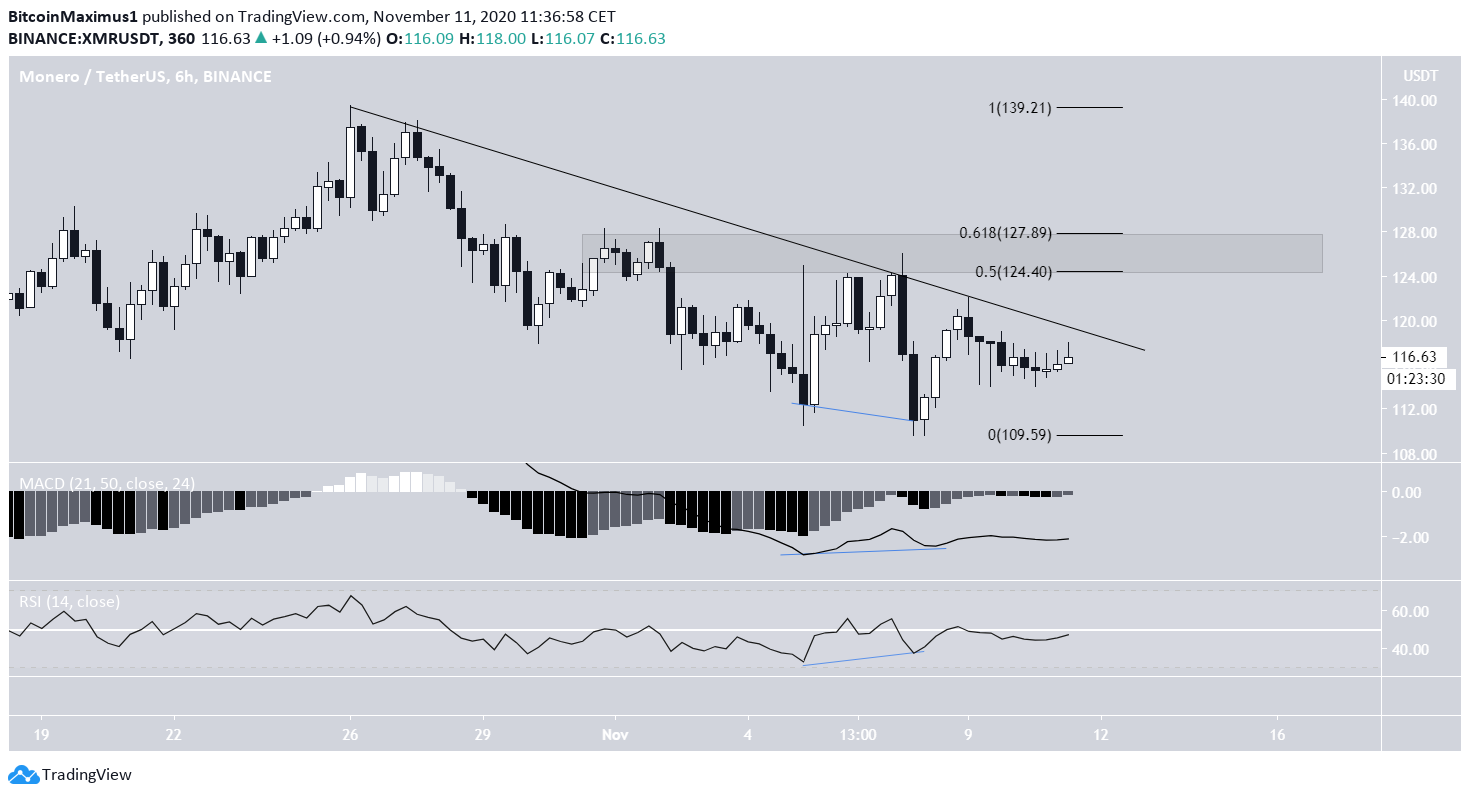
The shorter-term six-hour chart shows that the price has been following a descending resistance line since the aforementioned Oct 26 high.
Technical indicators suggest that a breakout could soon transpire. Both the RSI & MACD have generated bullish divergence and began to move upwards.
However, even if the price breaks out, there is likely to be very significant resistance between $124.50 and $128, the 0.5-0.618 Fib levels of the entire decrease.
Therefore, unless the price breaks out above this area, the trend is likely to be bearish, also supported by the readings from the daily time-frame.

Future Movement
Cryptocurrency trader @dentoshi93 tweeted a weekly XMR chart that predicts a drop towards $90 followed up by a rally back towards the recent highs.

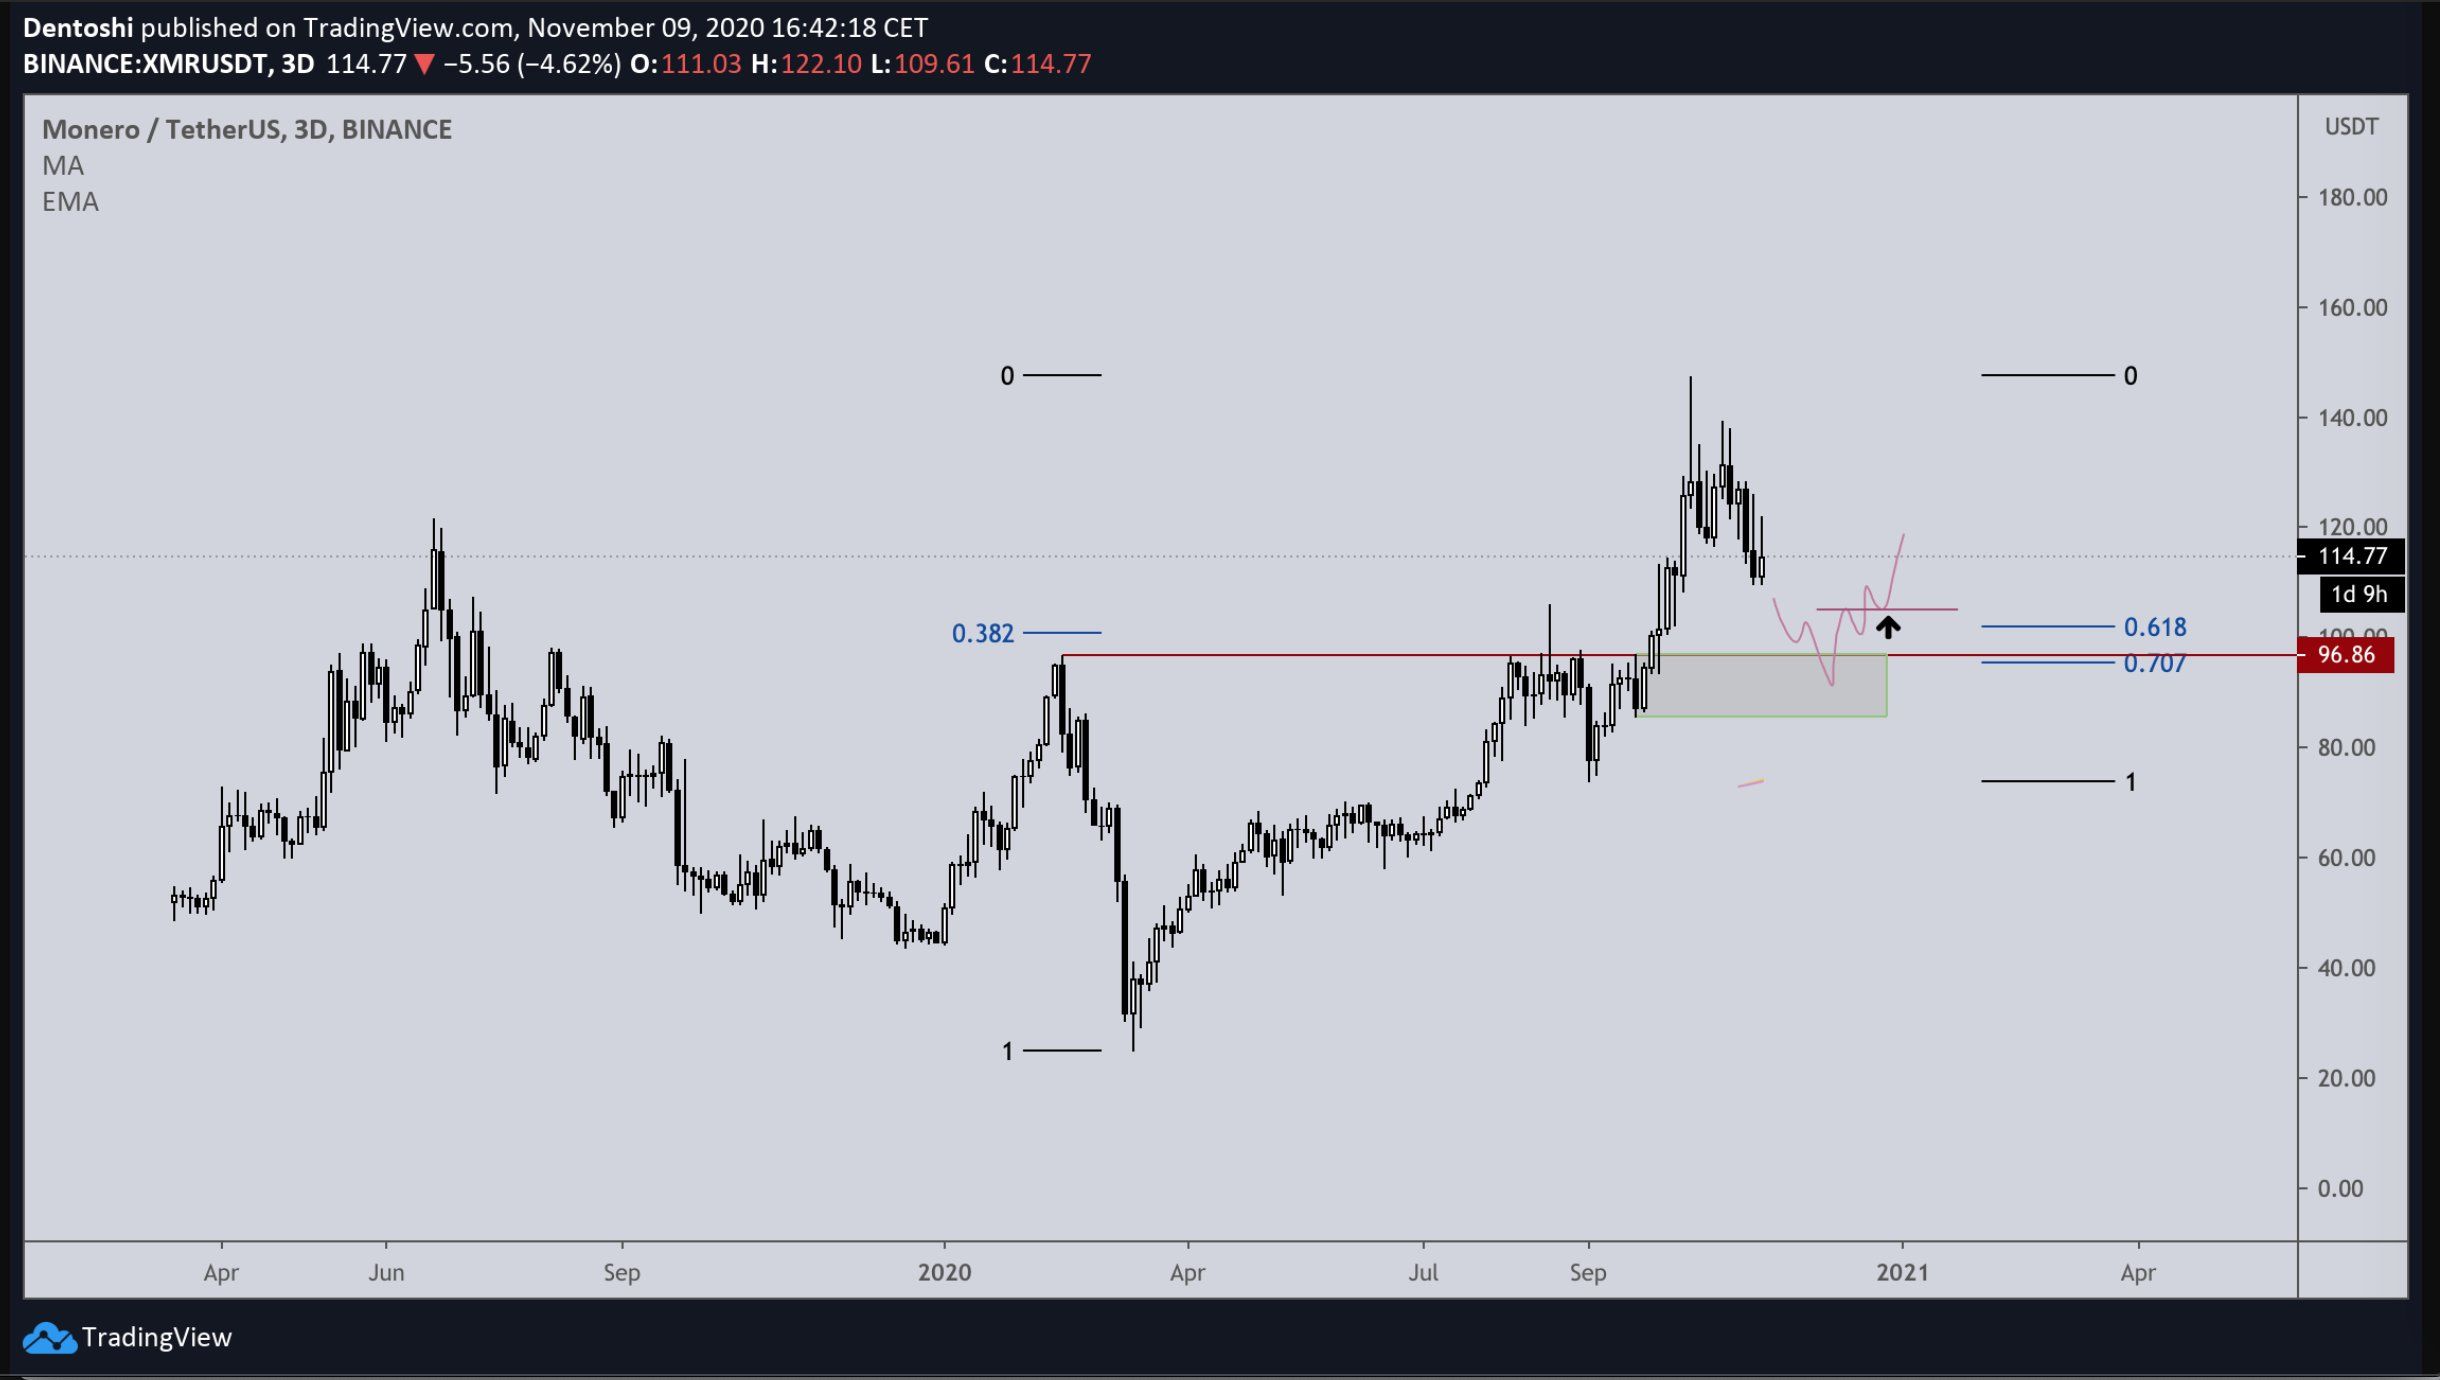
The weekly chart shows that the price has been rejected by the 0.382 Fib level at $133 before creating a long upper wick and decreasing. The same area also caused a rejection in July 2019, resulting in a similar wick.
If the price continues decreasing, the closest support level is the previous breakout area at $95, aligning with the target given in the tweet.
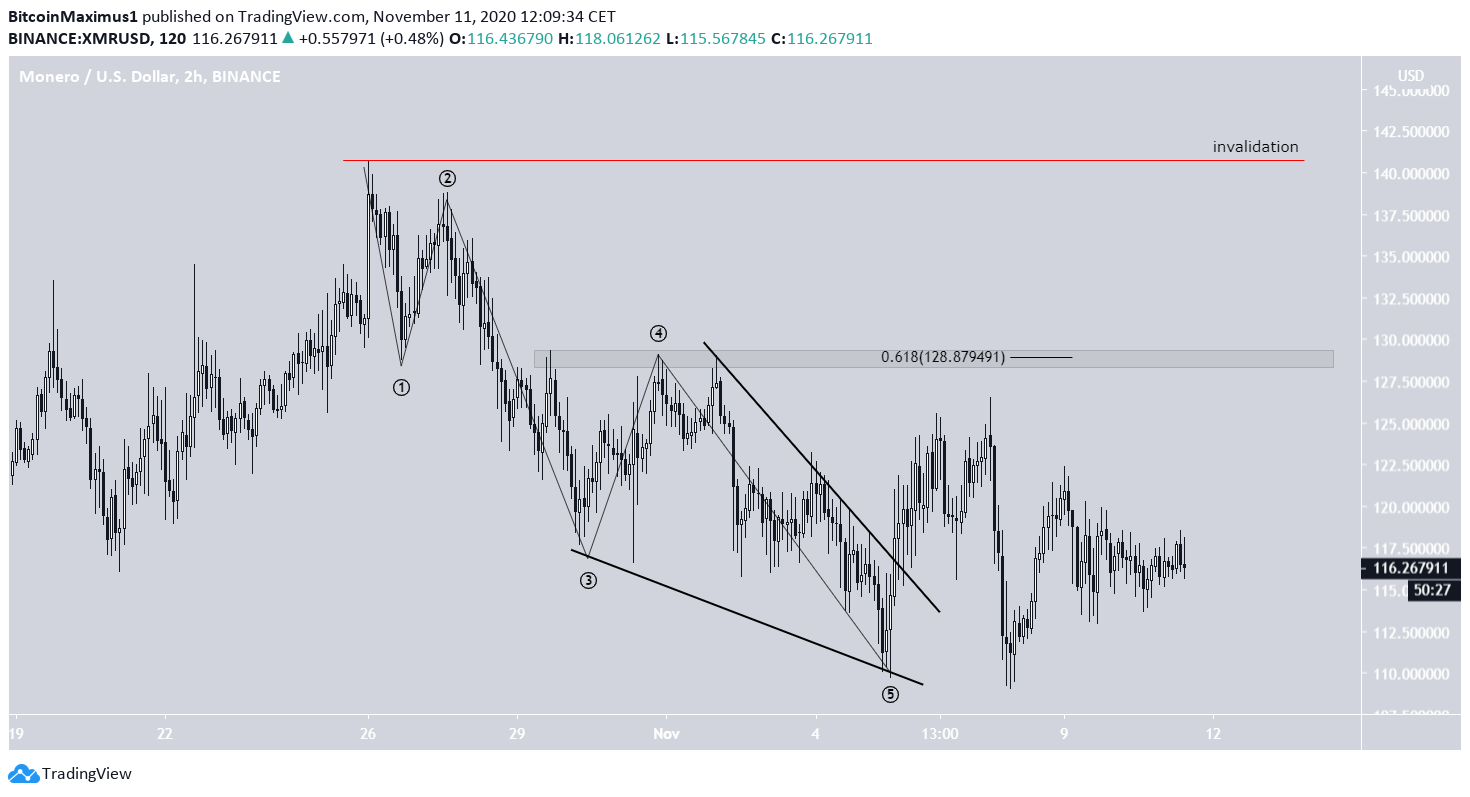
Wave Count
The wave count since the March low suggests that XMR has already completed a bullish impulse (shown in black below) and has now begun a correction.
The Oct 26 high also coincides with the target given by the 2.61 Fib extension of wave 1. Combining this with the bearish divergence in the daily RSI during the high, it makes it likely that XMR has already reached a top, and will now correct towards the support level previously outlined.

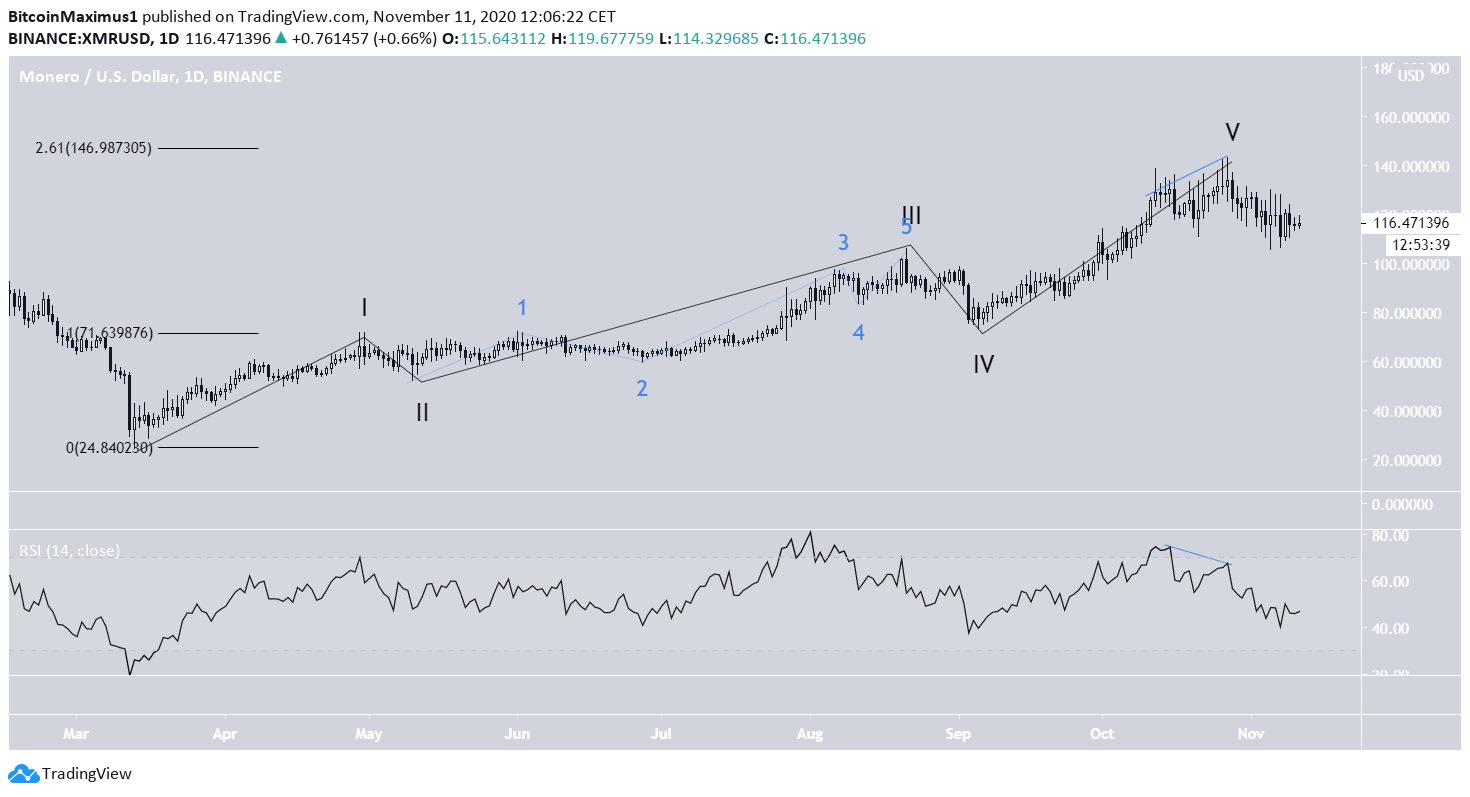
If the count is accurate, the price has already begun a corrective movement, noted by the leading diagonal (black) in place since Oct 26.
Therefore, unless the price manages to move above the $128 area, any short-term increases are likely to be corrective.
A price increase above the Oct 26 high would invalidate this particular formation.
Conclusion
It’s possible that XMR has completed a nearly six-month-long bullish upward move and has now begun a corrective formation that could eventually lead the price towards $90.
For BeInCrypto’s latest Bitcoin analysis, click here!
Disclaimer: Cryptocurrency trading carries a high level of risk and may not be suitable for all investors. The views expressed in this article do not reflect those of BeInCrypto.