
Bitcoin
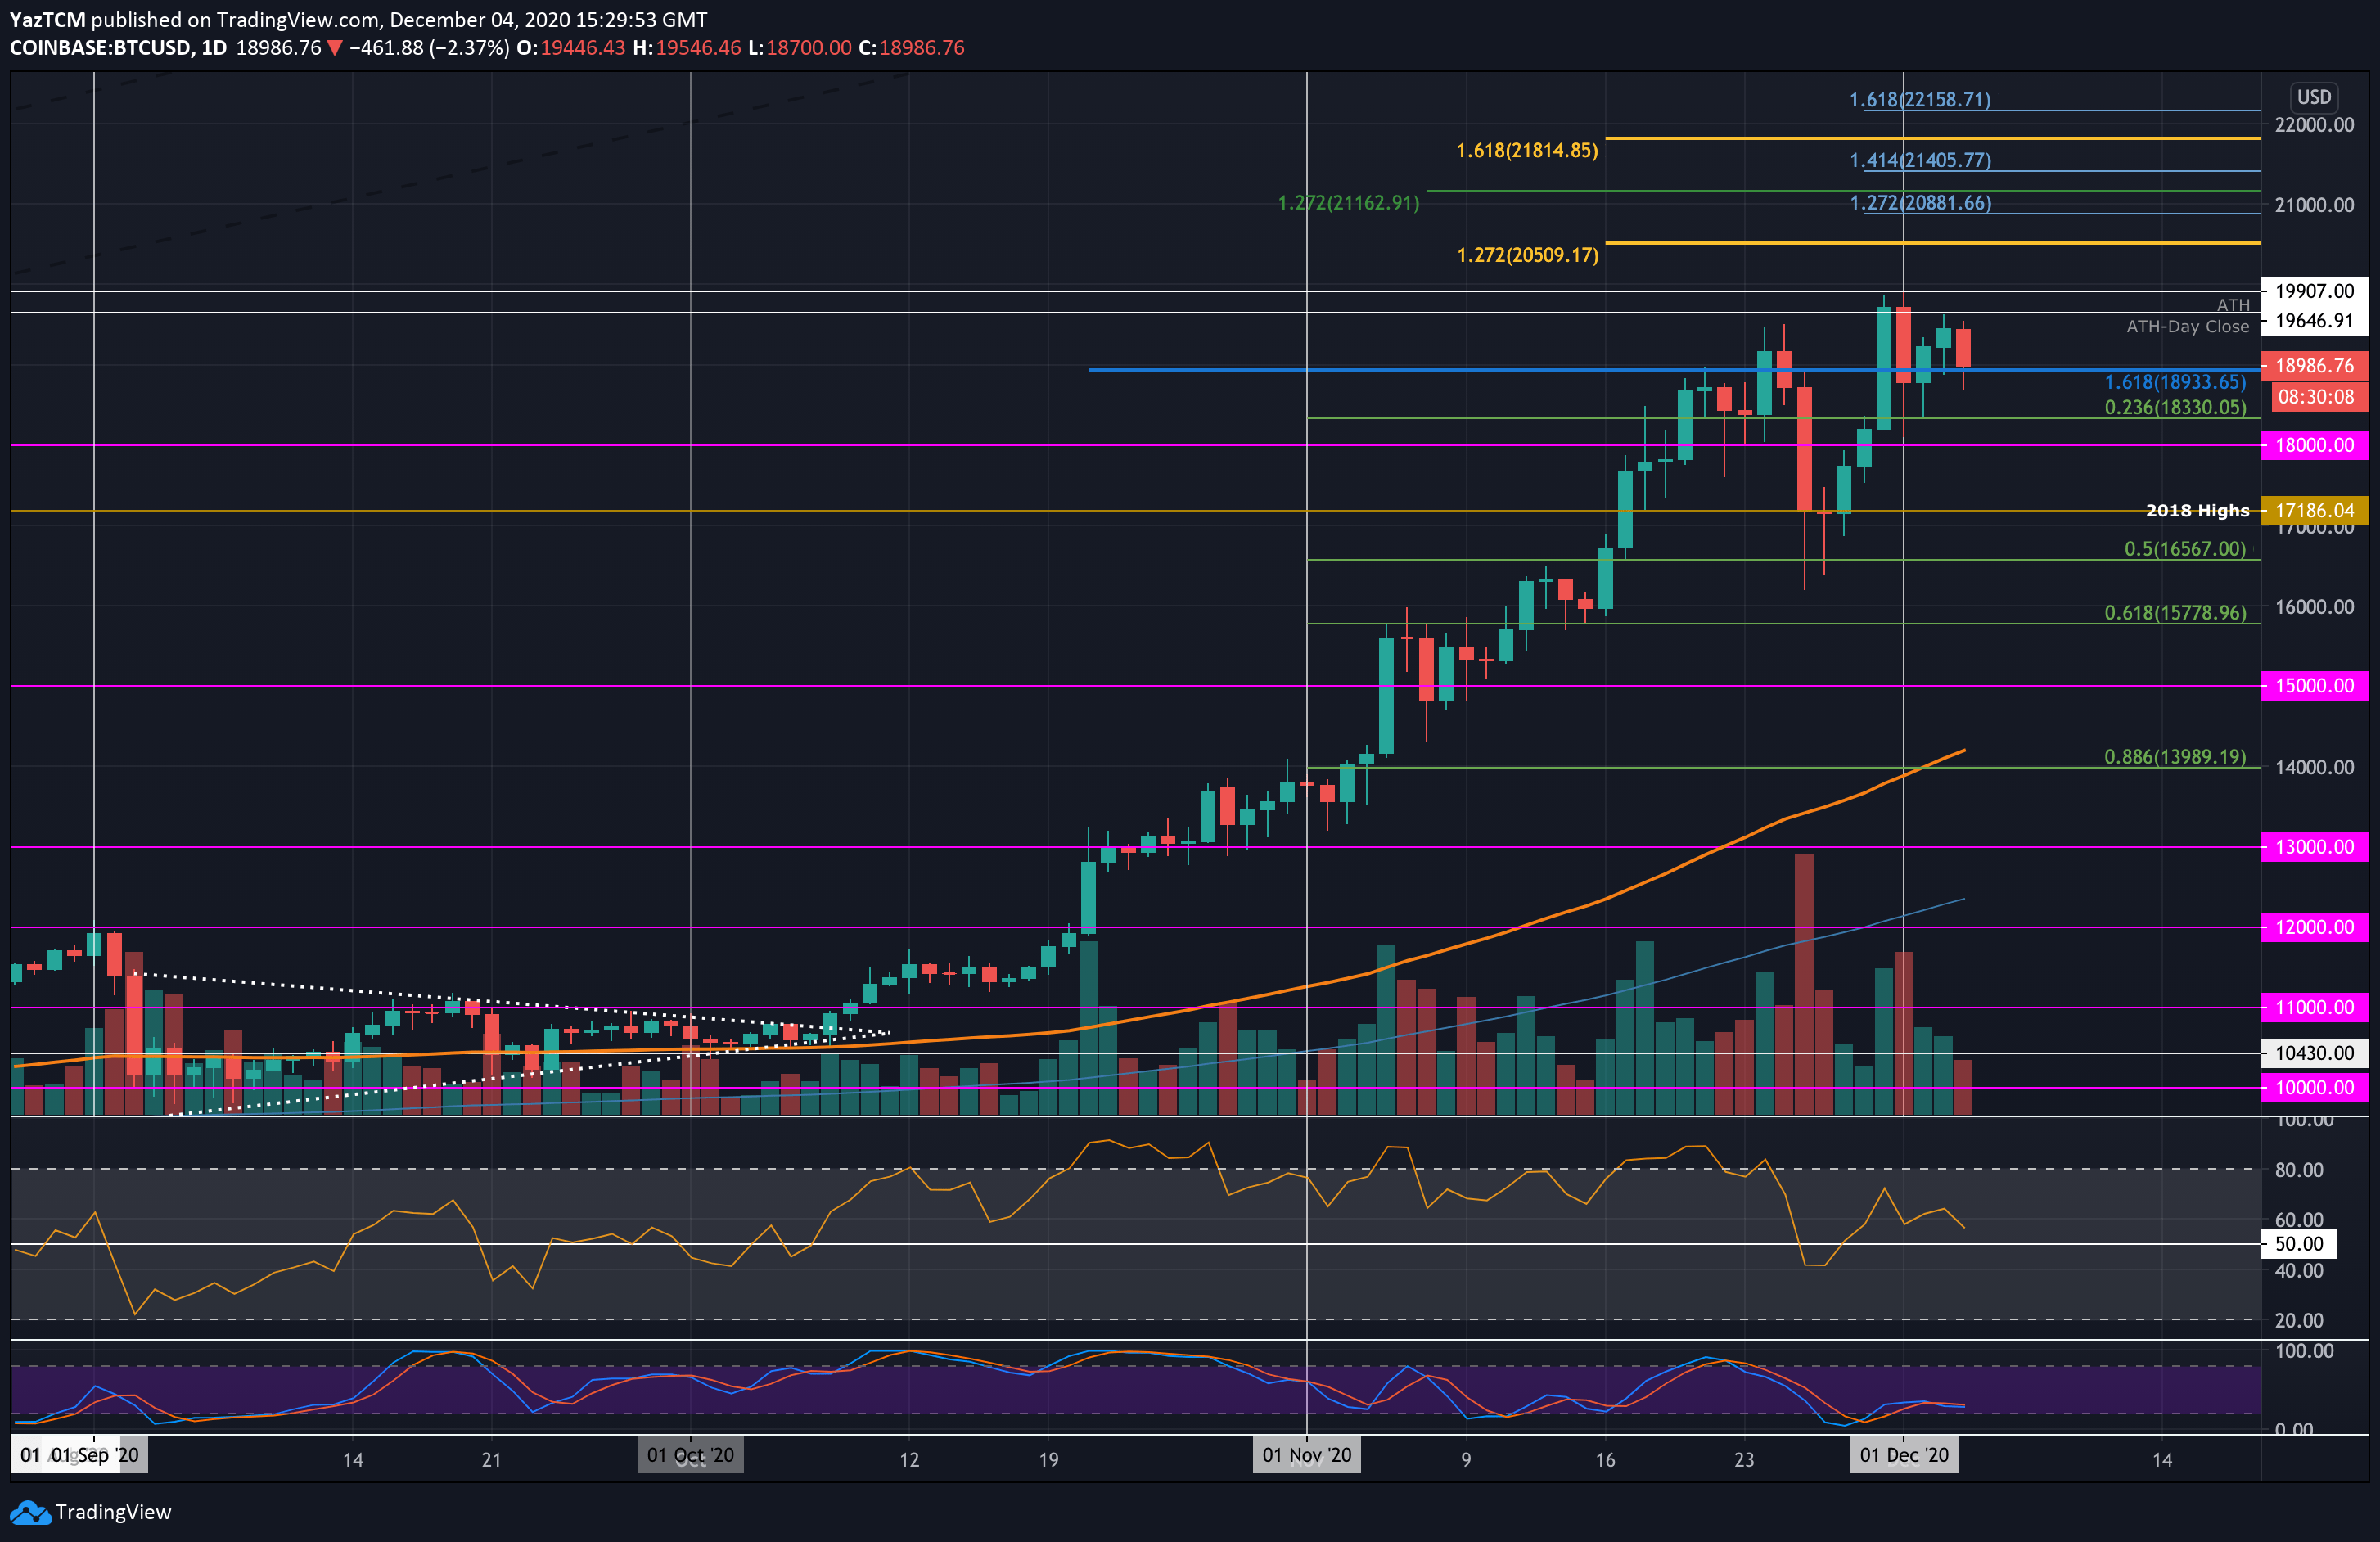
Bitcoin witnessed a strong 10.6% price surge this past week as the cryptocurrency is trading at $19,000. It had recovered from the $17,186 level last Friday and started to push higher over the weekend. The coin went on to scratch the previous ATH level of $19,907 (Coinbase price) on Monday.
Unfortunately, it turned away from the ATH and headed lower on Tuesday into the $18,330 support (.236 Fib Retracement). It has since bounced higher to re-test the ATH-day closing price at $19,646 but could not break there and dropped to $19,000 today.
Looking ahead, if the buyers can hold $19,000 and push higher, the first level of resistance lies at $19,656 (ATH-day closing price). The ATH price follows this at $19,907. Above it, resistance lies at $20,000, $20509, $20,881, $21,000, and $21,162.
On the other side, if the sellers push beneath $19,000, support lies at $18,330 (.236 Fib), $18,999, $17,186 (2018 Highs), and $16,567 (.5 Fib Retracement).
Ethereum
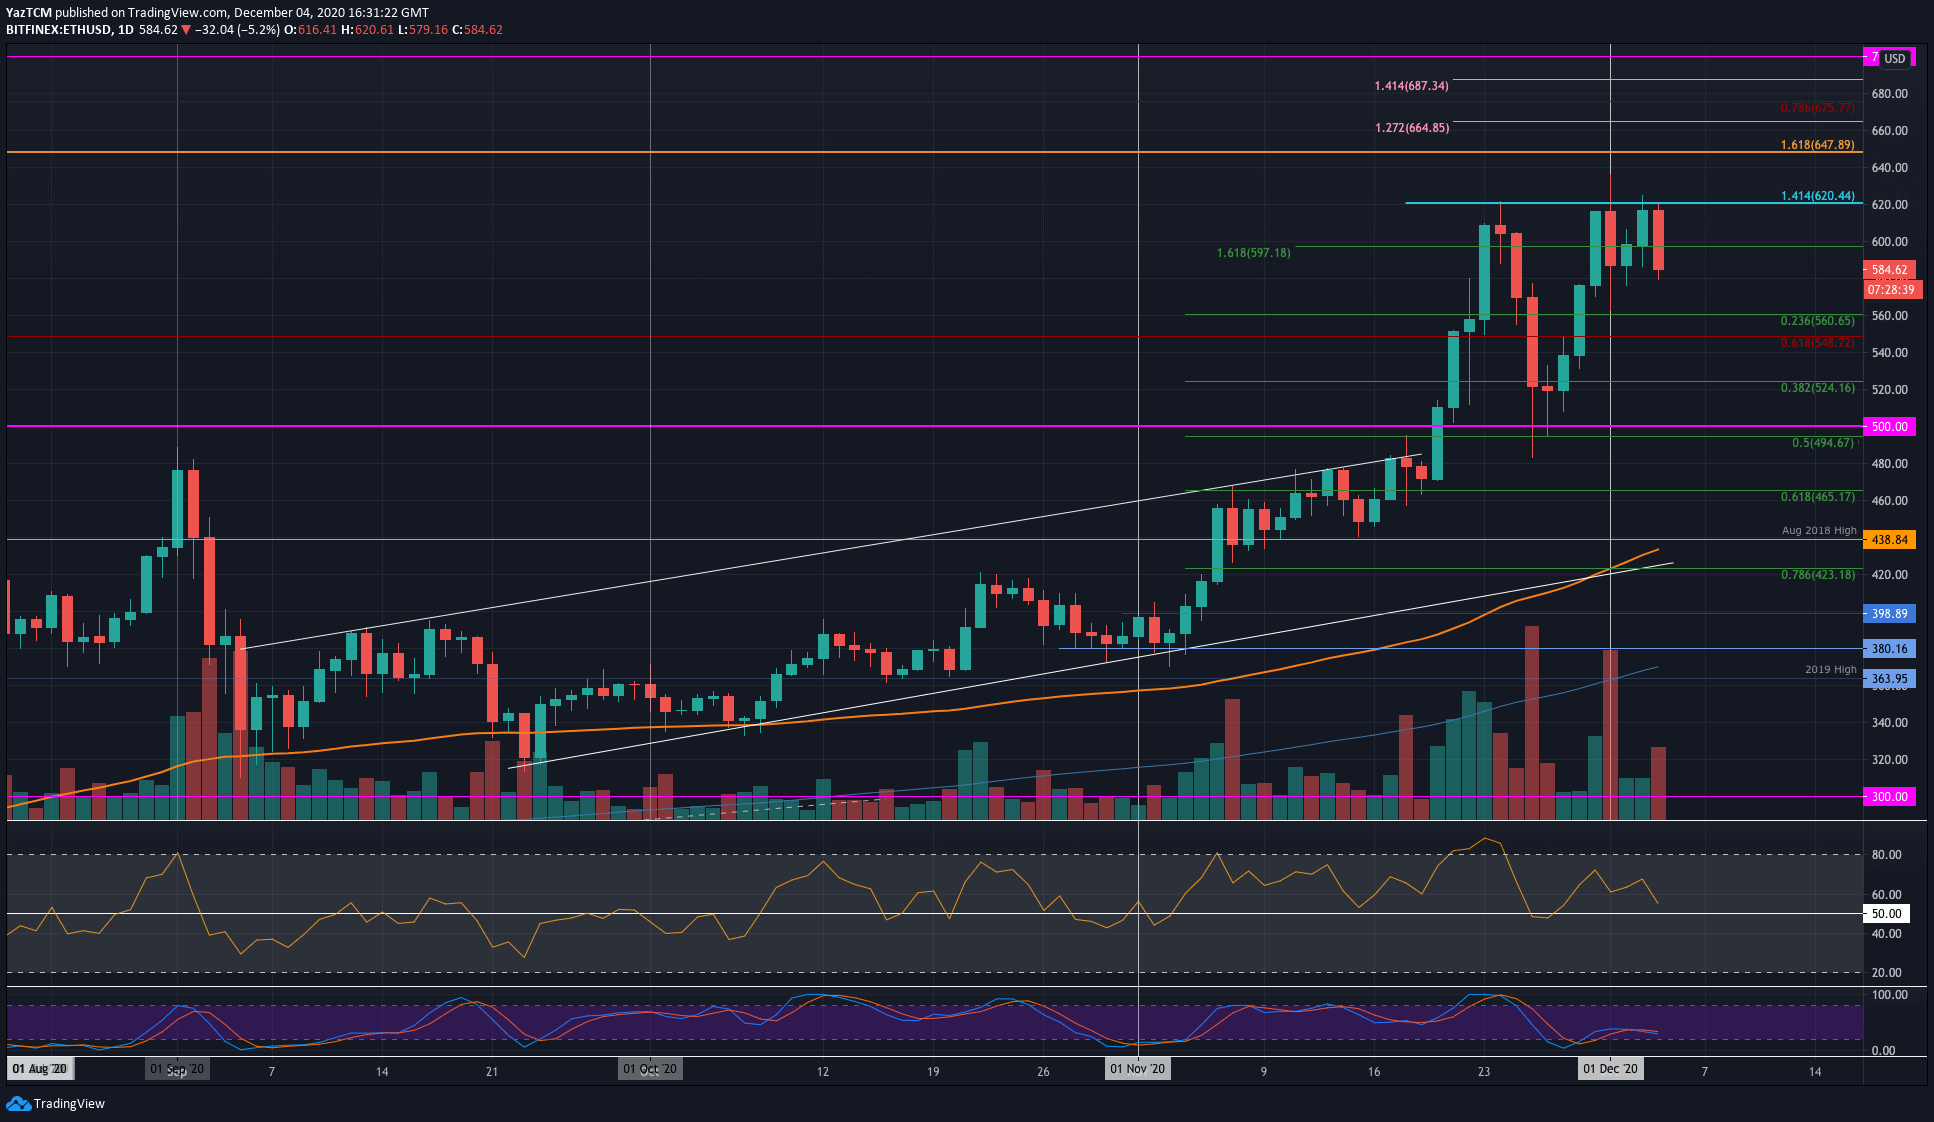
Ethereum witnessed a solid 13.2% price hike this week as it currently trades at $586. The coin had rebounded from the support at $520 last Friday as it surged into the resistance at $620 again this week.
ETH made two attempts to break the resistance at $620 and failed on both occasions. It has since dropped to trade at around $585 today.
Looking ahead, if the sellers break $585, the first level of support lies at $560 (.236 Fib). Beneath this, support lies at $550, $524 (.382 Fib), and $500.
On the other side, the first level of resistance now lies at $600. Above this, resistance lies at $620 (1.414 Fib Extension), $650, $665, and $675 (bearish .786 Fib Retracement).
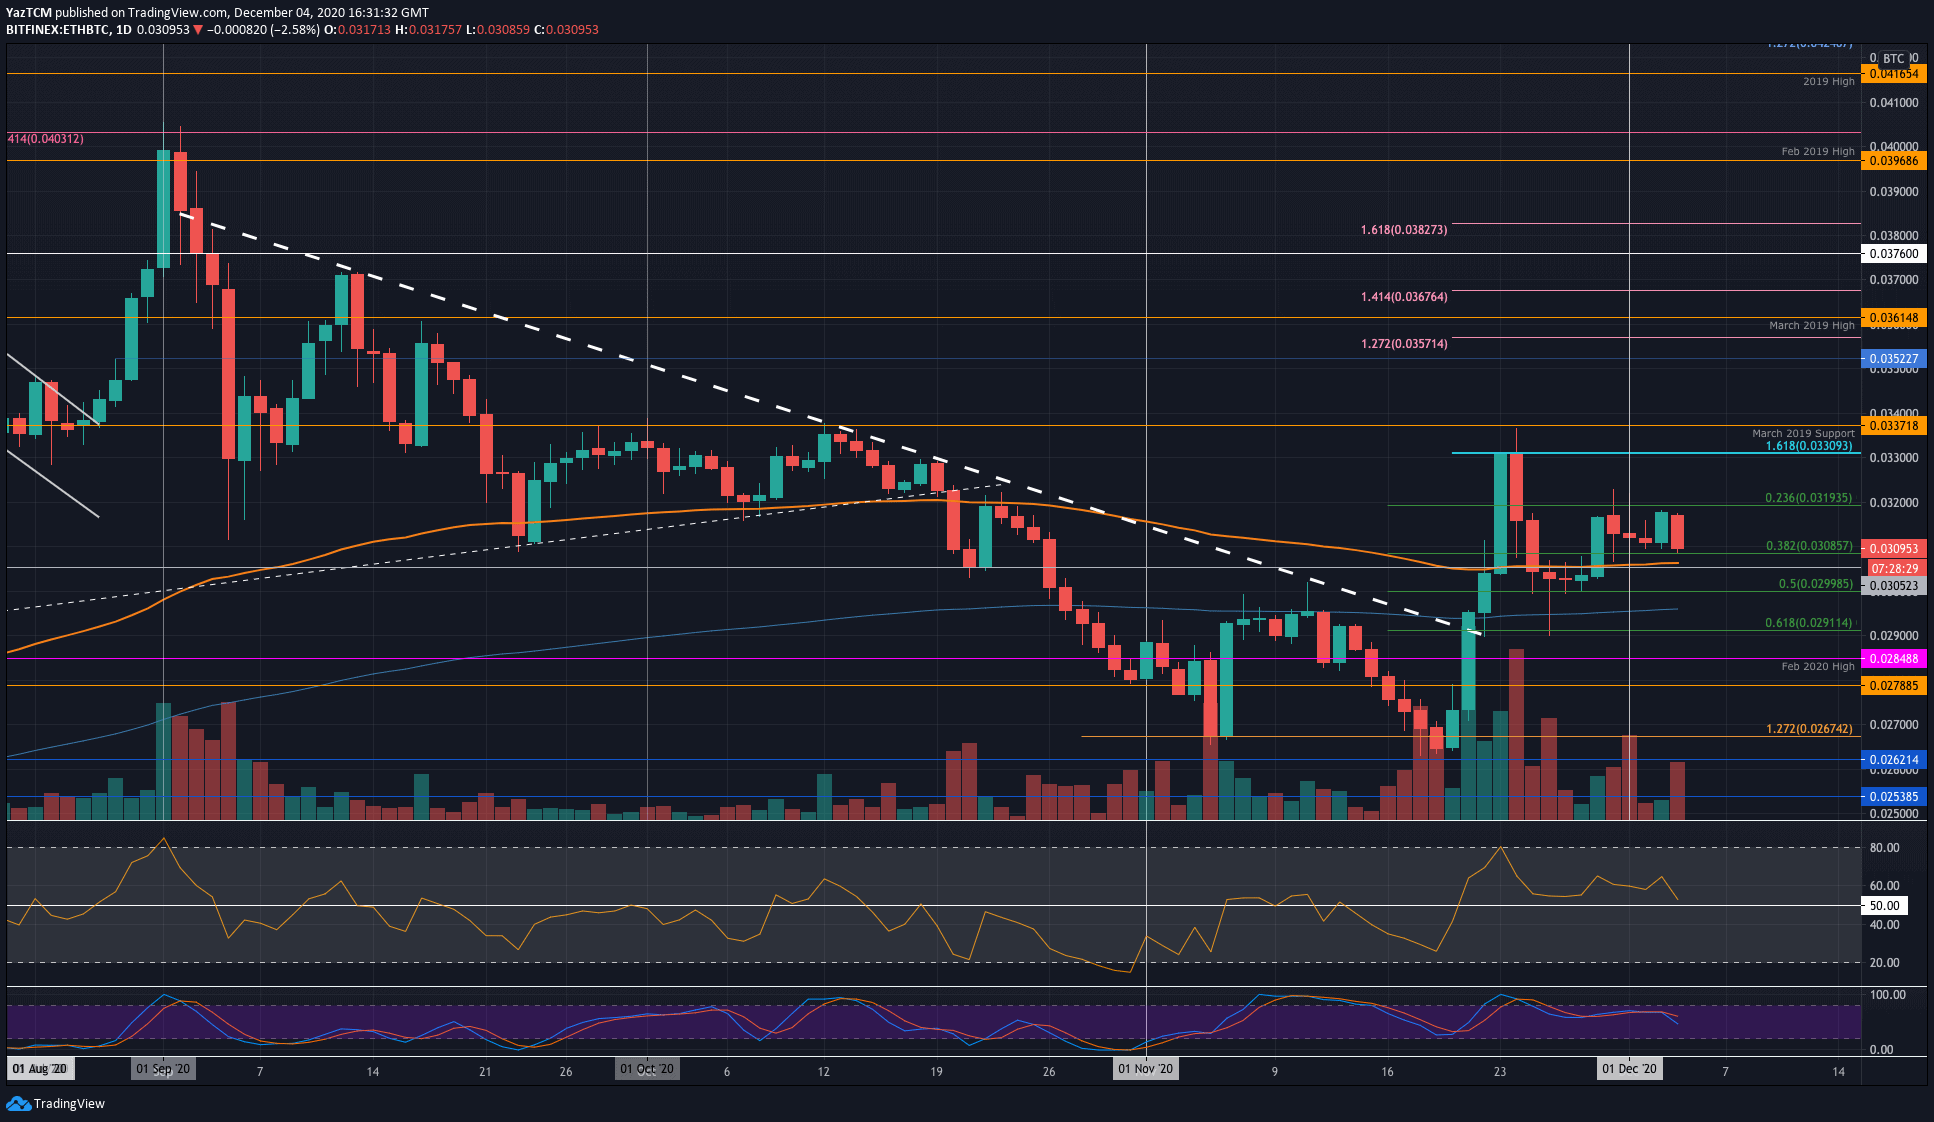
Against Bitcoin, Ethereum managed to rebound from the support at 0.03 BTC (.5 Fib) last Friday as it pushed higher to reach the 0.032 BTC resistance. During the December period so far, Etheruem has been rangebound between 0.032 BTC and 0.0308 BTC and must break this range to dictate the market’s next direction.
Looking ahead, if the bulls push higher, the first level of resistance to break lies at 0.032 BTC. Above this, resistance lies at 0.033 BTC, 0.0337 BTC (March 2018 Support), and 0.035 BTC.
On the other side, the first level of support lies at 0.0308 BTC (.382 Fib). beneath this, support is found at 0.0305 BTC (100-day EMA), 0.0299 BTC (.5 Fib), and 0.0291 BTC (.618 Fib).
Ripple
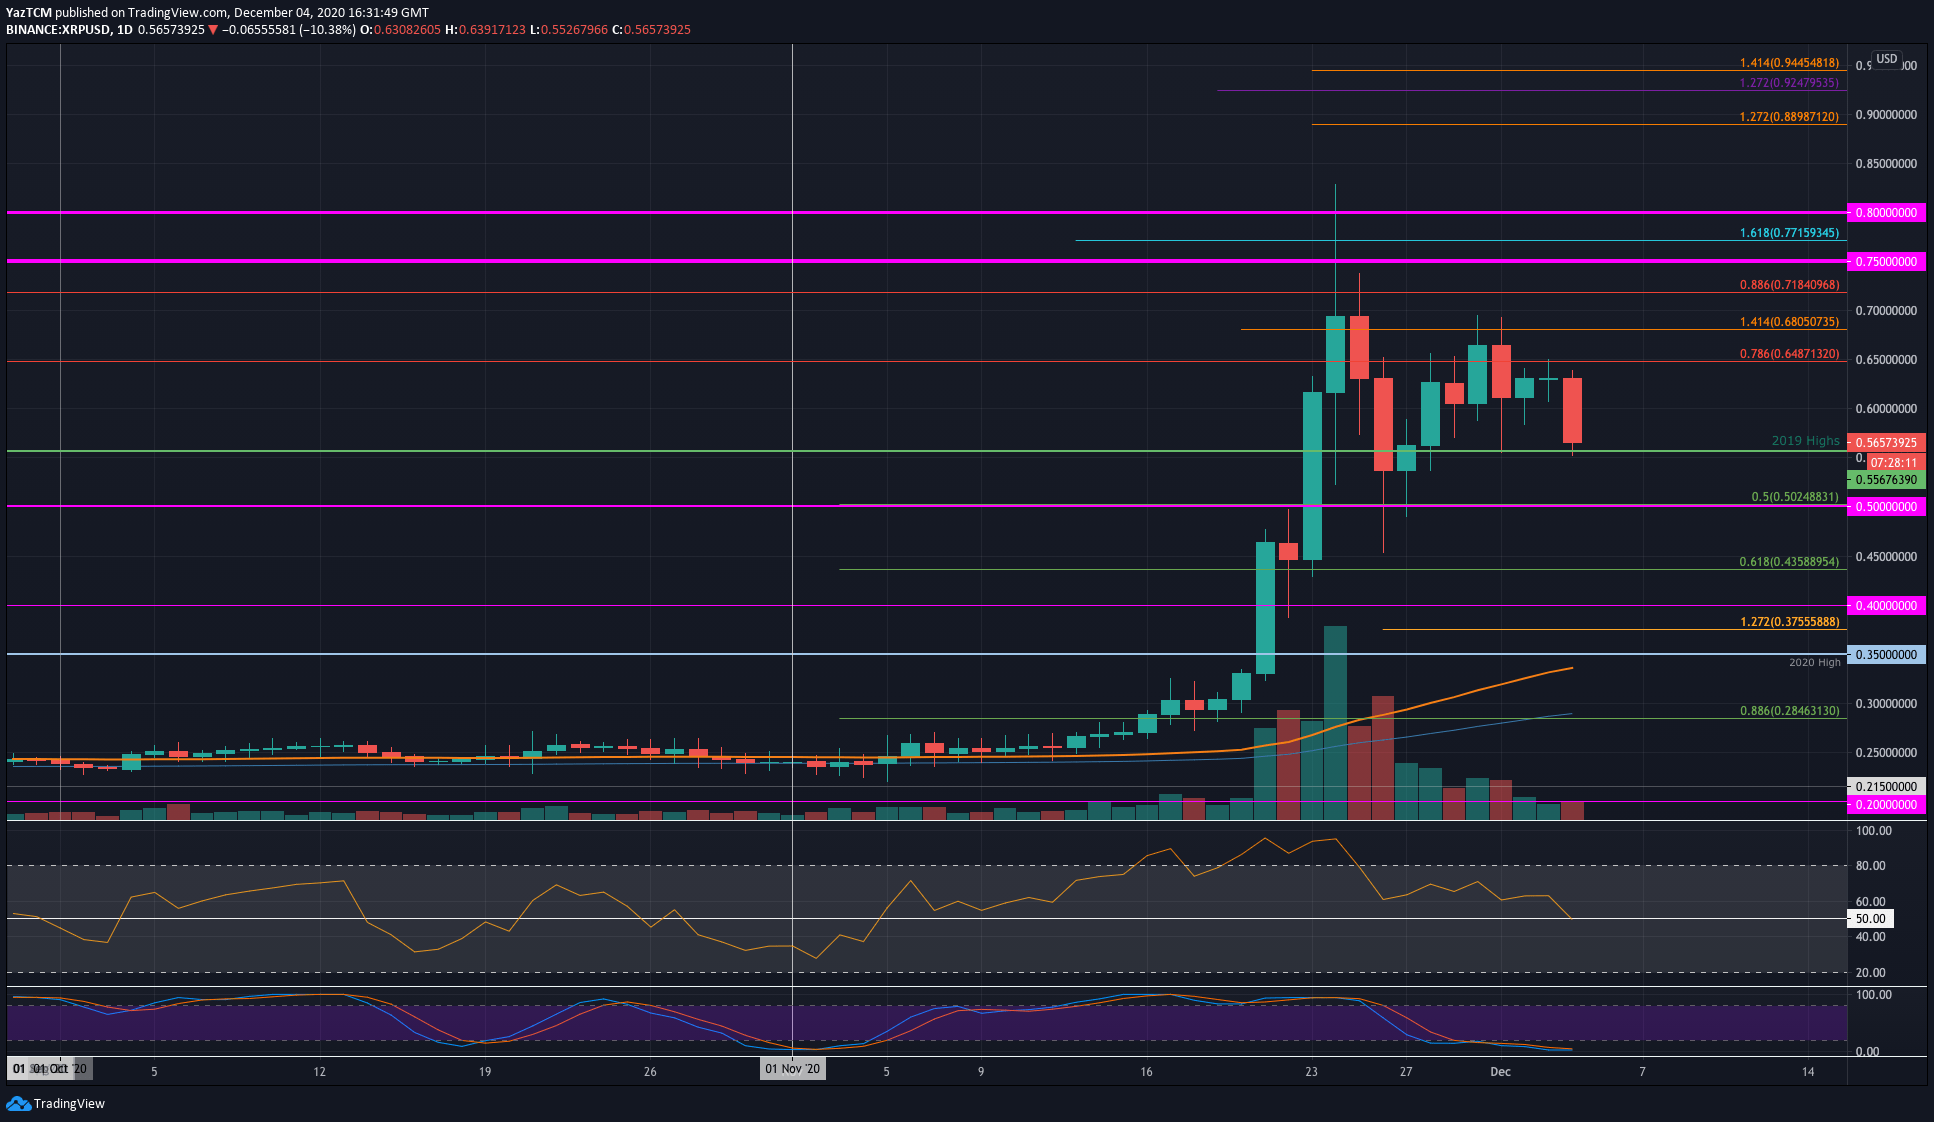
Ripple saw a smaller 7.6% price hike over the past week but dropped by a steel 10% over the past 24 hours as it trades at $0.55 (2019 Highs). The coin attempted to push higher during the week after rebounding from $0.5 last Friday.
It managed to break as high as $0.67 but was unable to close a daily candle above here. Yesterday, it met resistance at $0.648 (bearish .786 Fib) and rolled over to hit the $0.556 support today.
Moving forward, if the sellers break the 2019 highs at $0.556, the first level of support lies at $0.5 (.5 Fib). Beneath this, support lies at $0.435 (.618 Fib), $0.4, and $0.35.
On the other side, the first level of resistance lies at $0.6. This is followed by $0.648 (bearish .786 Fib), $0.68, $0.718 (bearish .886 Fib), and $0.75.
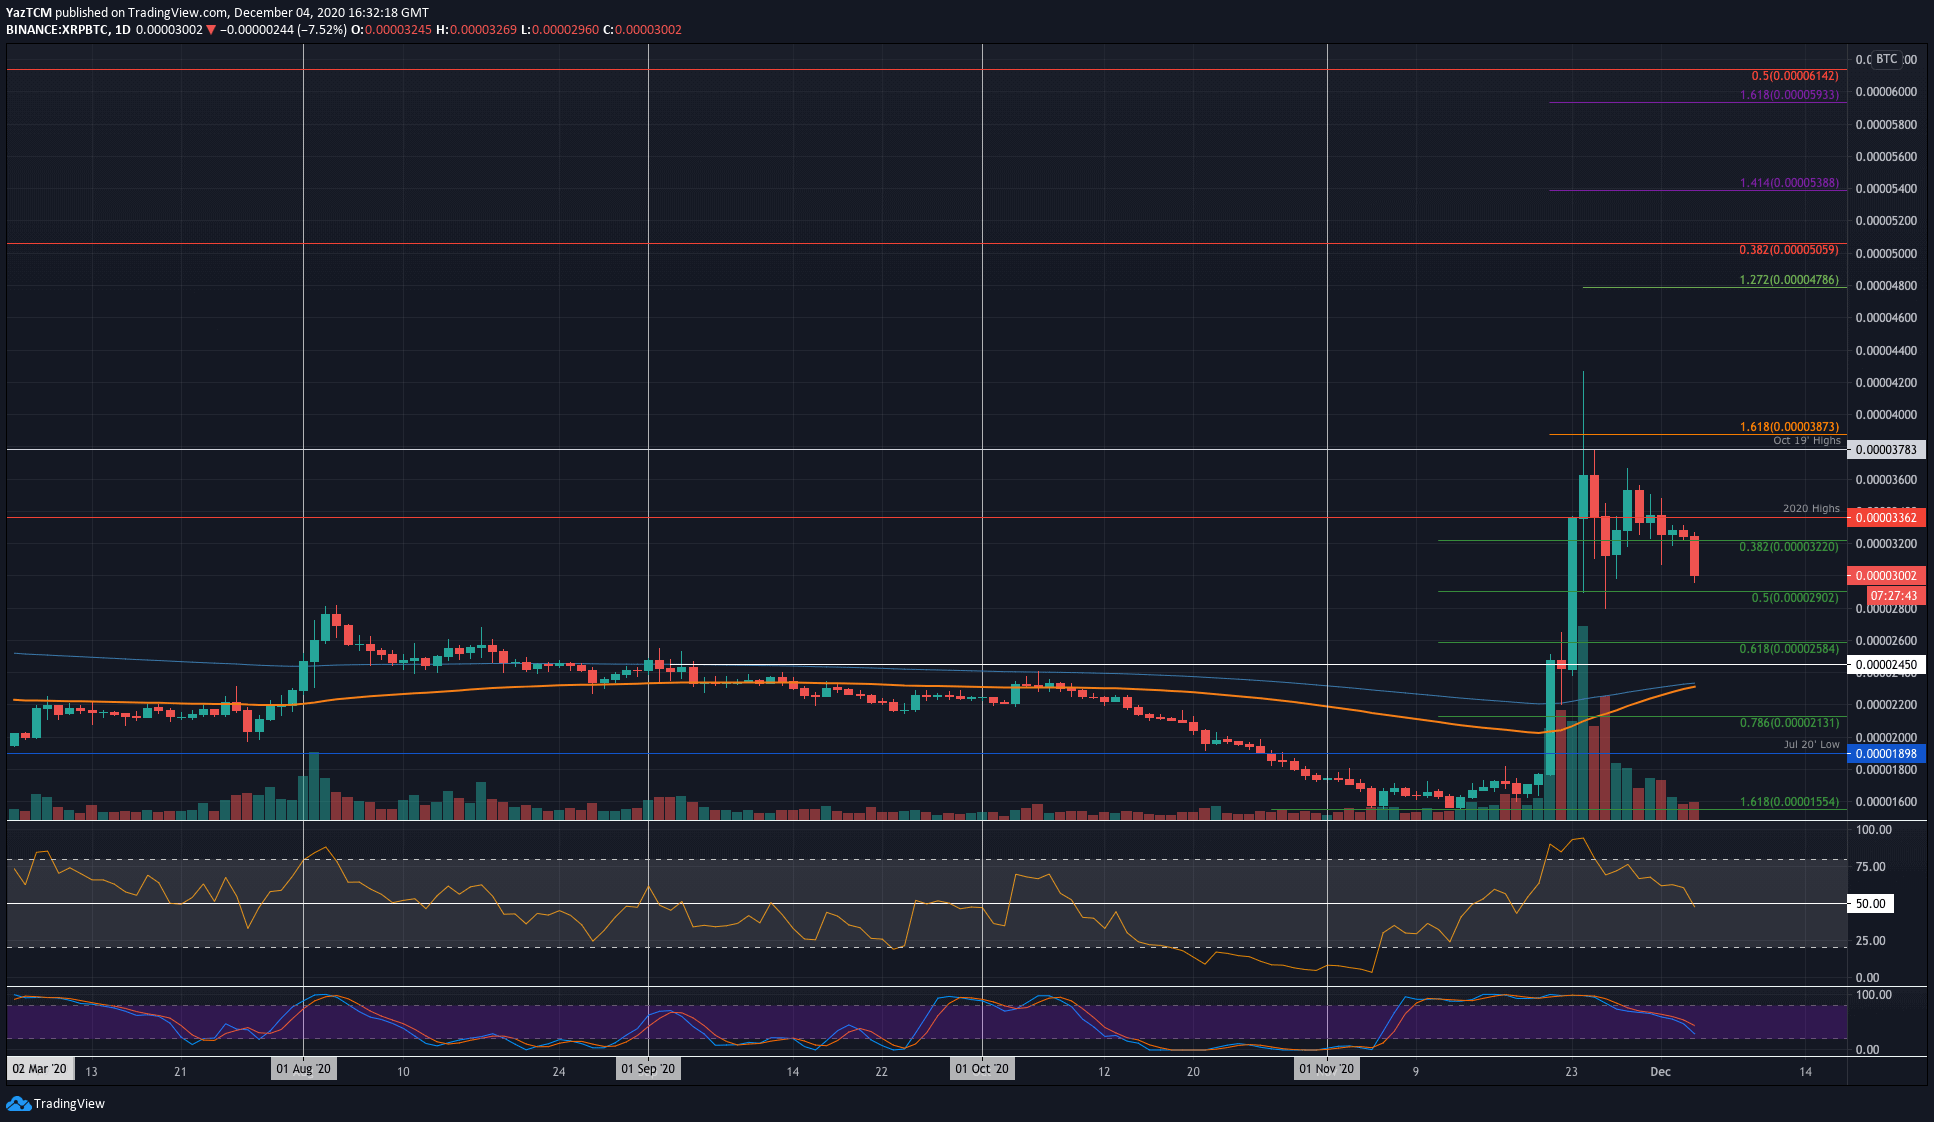
XRP has started to head lower again against Bitcoin this week. The coin started the week by trading near the 3600 SAT level but has since dropped to 3000 SAT. Today, it broke beneath crucial support at 3220 SAT (.382 Fib) to hit 3000 SAT.
Looking ahead, if the sellers break 3000 SAT, the first level of support lies at 2900 SAT (.5 Fib). Beneath this, support is found at 2585 SAT (.618 Fib), 2450 SAT, and 2200 SAT.
Alternatively, the first level of resistance lies at 3200 SAT. Above this, resistance is found at 3360 SAT, 3600 SAT, and 3785 SAT (October 2019 highs).
Bitcoin Cash
Bitcoin Cash saw a small 6.3% price hike this week as the coin trades at the $289.50 level. It had rebounded from the support around $260 last Friday and managed to surge as high as $318.90 on Monday – where it met resistance at a bearish .5 Fib Retracement.
From there, BCH has dropped lower over the past few days to break beneath $300 and trade around $390.
Looking ahead, if the selling continues, the first level of support lies at $280. Beneath this, $270 (.786 Fib), $256 (.886 Fib), and $240.
On the other side, the first level of resistance lies at $300. Above this, $318.90 (bearish .5 Fib), $341 (1.272 Fib Extension), and $351 (March High-Day Closing Price).

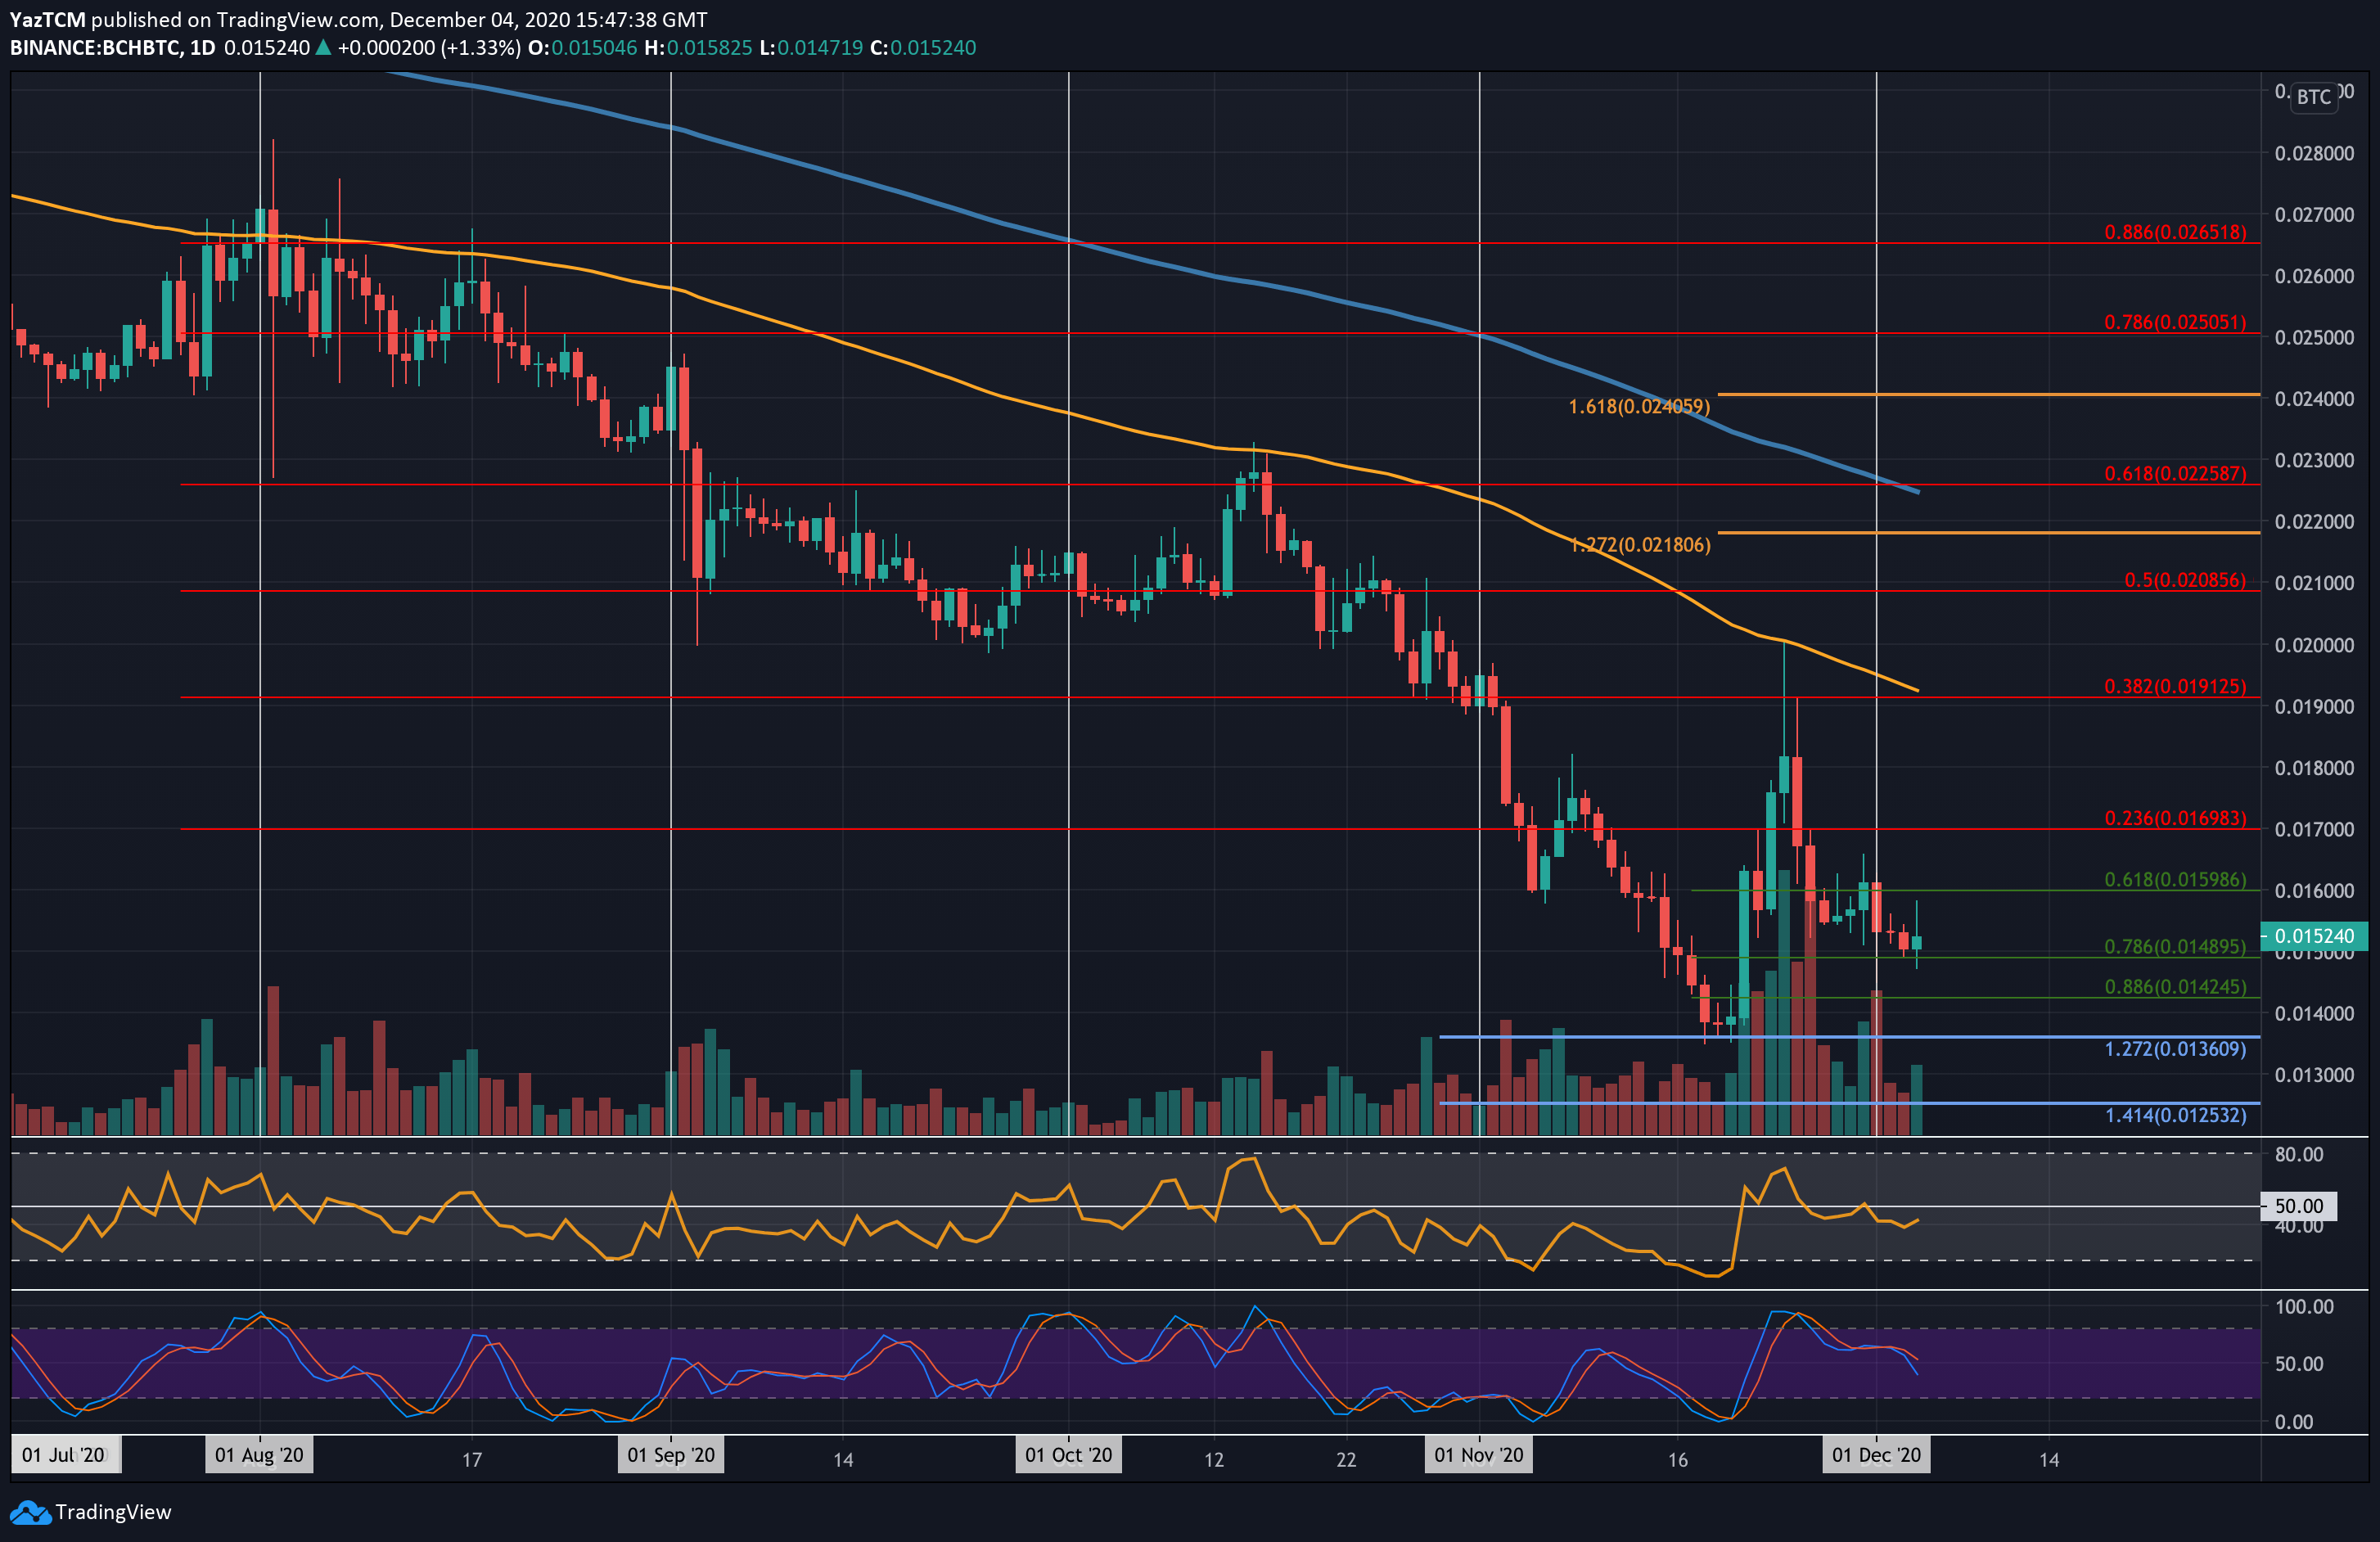
Against Bitcoin, BCH dropped lower from 0.016 BTC to reach the current support at 0.0148 (.786 Fib Retracement). The cryptocurrency had rebounded from 0.013 BTC earlier in November but was never able to break the resistance at 0.02 BTC – provided by the 100-days EMA.
From there, BCH has been falling against Bitcoin to reach the current 0.0148 BTC support.
Looking ahead, if the sellers push beneath 0.0148 BTC, the first level of support lies at 0.0142 BTC (.886 Fib). This is followed by 0.014 BTC, 0.0136 BTC, and 0.013.
On the other side, resistance is first expected at 0.016 BTC. This is followed by resistance at 0.017 BTC (bearish .236 Fib), 0.018 BTC, and 0.0191 BTC (bearish .382 FIb and 100-days EMA).
Litecoin
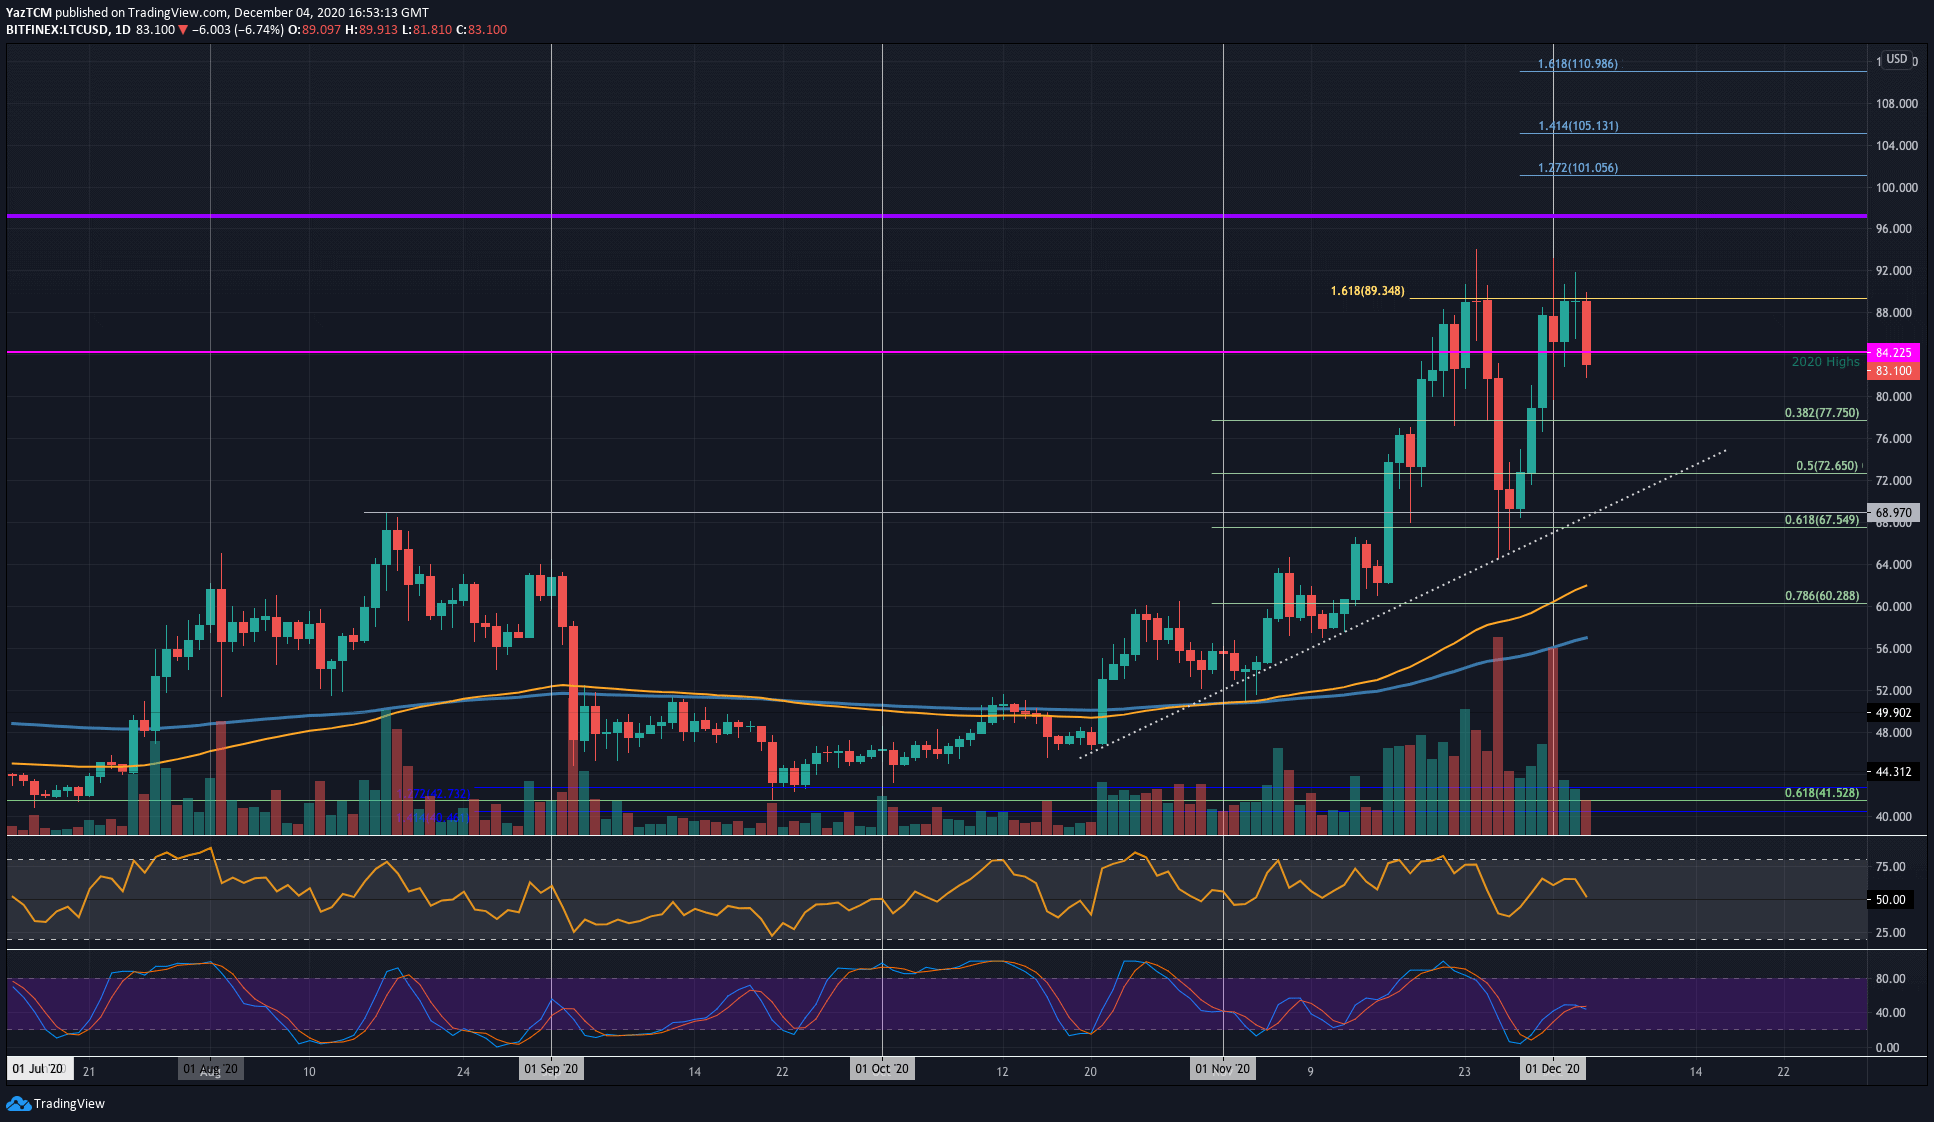
Litecoin saw a robust 17.5% price hike this week as it trades at the $83.10 level. The cryptocurrency rebounded from $69 last week as it started to push higher. By Tuesday, it had reached the resistance at $89.35 (1.618 Fib Extension). The coin had attempted to break this resistance during November but failed to overcome the level.
The same thing happened this week when Litecoin re-attempted to break $89.35. The buyers were unable to close a daily candle above the resistance, which caused it to roll over and reach the current $83.10 level.
Moving forward, if the sellers drop the price lower, the first level of support lies at $80. Beneath this, $77.75 (.382 Fib), $72.65 (.5 Fib), a rising trend line, and $69 will provide support.
On the other side, resistance lies at $84.22. Above this, resistance is found at $89.35, $96, $100, and $101.
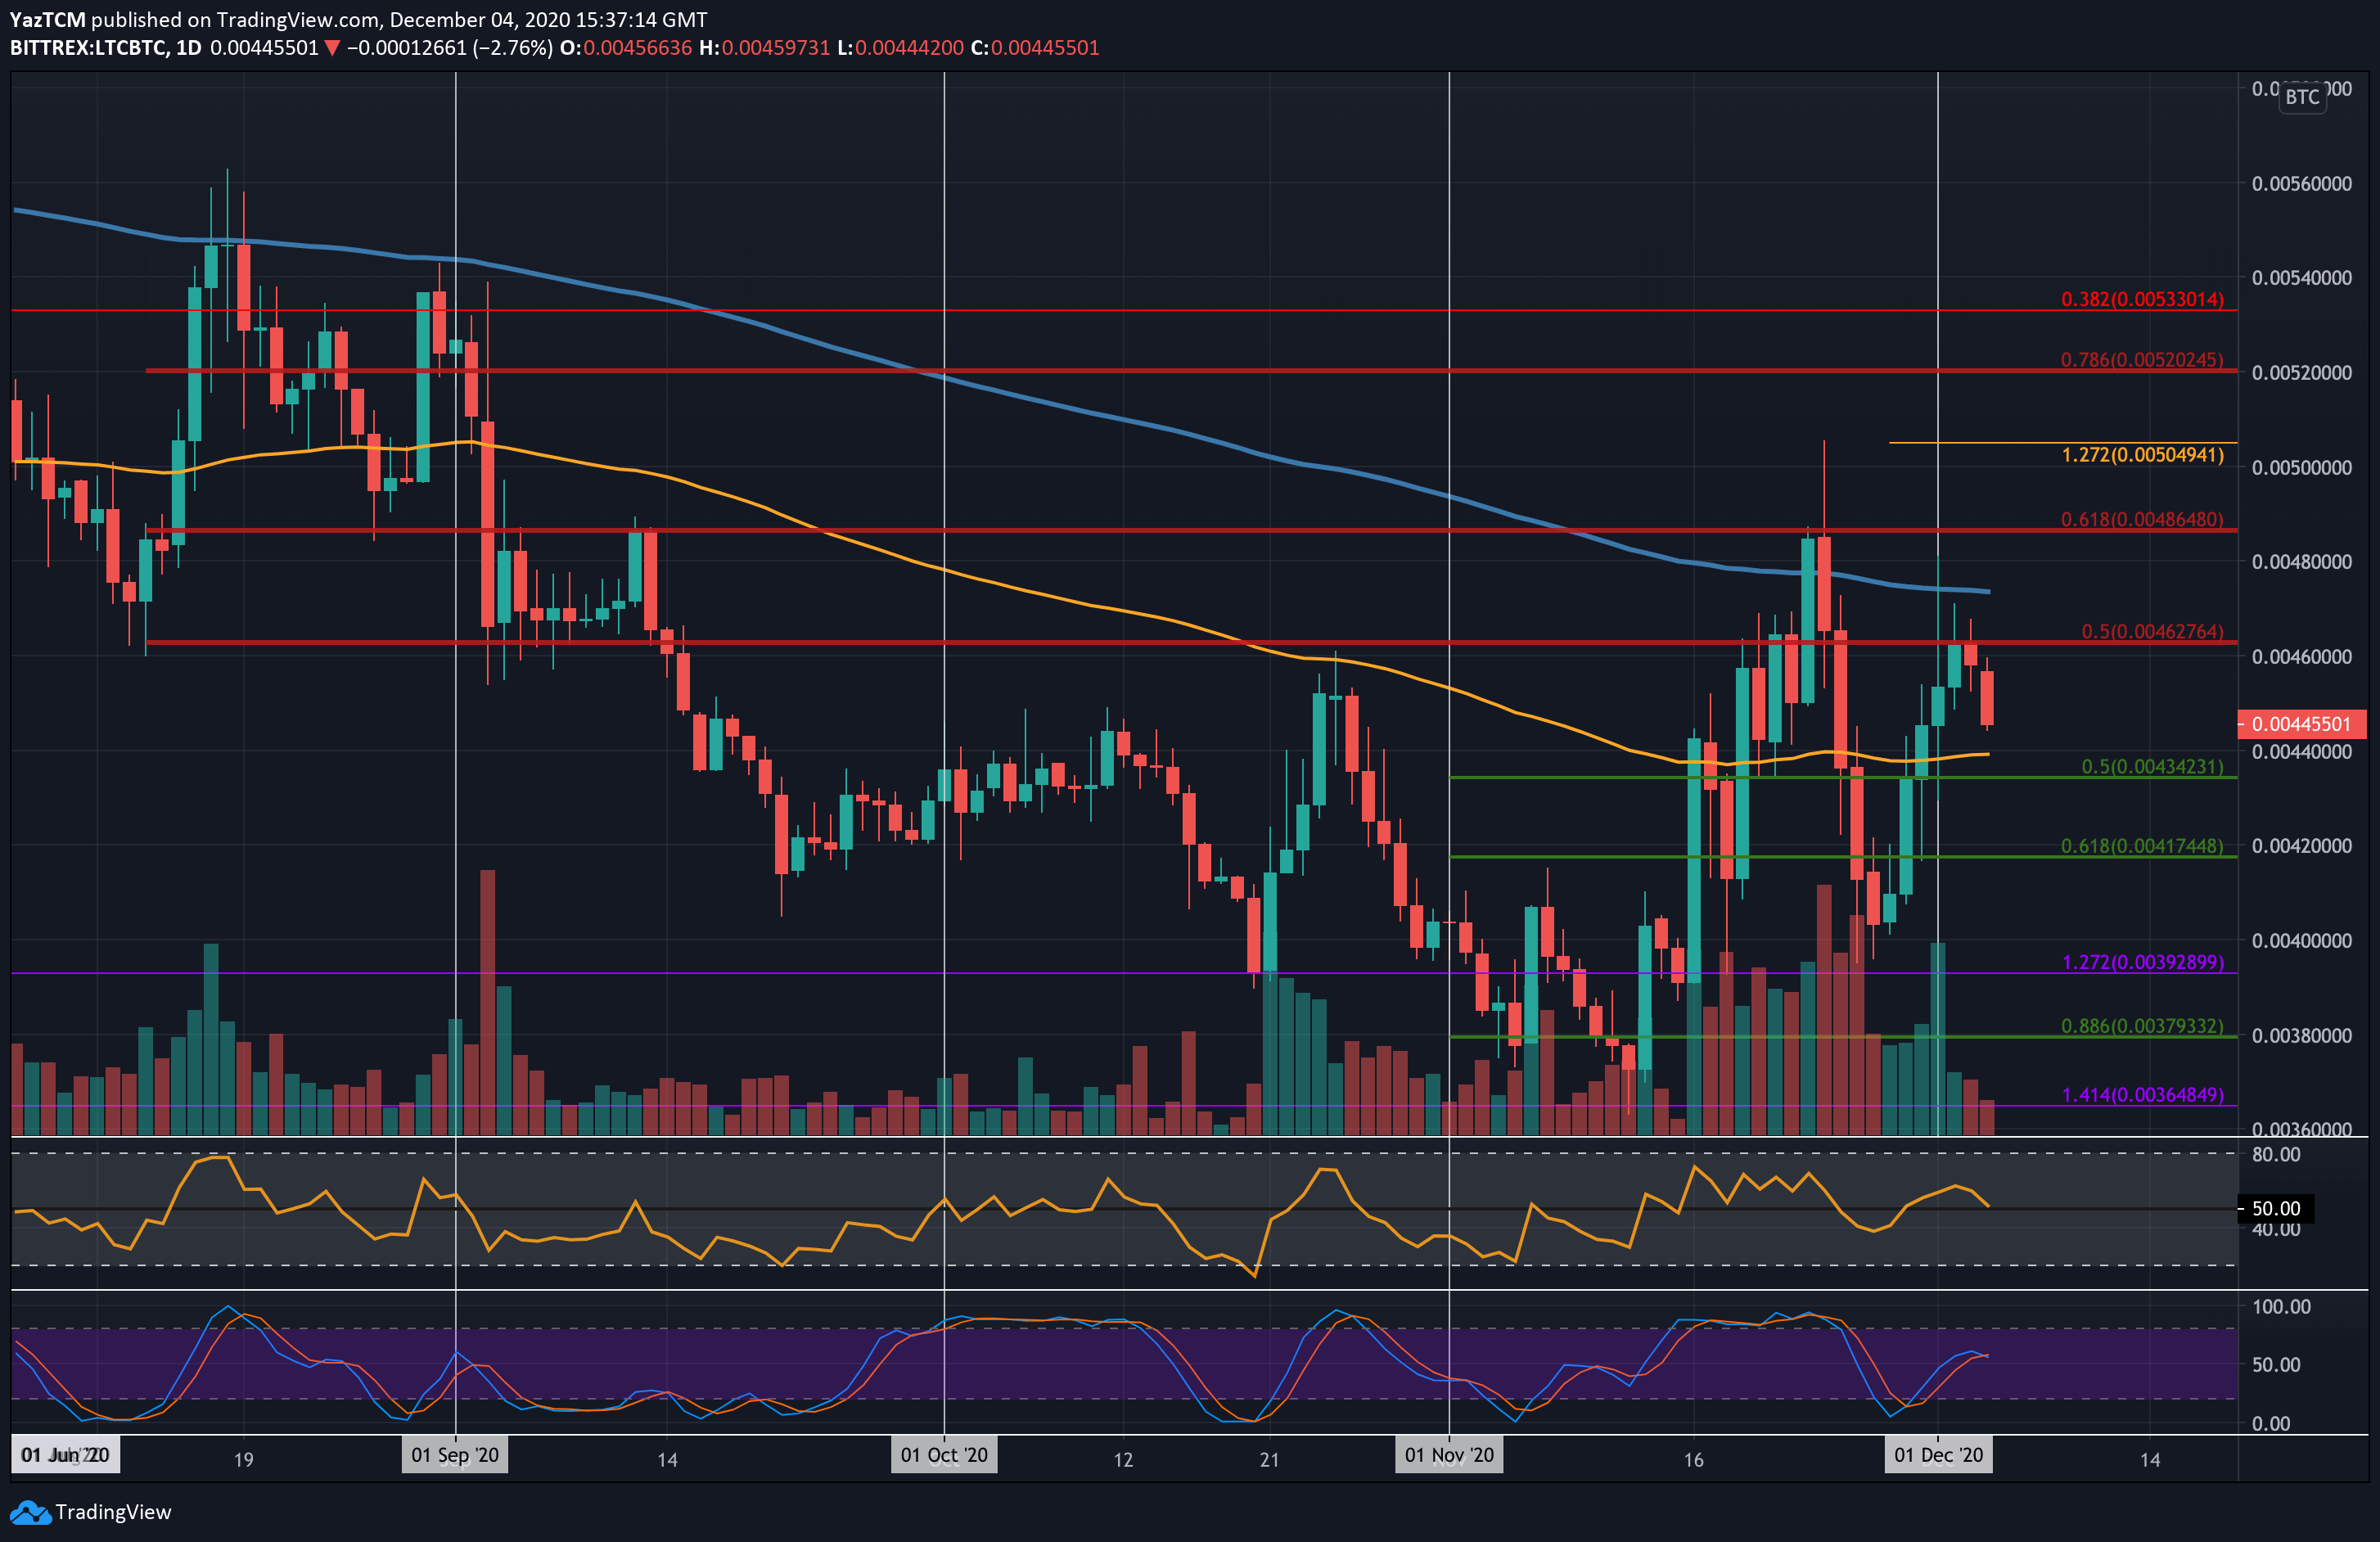
Against Bitcoin, Litecoin had surged higher from 0.004 BTC last week as it broke above the 100-days EMA to reach the resistance at 0.00462 BTC (bearish .5 Fib Retracement). It was unable to break above this level yesterday, which caused the coin to roll over and drop into the 0.00445 BTC level.
Looking ahead, if the sellers drive lower, the first level of support lies at 0.0044 BTC (100-days EMA). This is followed by 0.00434 BTC (.5 Fib), 0.00417 BTC (.618 Fib), and 0.004 BTC.
On the other side, resistance is first expected at 0.00462 BTC. This is followed by 0.0047 BTC (.200-days EMA), 0.00486 BTC (bearish .618 Fib Retracement), and 0.005 BTC.
PrimeXBT Special Offer: Use this link to register & enter CRYPTOPOTATO35 code to get 35% free bonus on any deposit up to 1 BTC.
Disclaimer: Information found on CryptoPotato is those of writers quoted. It does not represent the opinions of CryptoPotato on whether to buy, sell, or hold any investments. You are advised to conduct your own research before making any investment decisions. Use provided information at your own risk. See Disclaimer for more information.
Cryptocurrency charts by TradingView.